


文章目录
1. 背景问题介绍
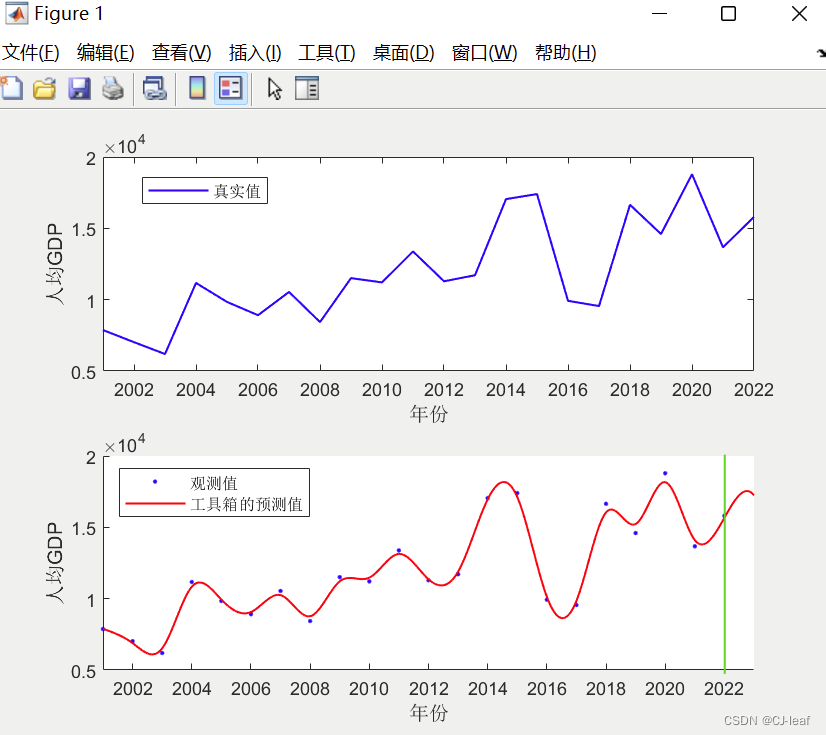
以下是某地2001-2022年的人均GDP数据,需要作出原始数据图像,并预测出未来1年该地的人均GDP,以及作图显示出观测数据与预测数据。
数据如下:
年份  2001, 2002, 2003, 2004, 2005, 2006, 2007, 2008, 2009, 2010, 2011, 2012, 2013, 2014, 2015, 2016, 2017, 2018, 2019, 2020, 2021, 2022
人均GDP  7870, 7020, 6190, 11170, 9840, 8910, 10540, 8430, 11510, 11210, 13380, 11290, 11710, 17050, 17400, 9920, 9550, 16650, 14600, 18790, 13670, 15800
所给的求解代码的效果:
2 附完整的代码以及操作教程
2.1 第一步 复制以下代码到MATLAB,运行后生成MATLAB的工作区数据
clear
close all
clc
% 导入数据
year = 2001:2022;
data = [7870, 7020, 6190, 11170, 9840, 8910, 10540, 8430, 11510, 11210, 13380,...
    11290, 11710, 17050, 17400, 9920, 9550, 16650, 14600, 18790, 13670, 15800];
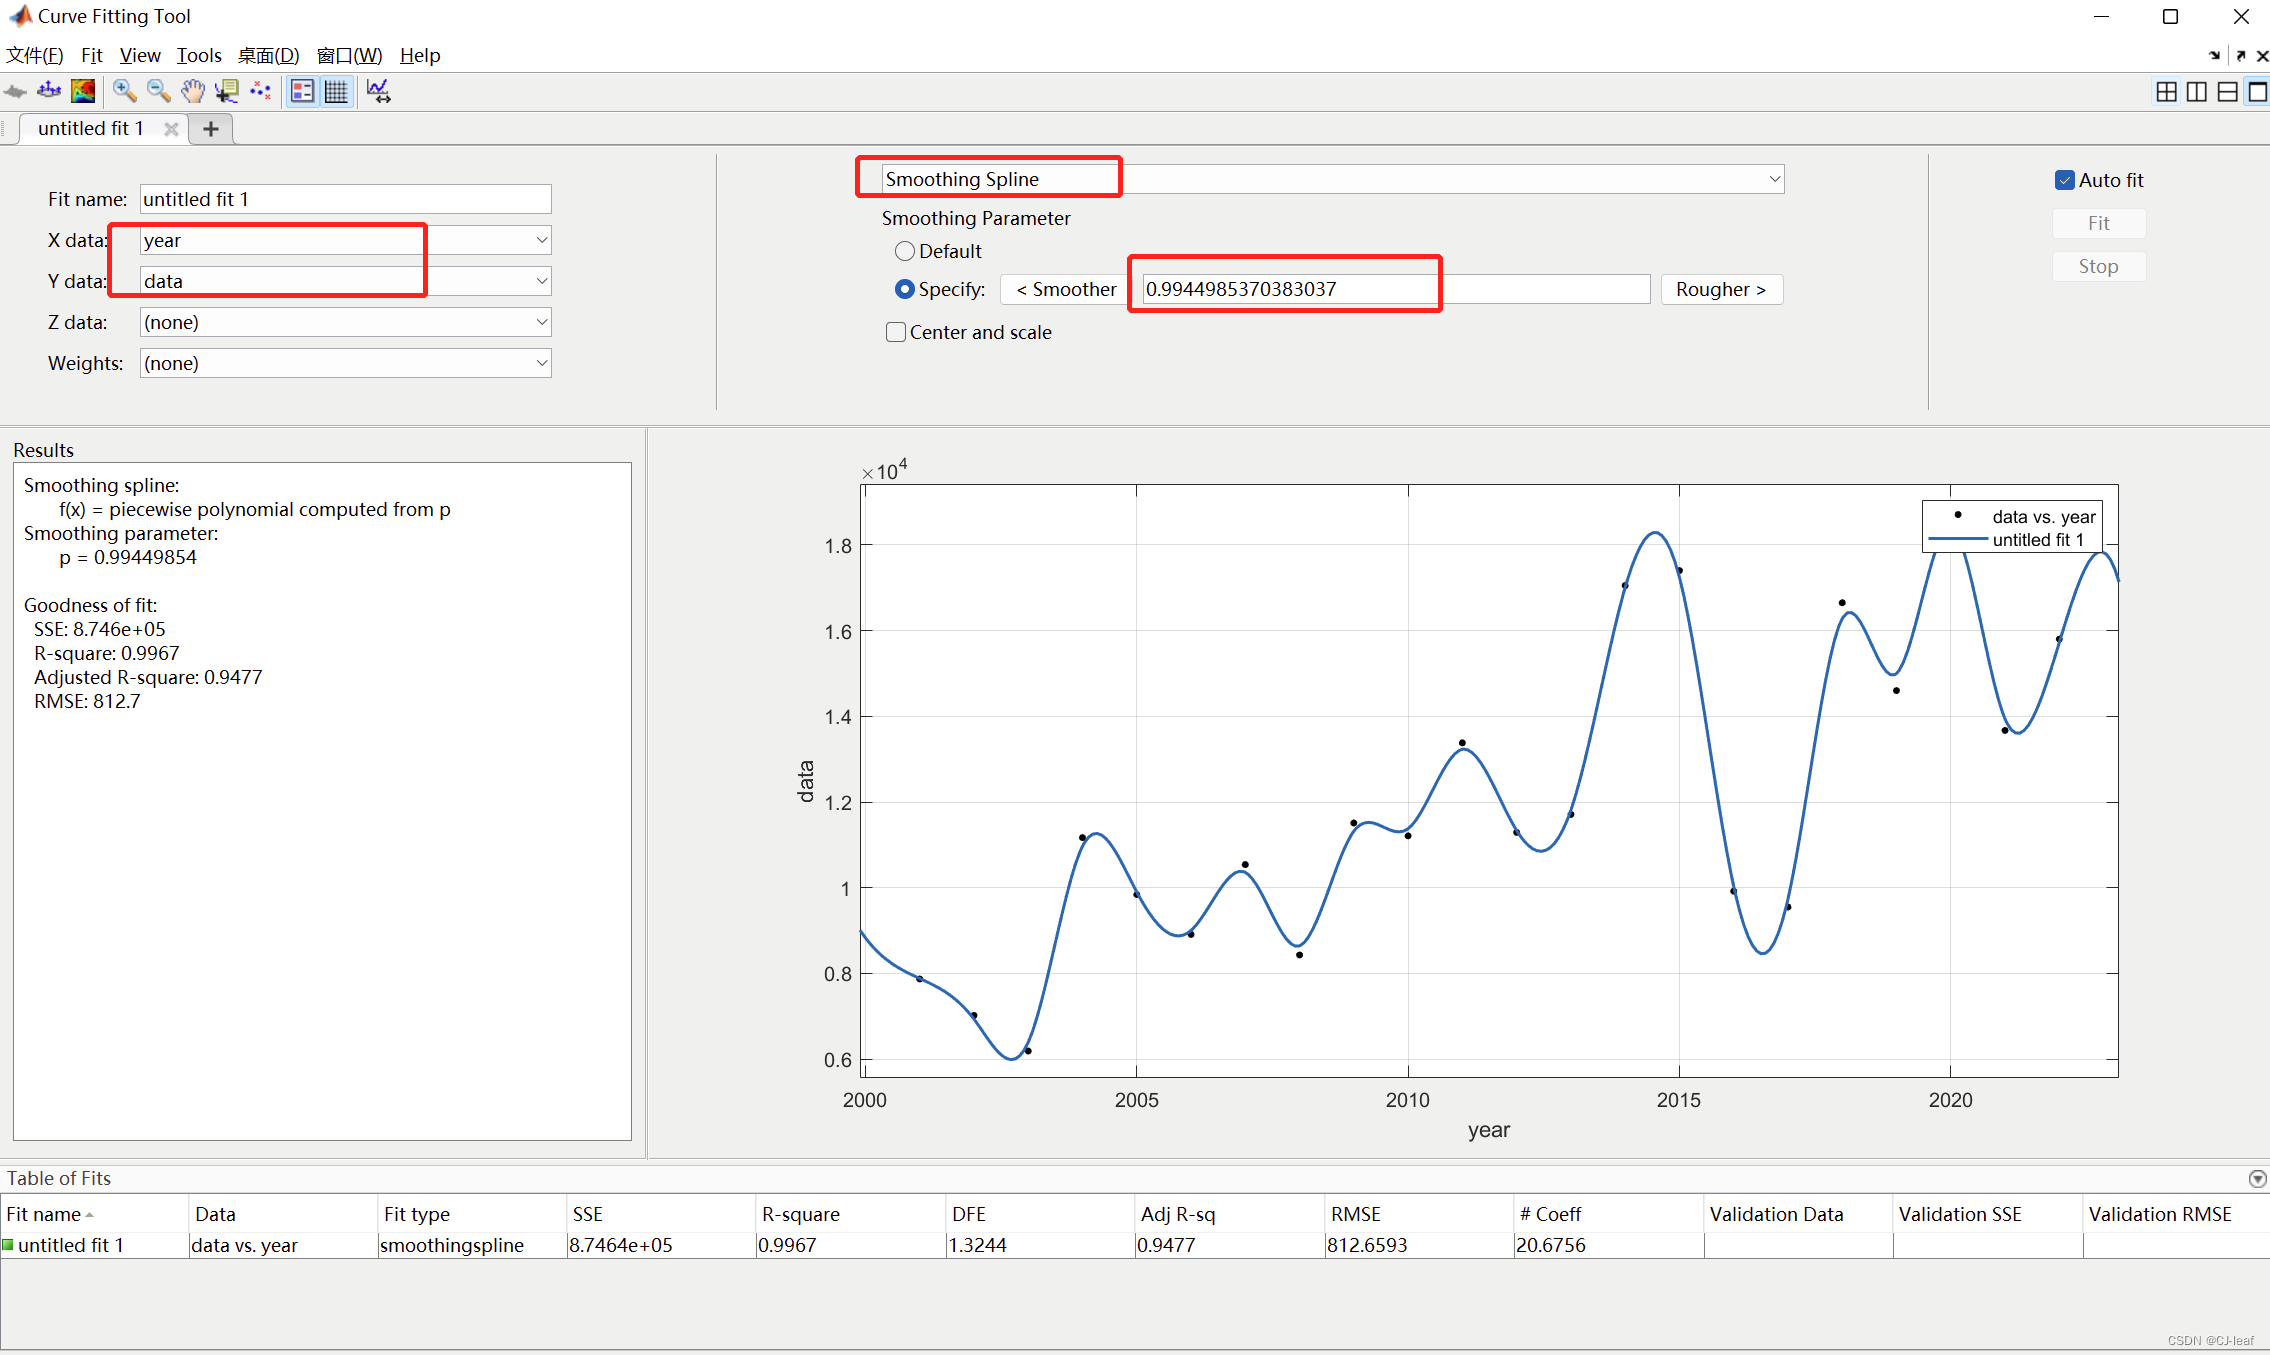
2.2 第二步 打开工具箱进行拟合,如下所示的截图
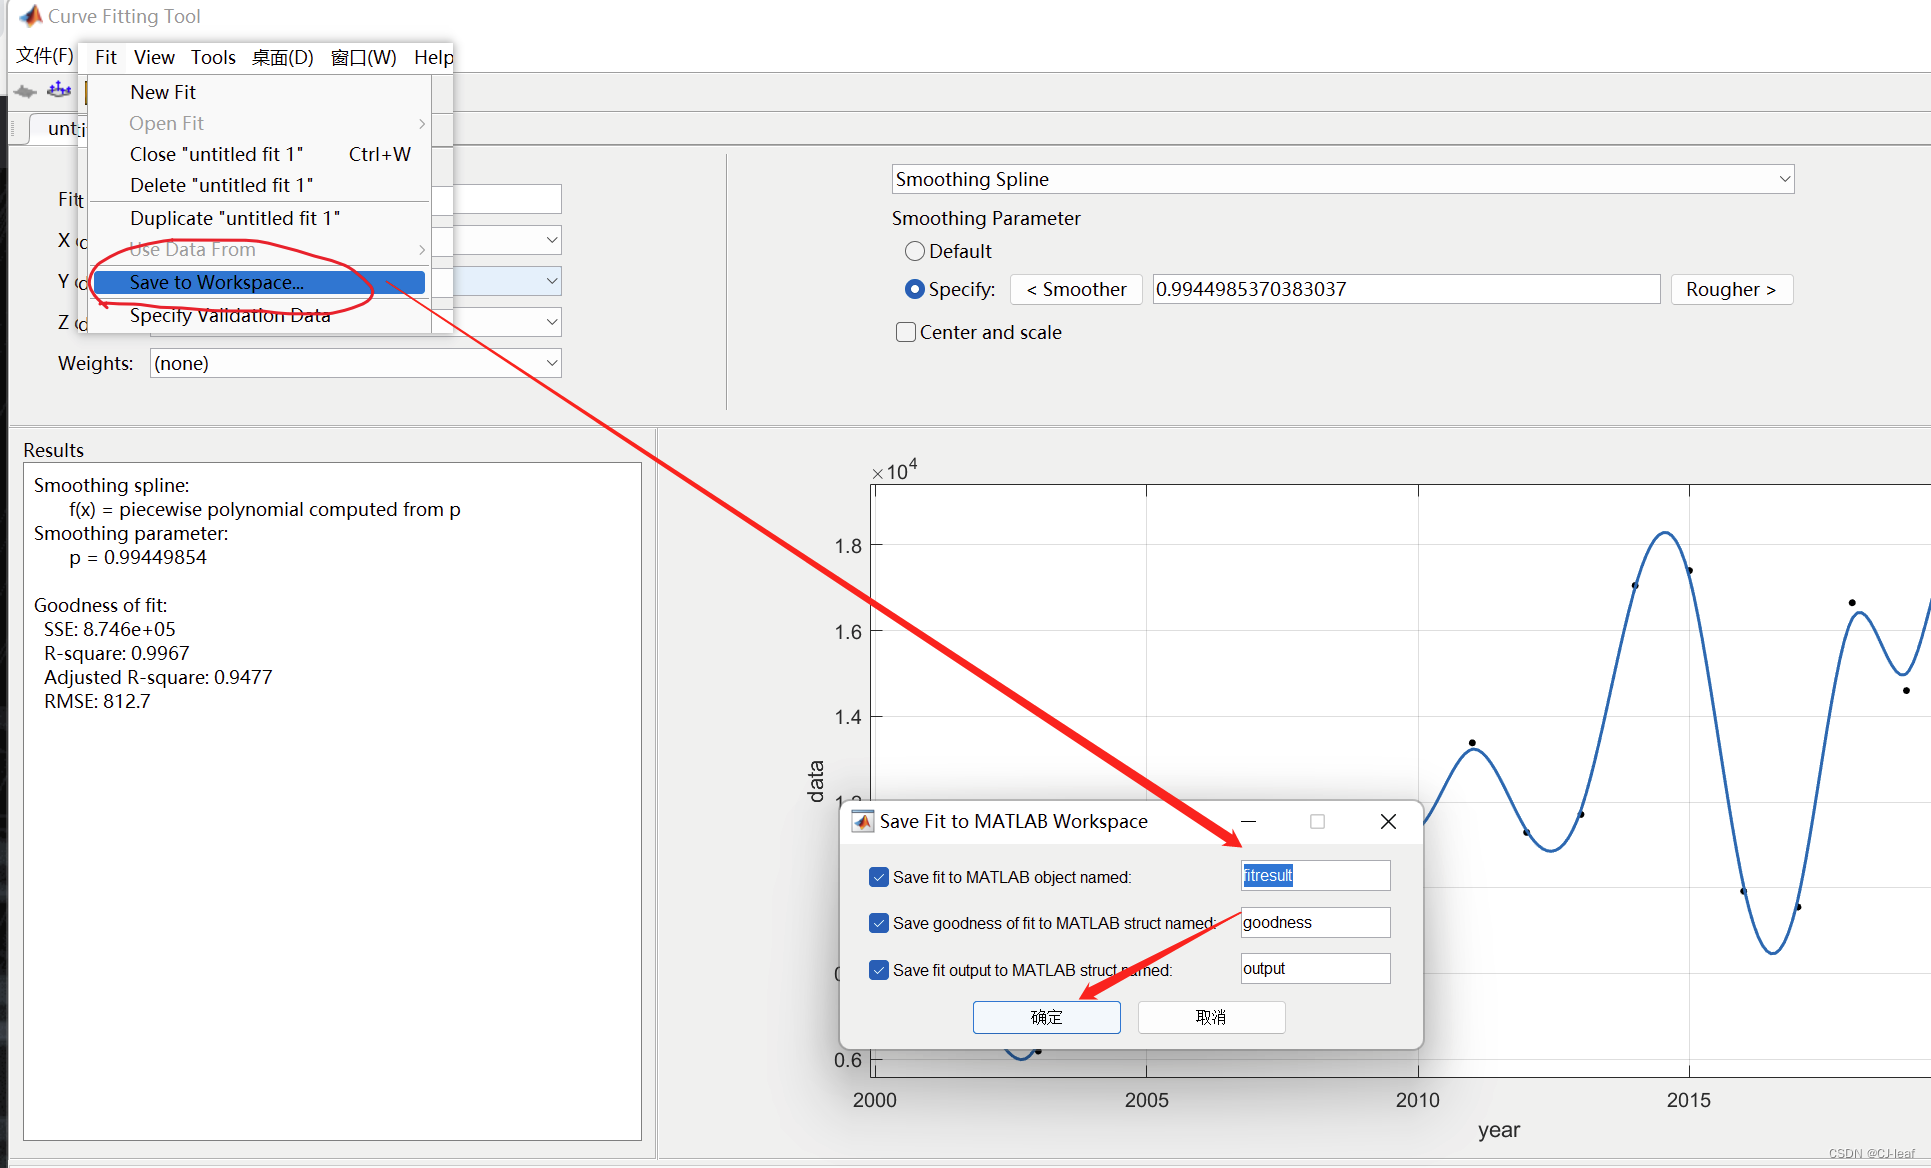
2.3 第三步 从工具箱导出拟合的模型至MATLAB工作区
2.4 第四步 复制以下代码到MATLAB中运行,代码会调用工作区的模型进行预测未来GDP值和作图
% 预测
predictValue = feval(fitresult, 2001:.05:2023);
subplot(212);
hold on
plot(2001:2022, data, 'b.', 'LineWidth', 1.0, 'MarkerSize', 6)
plot(2001:.05:2023, predictValue, 'r-', 'LineWidth', 1.0)
xlabel('年份')
ylabel('人均GDP')
legend('观测值', '工具箱的预测值', 'Location', 'northwest')

% 生成绿色直线
annotation(h,'line',[0.87 0.87],...
    [0.453 0.105],...
    'Color',[0.392156862745098 0.831372549019608 0.0745098039215686],...
    'LineWidth',1);
xlim([2001,2023])
2.5 也可以不通过工具箱和代码嵌套的方法。直接复制以下代码到MATLAB中运行即可出来全部的结果(代码包含了模拟点击工具箱拟合的操作,运行代码后会自动调用工具箱进行数据拟合与预测)
clear
close all
clc
% 导入数据
year = 2001:2022;
data = [7870, 7020, 6190, 11170, 9840, 8910, 10540, 8430, 11510, 11210, 13380,...
    11290, 11710, 17050, 17400, 9920, 9550, 16650, 14600, 18790, 13670, 15800];

% 做出原始数据图像
h = figure;
subplot(211)
plot(2001:2022, data, 'b-', 'LineWidth', 1.0)
xlim([2001,2022])
xlabel('年份')
ylabel('人均GDP')
legend('真实值')

% 拟合,下列代码模拟了工具箱的点击操作
ft = fittype( 'smoothingspline' );
opts = fitoptions( 'Method', 'SmoothingSpline' );
opts.SmoothingParam = 0.99;

% Fit model to data.
[fitresult, gof] = fit( year', data', ft, opts);

% 预测
predictValue = feval(fitresult, 2001:.05:2023);
subplot(212);
hold on
plot(2001:2022, data, 'b.', 'LineWidth', 1.0, 'MarkerSize', 6)
plot(2001:.05:2023, predictValue, 'r-', 'LineWidth', 1.0)
xlabel('年份')
ylabel('人均GDP')
legend('观测值', '工具箱的预测值', 'Location', 'northwest')

% 生成绿色直线
annotation(h,'line',[0.87 0.87],...
    [0.453 0.105],...
    'Color',[0.392156862745098 0.831372549019608 0.0745098039215686],...
    'LineWidth',1);
xlim([2001,2023])


 477
477


 被折叠的 条评论
为什么被折叠?
被折叠的 条评论
为什么被折叠?
 到【灌水乐园】发言


