


01.10-2 OTSU方法二值化图像源代码
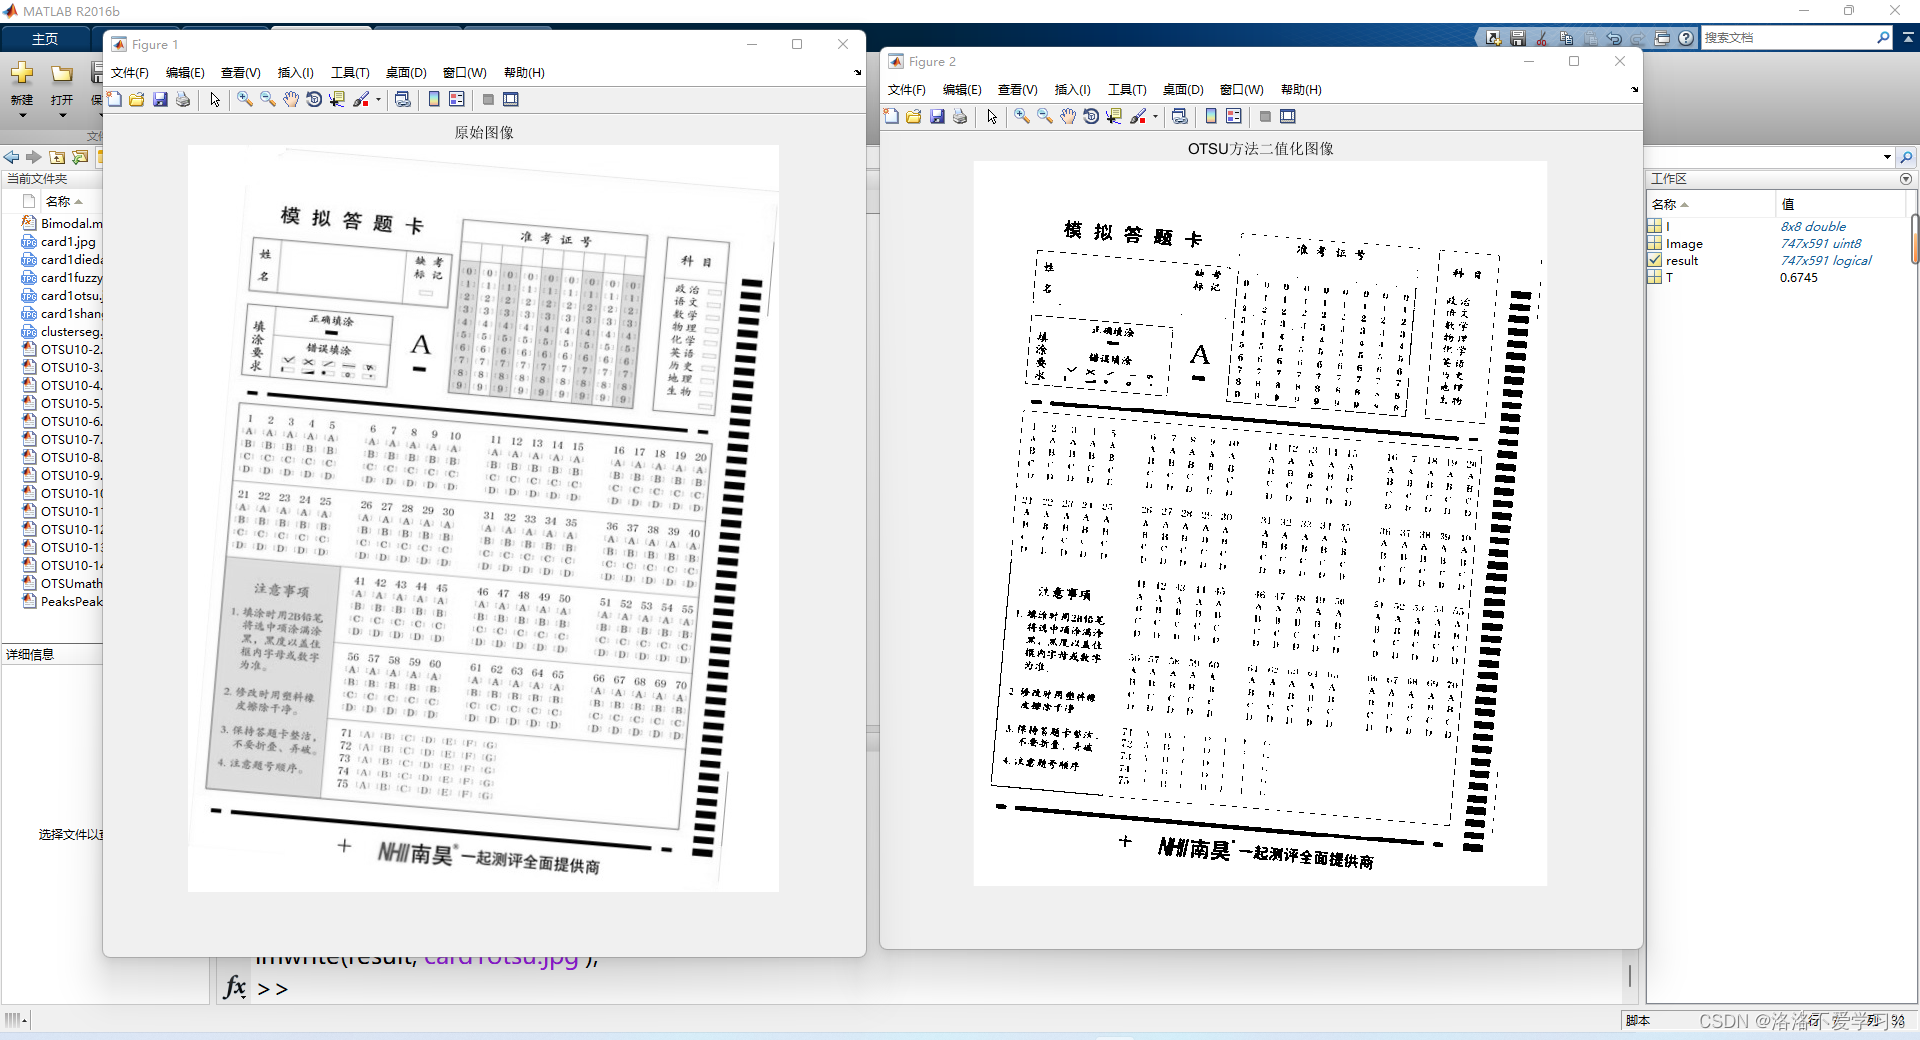
%10-2 OTSU方法二值化图像
Image=rgb2gray(imread('card1.jpg'));
figure,imshow(Image),title('原始图像');
T=graythresh(Image);
result=im2bw(Image,T);
figure,imshow(result),title('OTSU方法二值化图像');
imwrite(result,'card1otsu.jpg');
运行结果截图
02.10-3源代码
%otsu10-3
clear,clc,close all;
Image=rgb2gray(imread('card1.jpg'));
figure,imshow(Image),title('原始图像');
hist=imhist(Image);
bottom=min(Image(:))+1;
top=max(Image(:))+1;
J=zeros(256,1);
for t=bottom+1:top-1
    po=sum(hist(bottom:t));
    pb=sum(hist(t+1:top));
    ho=0;
    hb=0;
    for j=bottom:t
        ho=ho-log(hist(j)/po+0.01)*hist(j)/po;
    end
    for j=t+1:top
        hb=hb-log(hist(j)/pb+0.01)*hist(j)/pb;
    end
    J(t)=ho+hb;
end
[maxJ,pos]=max(J(:));
result=zeros(size(Image));
result(Image>pos)=1;
figure,imshow(result);
imwrite(result,'card1shang.jpg');
运行结果
03.10-7源代码
Image=rgb2gray(imread('card1.jpg'));
bw=edge(Image,'canny');
figure,imshow(bw);
[h,t,r]=hough(bw,'RhoResolution',0.5,'ThetaResolution',0.5);
figure,imshow(imadjust(mat2gray(h)),'XData',t,'YData',r,'InitialMagnification','fit');
xlabel('\theta'),ylabel('\rho');
axis on,axis normal,hold on;
P=houghpeaks(h,2);
x=t(P(:,2));
y=r(P(:,1));
plot(x,y,'s','color','r');
lines=houghlines(bw,t,r,P,'FillGap',5,'Minlength',7);
figure,imshow(Image);
hold on;
max_len=0;
for i=1:length(lines)
    xy=[lines(i).point1;lines(i).point2];
    plot(xy(:,1),xy(:,2),'LineWidth',2,'Color','g');
    plot(xy(1,1),xy(1,2),'x','LineWidth',2,'Color','y');
    plot(xy(2,1),xy(2,2),'x','LineWidth',2,'Color','r');
end 
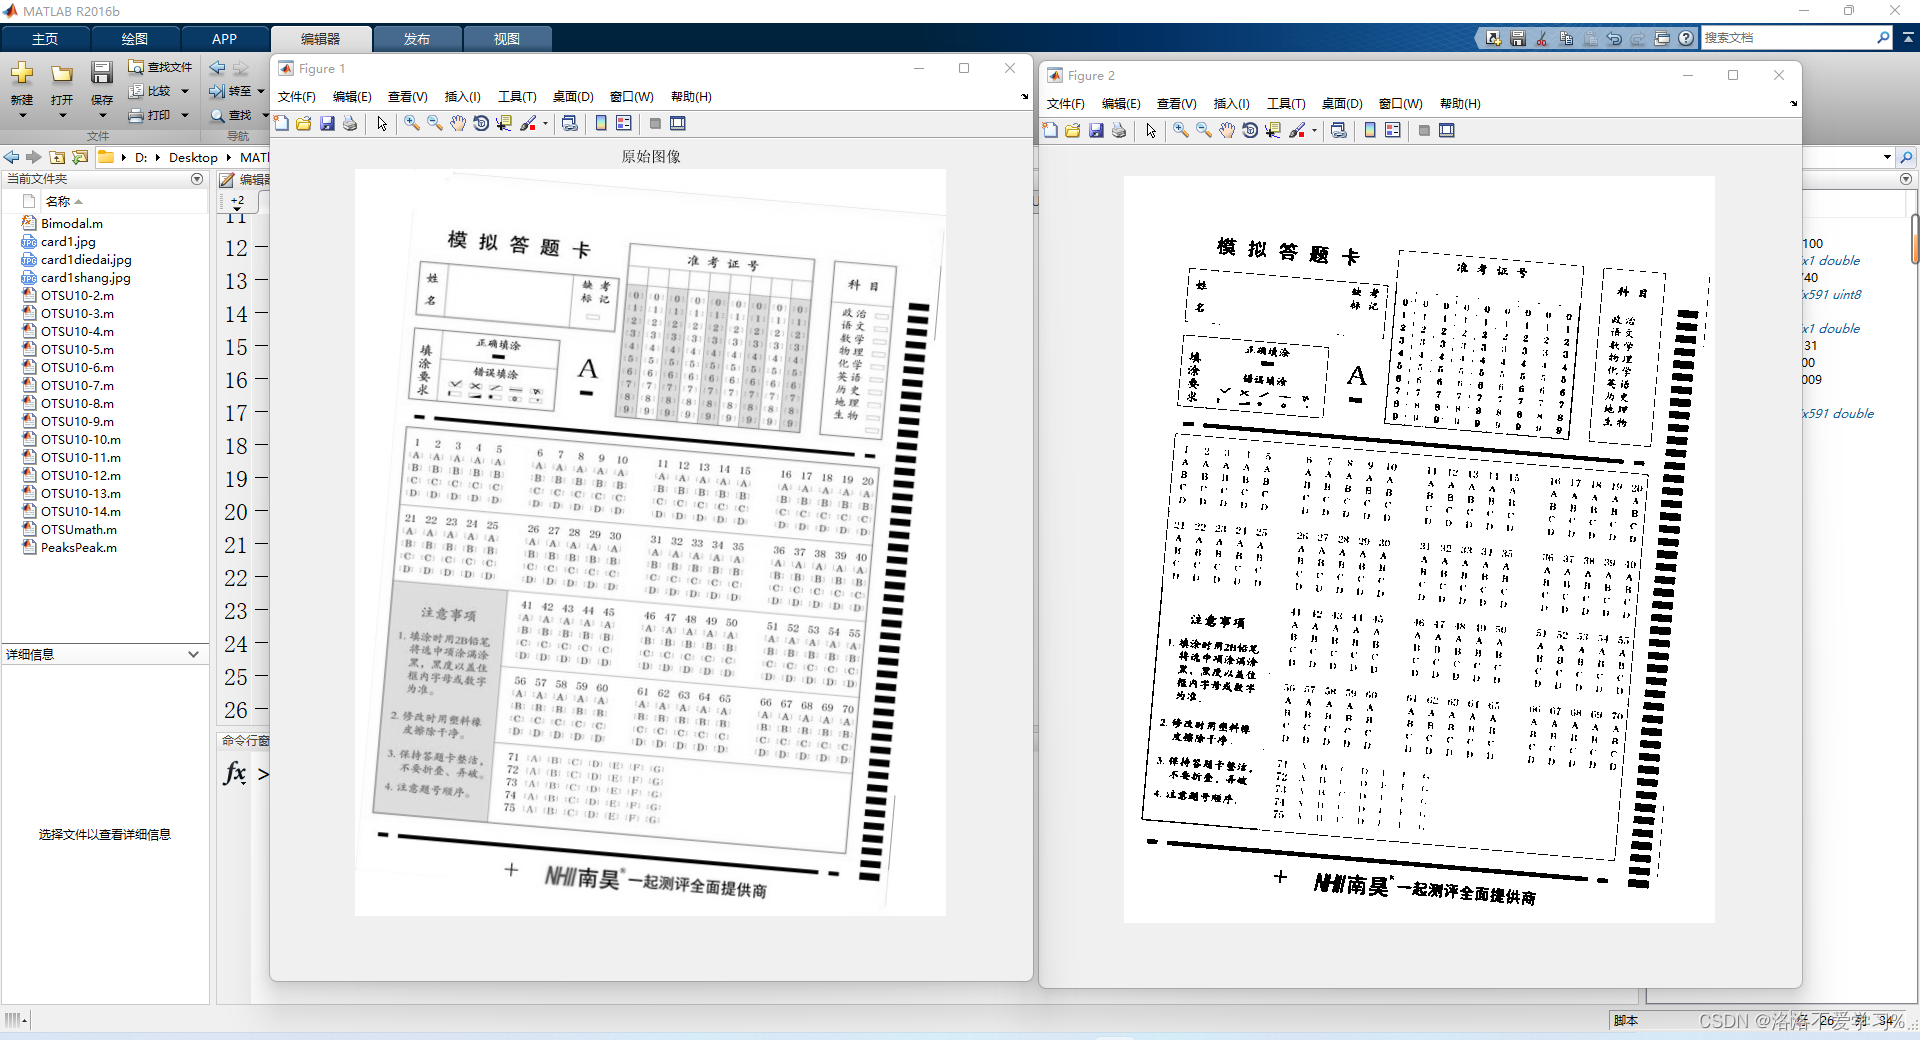
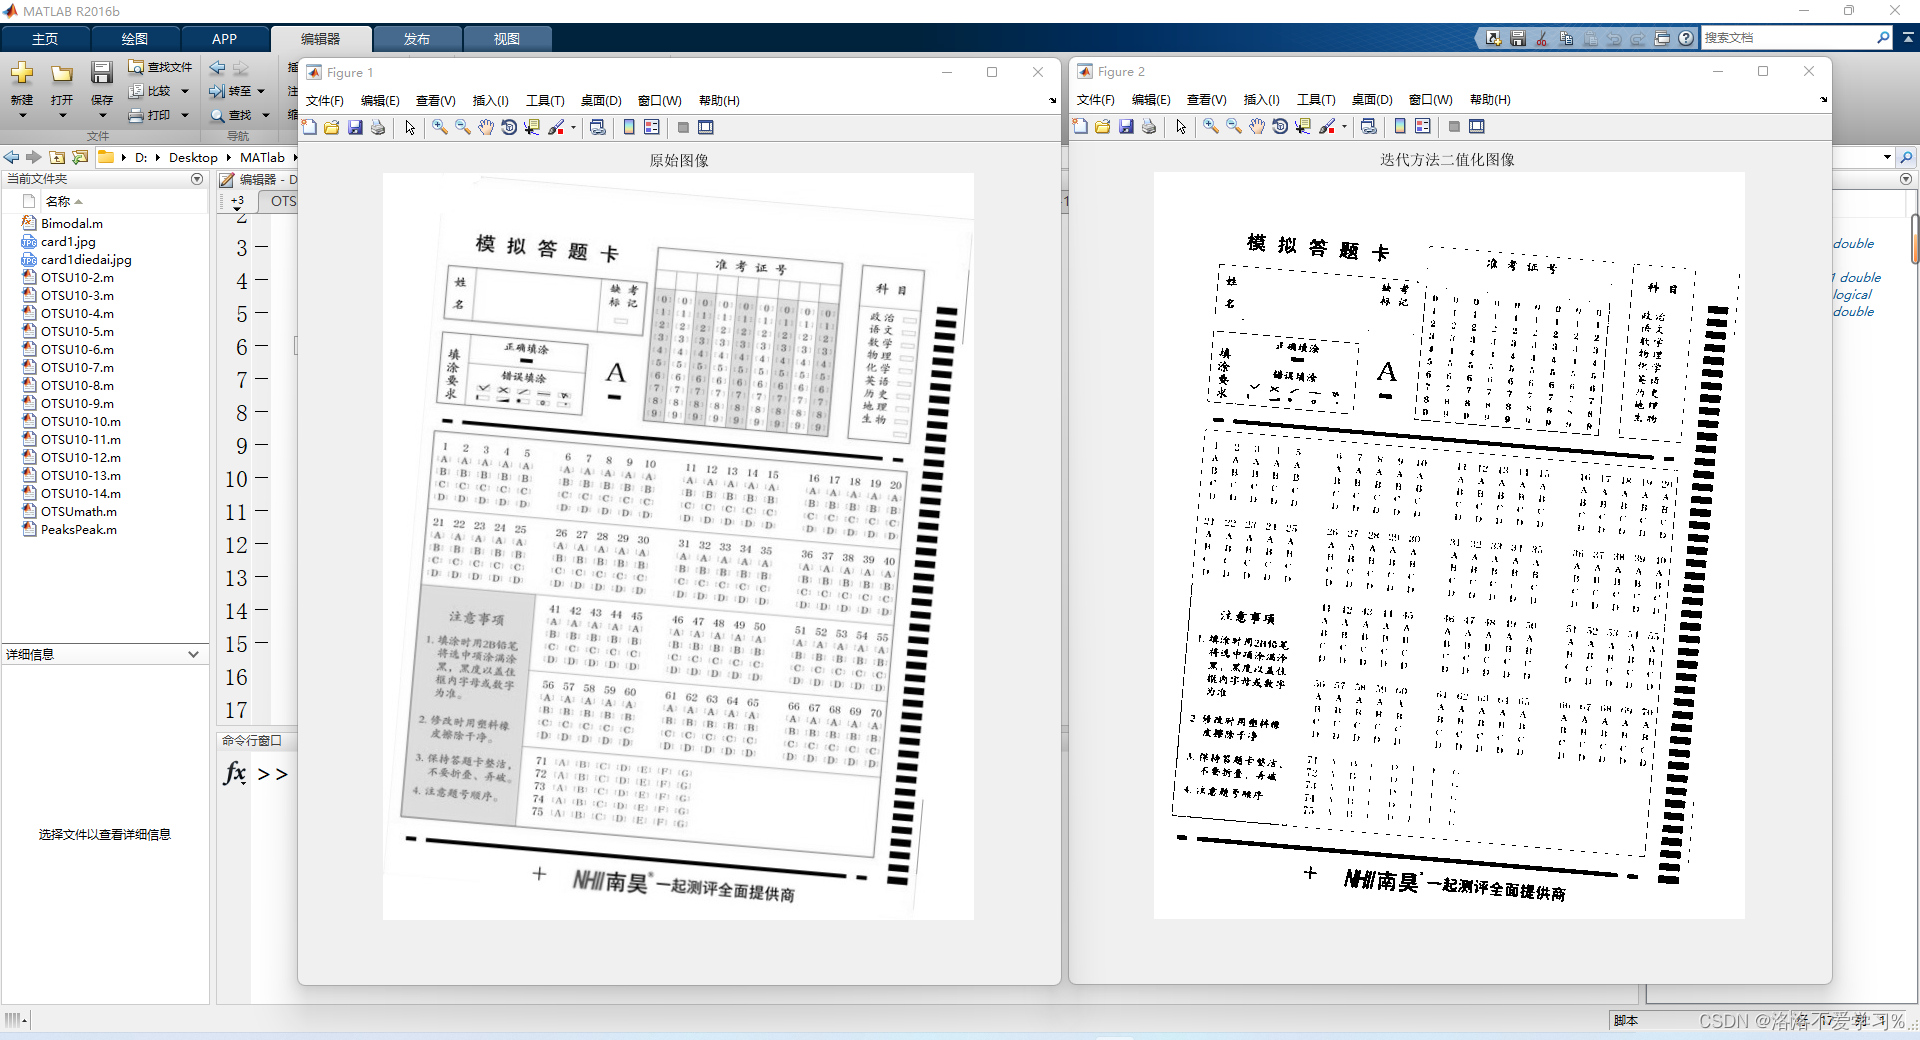
04.10-5源代码
clear,clc,close all;
Image=im2double(rgb2gray(imread('card1.jpg')));
figure,imshow(Image),title('原始图像');
T=(max(Image(:))+min(Image(:)))/2;
equal=false;
while ~equal
    rb=find(Image>=T);
    ro=find(Image<T);
    NewT=(mean(Image(rb))+mean(Image(ro)))/2;
    equal=abs(NewT-T)<1/256;
    T=NewT;
end
result=im2bw(Image,T);
figure,imshow(result),title('迭代方法二值化图像 ');
imwrite(result,'card1diedai.jpg');
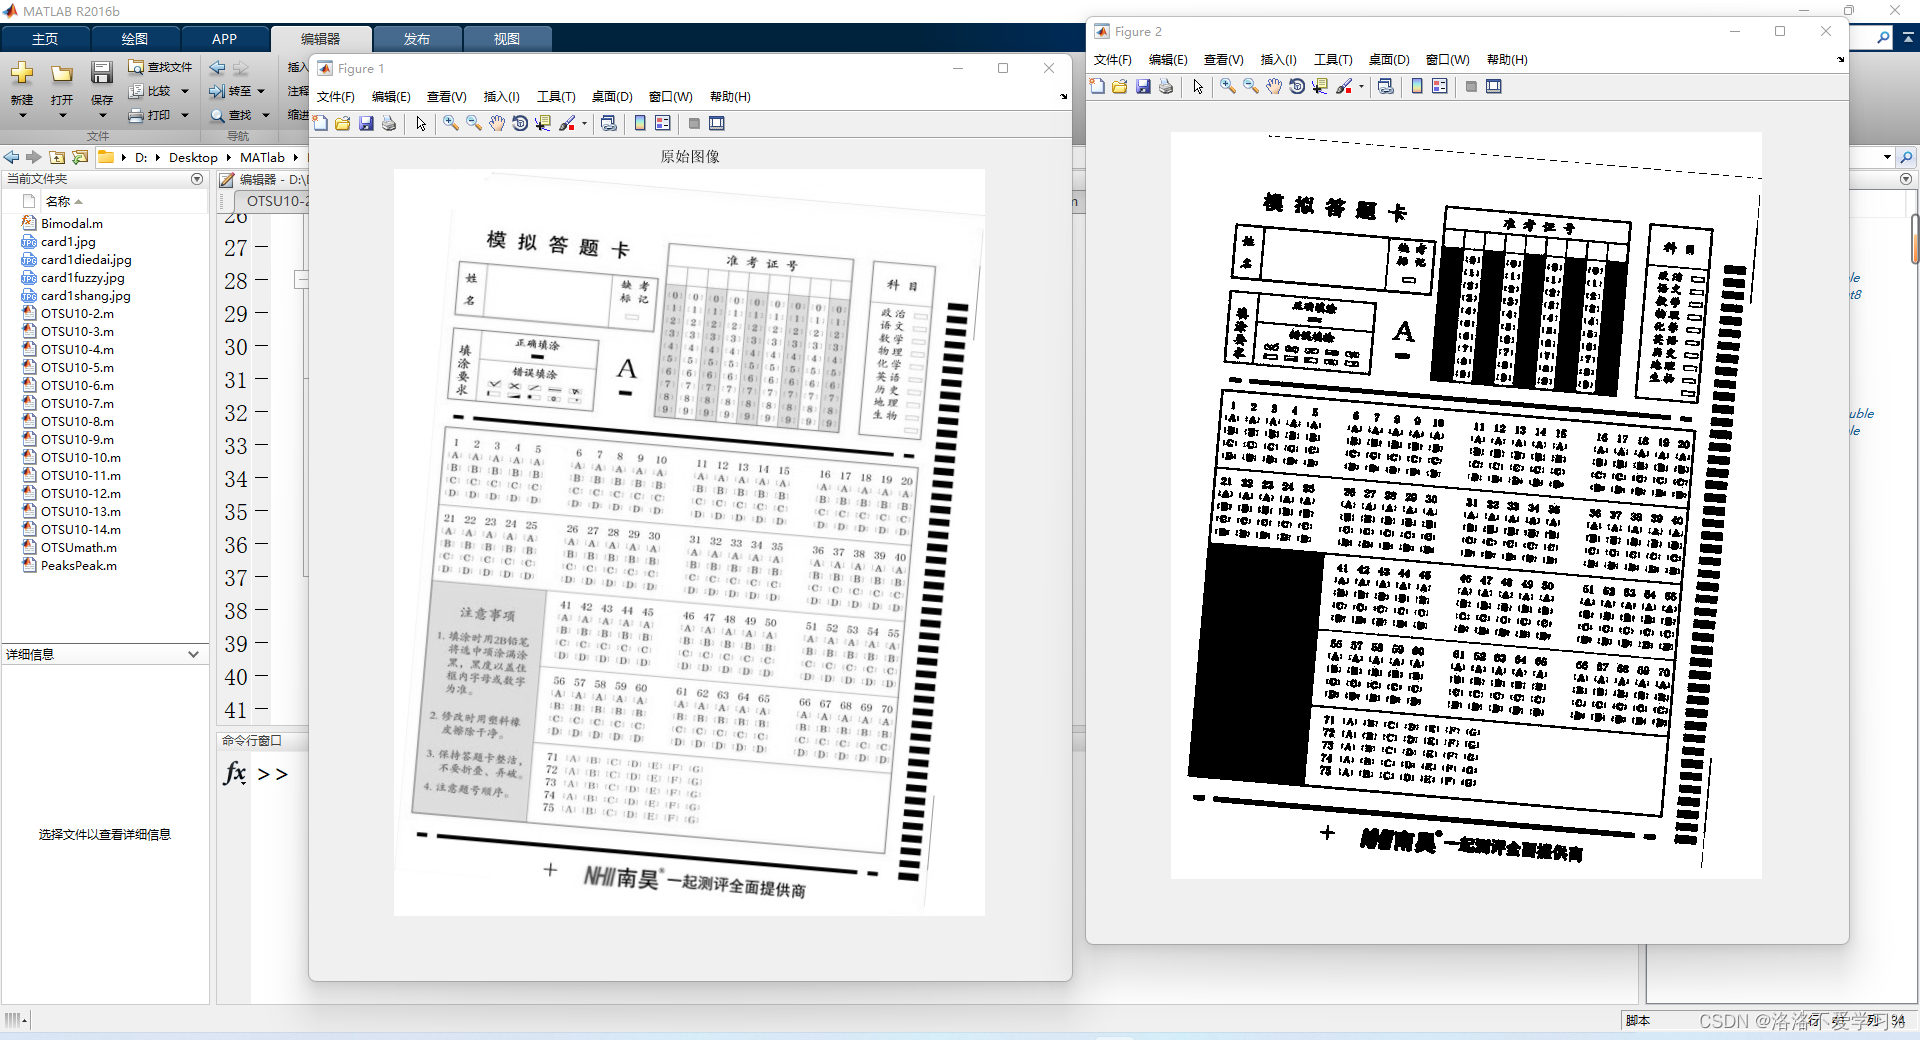
05.10-6源代码
clear,clc,close all;
Image=rgb2gray(imread('card1.jpg'));
figure,imshow(Image),title('原始图像');
hist=imhist(Image);
bottom=min(Image(:))+1;
top=max(Image(:))+1;
C=double(top-bottom);
S=zeros(256,1);
J=10^10;
for t=bottom+1:top-1
    miuo=0;
    for j=bottom:t
        miuo=miuo+hist(j)*double(j);
    end
    pixelnum=sum(hist(bottom:t));
    miuo=miuo/pixelnum;
    for j=bottom:t
        miuf=1/(1+abs(double(j)-miuo)/C);
        S(j)=-miuf*log(miuf)-(1-miuf)*log(1-miuf);
    end

    miub=0;
    for j=t+1:top
        miub=miub+hist(j)*double(j);
    end
    pixelnum=sum(hist(t+1:top));
    miub=miub/pixelnum;
    for j=t+1:top
        miuf=1/(1+abs(double(j)-miub)/C);
        S(j)=-miuf*log(miuf)-(1-miuf)*log(1-miuf);
    end
    currentJ=sum(hist(bottom:top).*S(bottom:top));
    if currentJ<J
        J=currentJ;
        thresh=t;
    end
end
result=zeros(size(Image));
result(Image>thresh)=1;
figure,imshow(result);
imwrite(result,'card1fuzzy.jpg');
运行截图
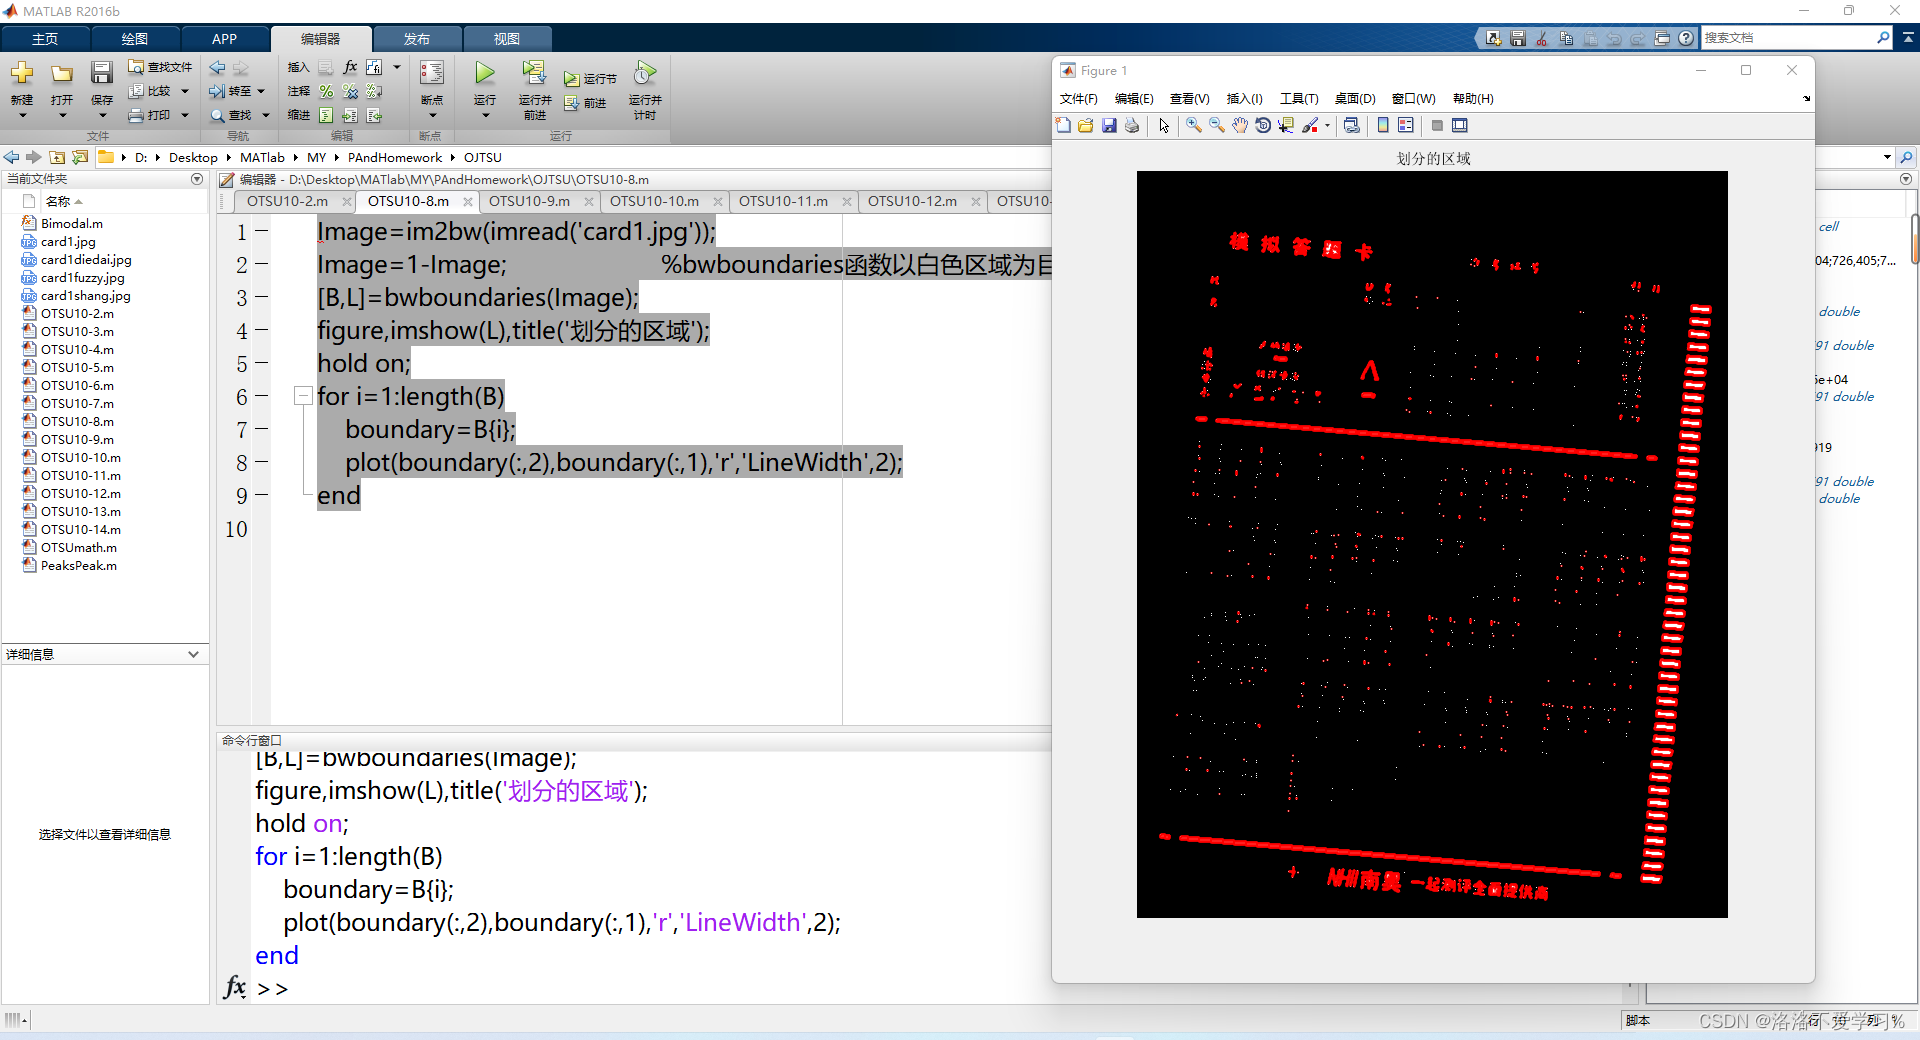
06.10-8源代码
Image=im2bw(imread('card1.jpg'));
Image=1-Image;                      %bwboundaries函数以白色区域为目标,本图中目标暗,因此反色。
[B,L]=bwboundaries(Image);
figure,imshow(L),title('划分的区域');
hold on;
for i=1:length(B)
    boundary=B{i};
    plot(boundary(:,2),boundary(:,1),'r','LineWidth',2);
end
运行截图
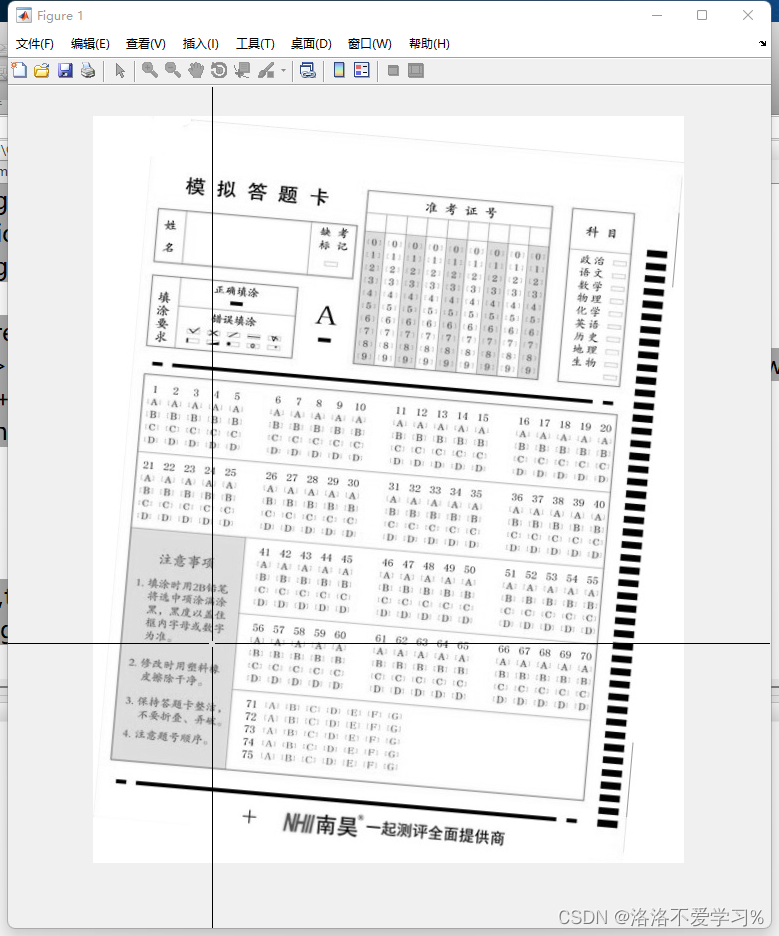
07.10-9源代码
clear,clc,close all;
Image=im2double(imread('card1.jpg'));
[height,width,channel]=size(Image);
if channel==3
    Image=rgb2gray(Image);
end
figure,imshow(Image);
% Image=[1 0 4 6 5 1;1 0 4 6 6 2;0 1 5 5 5 1;0 0 5 6 5 0;0 0 1 6 0 1;1 0 1 2 1 1];
% [height,width,channel]=size(Image);
% figure,imshow(Image);
[seedx,seedy,button] = ginput(1);
seedx=round(seedx);
seedy=round(seedy);
region=zeros(height,width);
region(seedy,seedx)=1;
region_mean=Image(seedy,seedx);
region_num=1;
flag=zeros(height,width);
flag(seedy,seedx)=1;
neighbor=[-1 -1;-1 0;-1 1;0 -1;0 1;1 -1;1 0;1 1];
for k=1:8
    y=seedy+neighbor(k,1);
    x=seedx+neighbor(k,2);
    waiting(k,:)=[y,x];
    flag(y,x)=2;
end

pos=1;
len=length(waiting);
while pos<len
    len=length(waiting);
    current=waiting(pos,:);
    pos=pos+1;
    pixel=Image(current(1),current(2));
    pdist=abs(pixel-region_mean);
    if pdist<40/255
        region(current(1),current(2))=1;
        region_mean=region_mean*region_num+pixel;
        region_num=region_num+1;
        region_mean=region_mean/region_num;
        for k=1:8
            newpoint=current+neighbor(k,:);
            if newpoint(1)>0 && newpoint(1)<=height && newpoint(2)>0 && newpoint(2)<width && flag(newpoint(1),newpoint(2))==0
                waiting(end+1,:)=newpoint;
                flag(newpoint(1),newpoint(2))=2;
            end
        end
    end
end
figure,imshow(region),title('区域生长');
imwrite(region,'regiongrow.jpg');
运行结果
08.10-13源代码
clear,clc,close all;
Image=imread('card1.jpg');
imshow(Image);
hsv=rgb2hsv(Image);
h=hsv(:,:,1);
h(h>330/360)=0;
[N,M]=size(h);
training=h(:);
startdata = [0;60/360;120/360;180/360;240/360;300/360];
[IDX,C]= kmeans(training,6,'Start',startdata);
idbw = (IDX == 1);
template = reshape(idbw, size(h));
figure,imshow(template),title('分割后的图像');
imwrite(template,'clusterseg.jpg');
运行截图
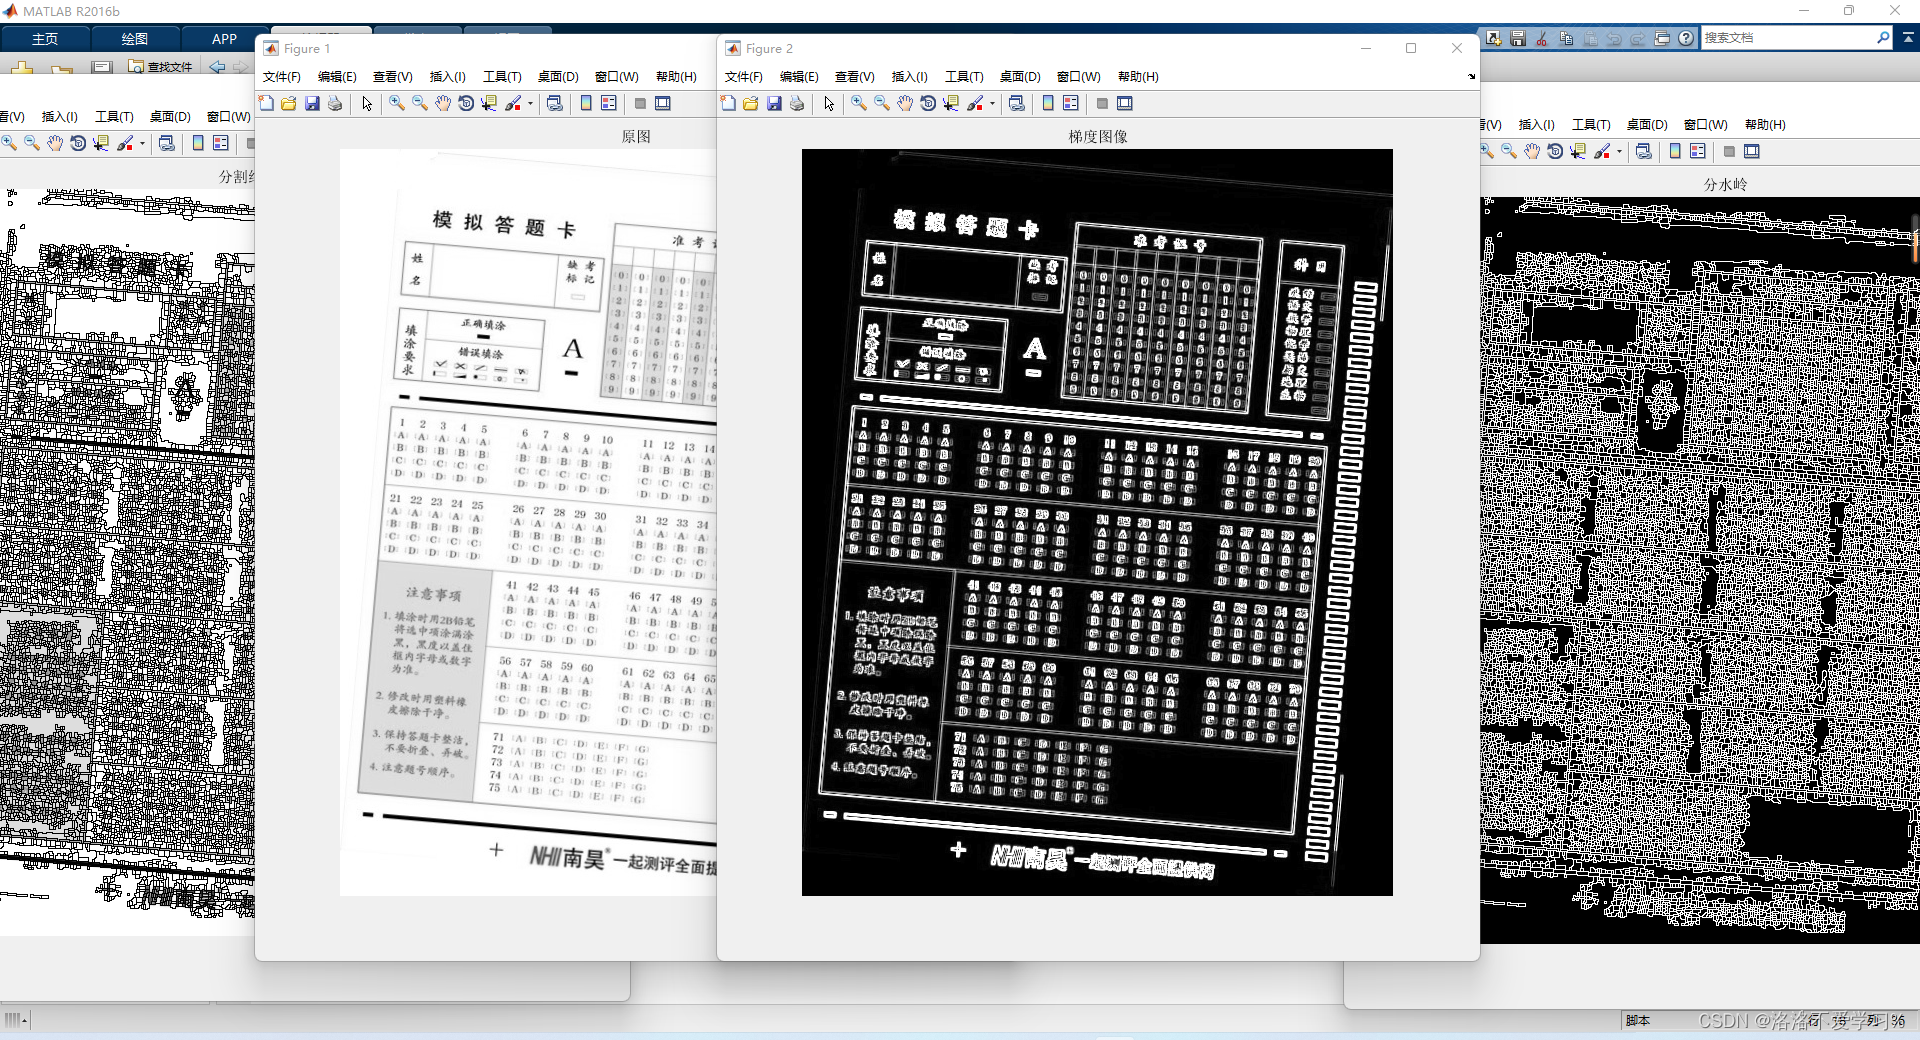
09.10-14源代码
clear,clc,close all;
image=im2double(rgb2gray(imread('card1.jpg')));
figure,imshow(image),title('原图');
hv=fspecial('prewitt');
hh=hv.';
gv=abs(imfilter(image,hv,'replicate'));
gh=abs(imfilter(image,hh,'replicate'));
% g=sqrt(gv.^2+gh.^2);
g=abs(gv)+abs(gh);
figure,imshow(g),title('梯度图像');
L=watershed(g);
wr=L==0;
figure,imshow(wr),title('分水岭');
image(wr)=0;
figure,imshow(image),title('分割结果');
% imwrite(g,'watergrad.jpg');
% imwrite(wr,'fenshuiling.jpg');
% imwrite(image,'waterresult.jpg');
运行截图


 1701
1701


 被折叠的 条评论
为什么被折叠?
被折叠的 条评论
为什么被折叠?
 到【灌水乐园】发言


