


1、开启状态界面
实例:
开启status:
location /status {
  stub_status {on | off};
  allow 172.16.0.0/16;
  deny all;
}
访问状态页面的方式:http://server_ip/status
状态页面信息详解:
| 状态码 | 表示的意义 |
|---|---|
| Active connections 2 | 当前所有处于打开状态的连接数 |
| accepts | 总共处理了多少个连接 |
| handled | 成功创建多少握手 |
| requests | 总共处理了多少个请求 |
| Reading | nginx读取到客户端的Header信息数,表示正处于接收请求状态的连接数 |
| Writing | nginx返回给客户端的Header信息数,表示请求已经接收完成, 且正处于处理请求或发送响应的过程中的连接数 |
| Waiting | 开启keep-alive的情况下,这个值等于active - (reading + writing), 意思就是Nginx已处理完正在等候下一次请求指令的驻留连接 |
监控nginx状态界面
| 主机作用 | ip |
|---|---|
| zabbix服务端 | 192.168.2.129 |
| nginx+zabbix客户端 | 192.168.2.128 |
[root@localhost conf]# vim nginx.conf
location /nginx_status {
            stub_status on;
        }
[root@localhost conf]# systemctl restart nginx.service
192.168.2.128/nginx_status访问

[root@localhost ~]# vim /usr/local/etc/zabbix_agentd.conf  //添加下面三行
Server=192.168.2.129     //服务端ip
ServerActive=192.168.2.129  //服务端ip
Hostname=test   //必须唯一
编写脚本
[root@localhost ~]# mkdir /scripts
[root@localhost ~]# cd /scripts/
[root@localhost scripts]# vim check_nginx.sh
[root@localhost scripts]# cat check_nginx.sh
#Script to fetch nginx statuses for monitoring systems

HOST="127.0.0.1"
PORT="80"

function ping {
    /sbin/pidof nginx | wc -l
}

function active {
    /usr/bin/curl "http://$HOST:$PORT/nginx_status/" 2>/dev/null| grep 'Active' | awk '{print $NF}'
}
function reading {
    /usr/bin/curl "http://$HOST:$PORT/nginx_status/" 2>/dev/null| grep 'Reading' | awk '{print $2}'
}
function writing {
    /usr/bin/curl "http://$HOST:$PORT/nginx_status/" 2>/dev/null| grep 'Writing' | awk '{print $4}'
}
function waiting {
    /usr/bin/curl "http://$HOST:$PORT/nginx_status/" 2>/dev/null| grep 'Waiting' | awk '{print $6}'
}
function accepts {
    /usr/bin/curl "http://$HOST:$PORT/nginx_status/" 2>/dev/null| awk NR==3 | awk '{print $1}'
}
function handled {
    /usr/bin/curl "http://$HOST:$PORT/nginx_status/" 2>/dev/null| awk NR==3 | awk '{print $2}'
}
function requests {
    /usr/bin/curl "http://$HOST:$PORT/nginx_status/" 2>/dev/null| awk NR==3 | awk '{print $3}'
}
$1

[root@localhost scripts]# chmod +x /scripts/check_nginx.sh
开启自定义监控
[root@localhost ~]# vim /usr/local/etc/zabbix_agentd.conf
UnsafeUserParameters=1   //取消注释 修改为1
UserParameter=check_nginx[*],/bin/bash /scripts/check_nginx.sh $1   //最后添加
[root@localhost ~]# pkill zabbix
[root@localhost ~]# zabbix_agentd
服务端测试
[root@zabbix ~]# zabbix_get -s 192.168.2.128 -k check_nginx[active]   //修改中括号内想要查看的状态名称即可
3
[root@zabbix ~]# zabbix_get -s 192.168.2.128 -k check_nginx[accepts]
19
[root@zabbix ~]# zabbix_get -s 192.168.2.128 -k check_nginx[handled]
20
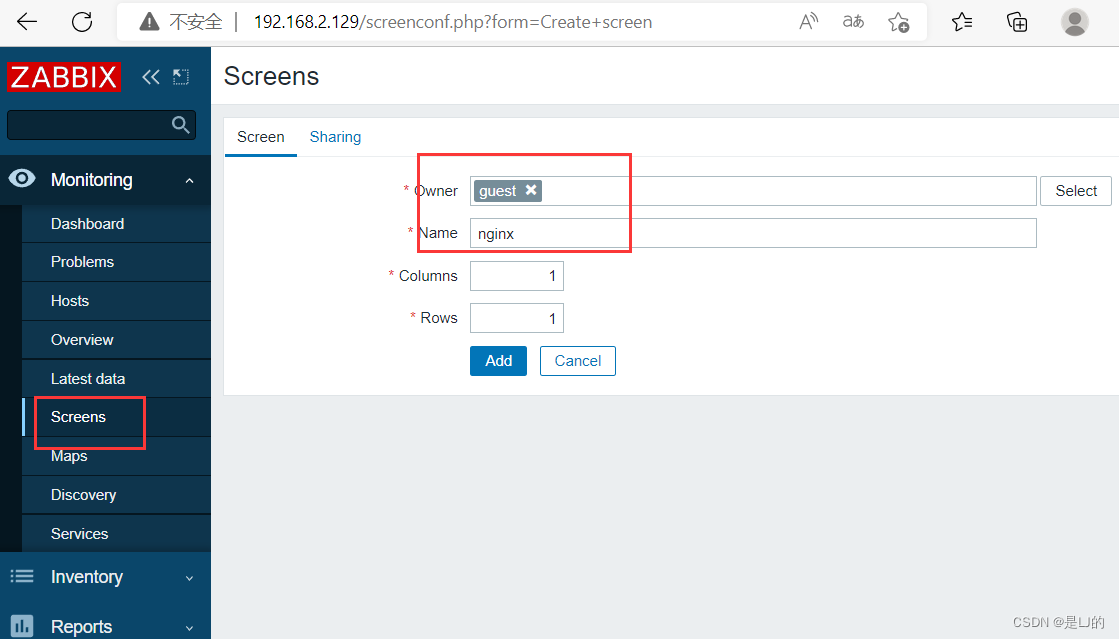
web界面配置
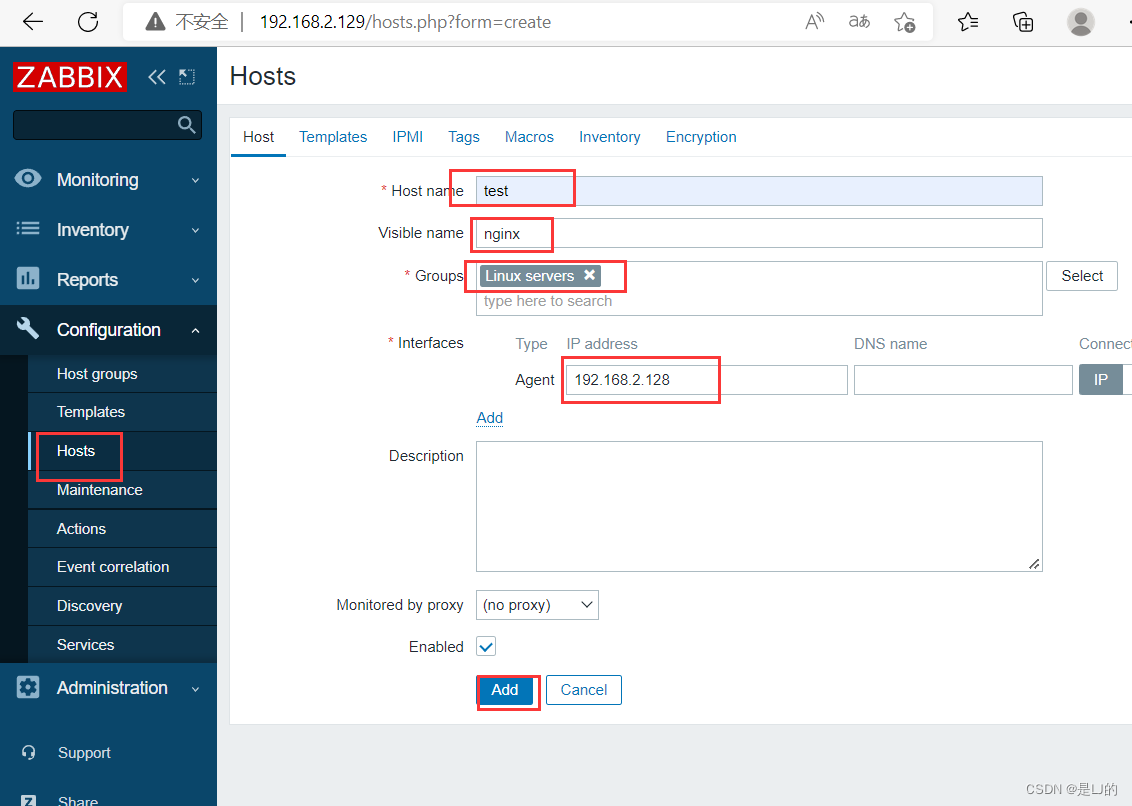
创建监控主机
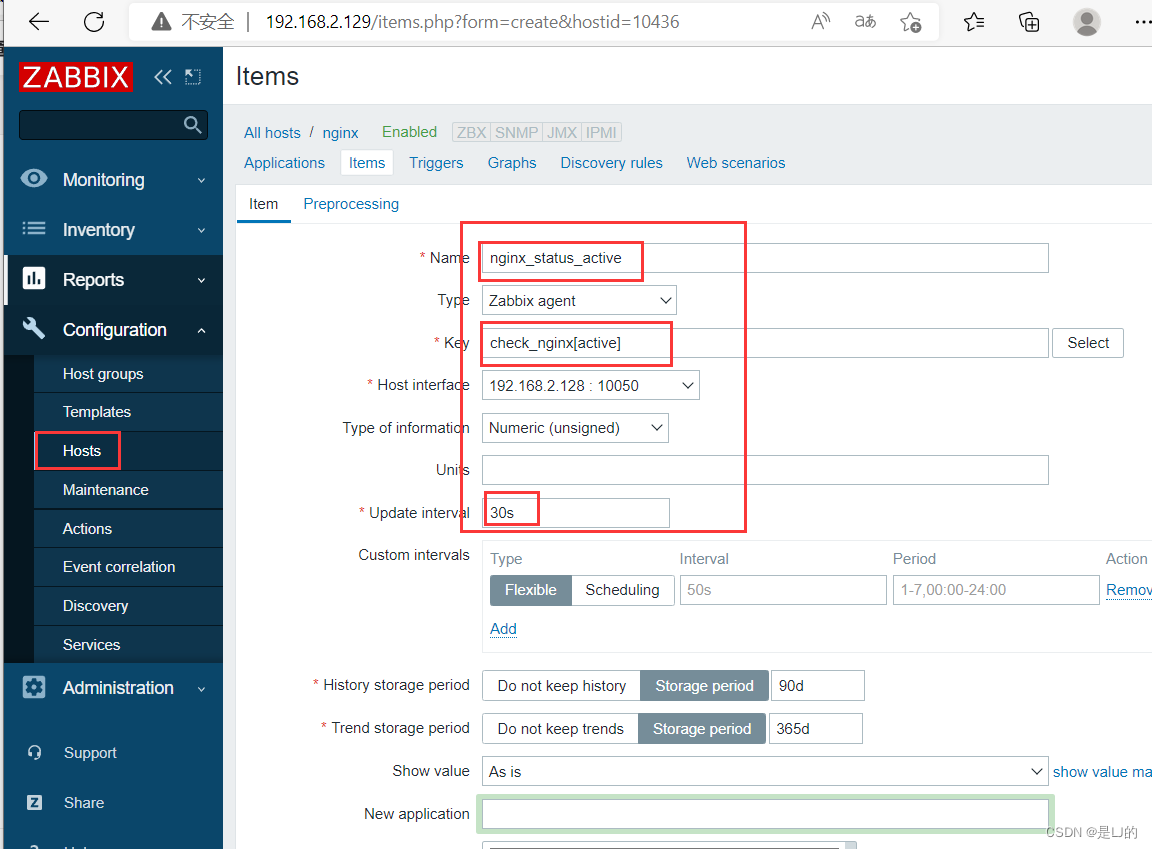
配置监控项
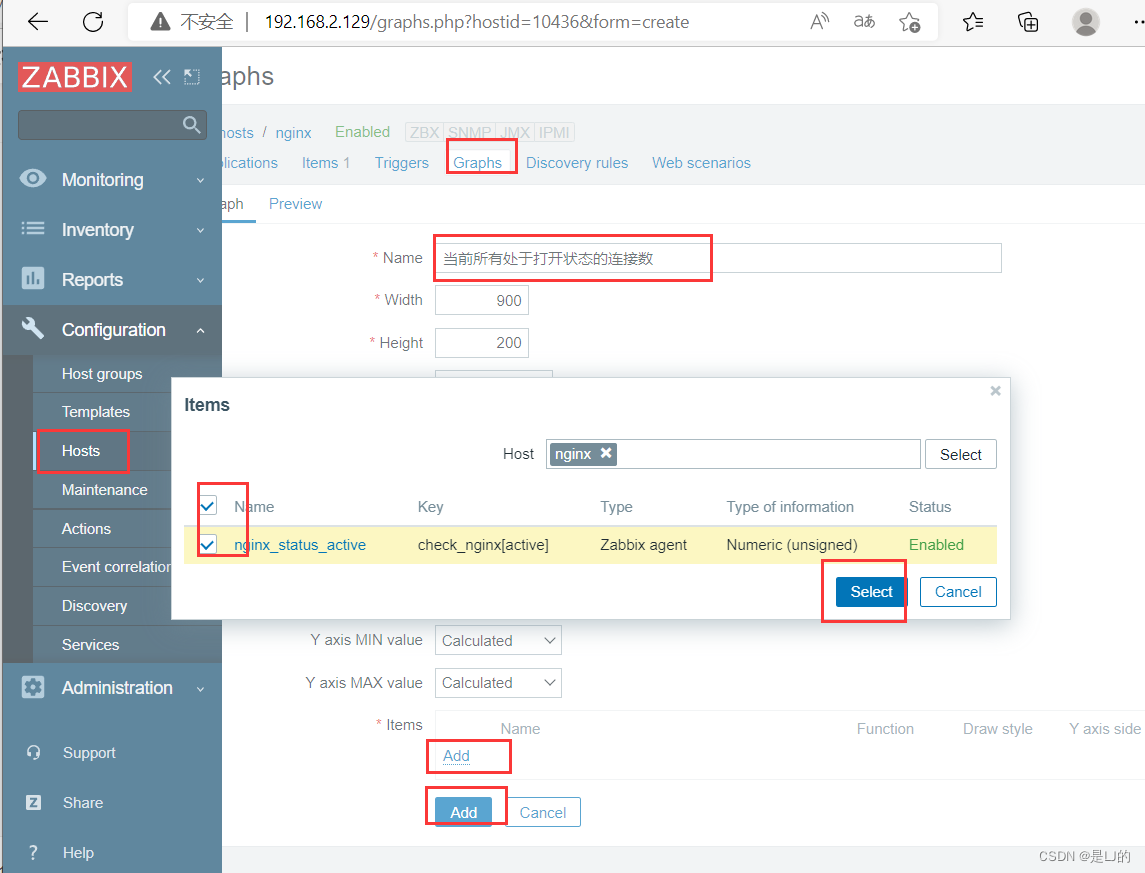
创建组(需要监控其他状态添加进去即可)
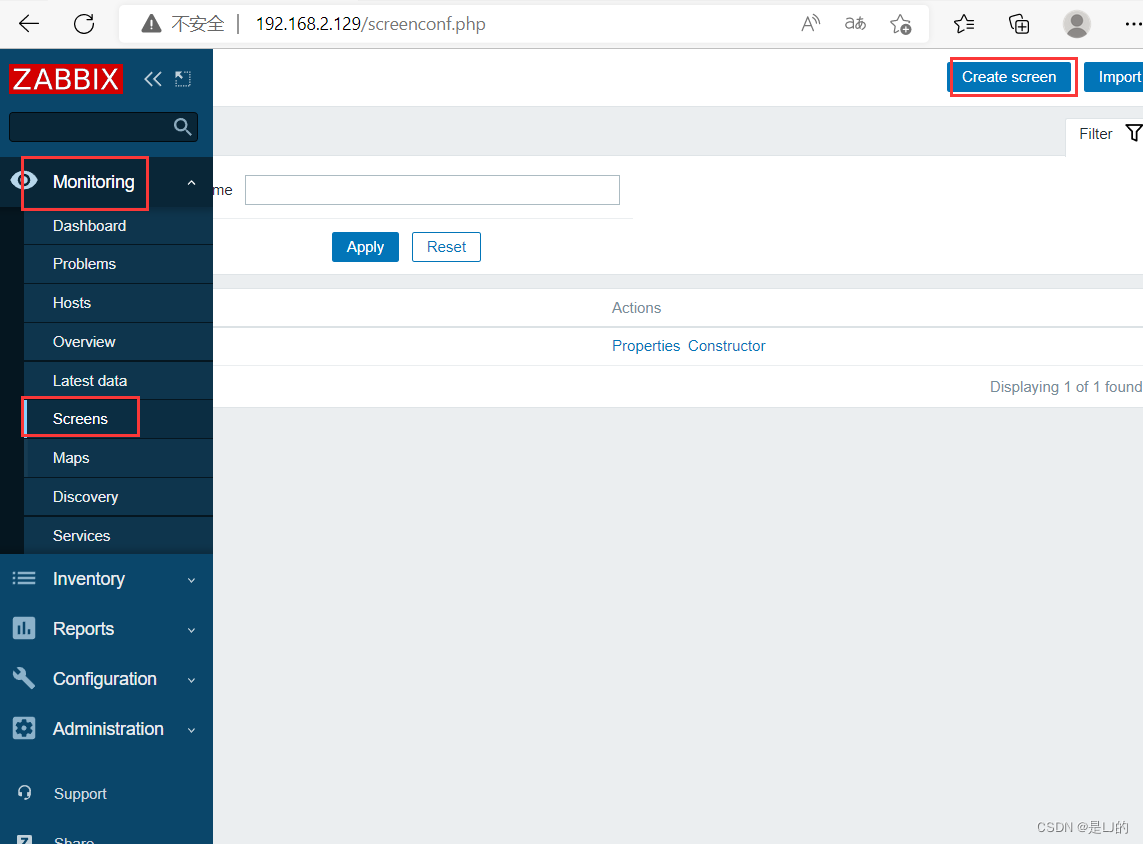
监控组
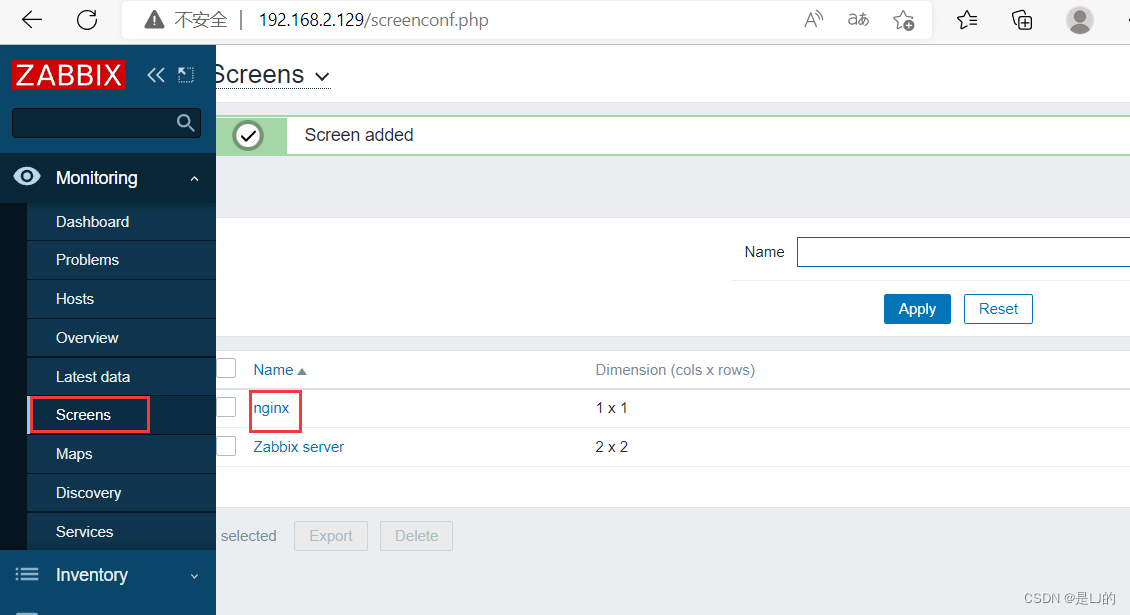
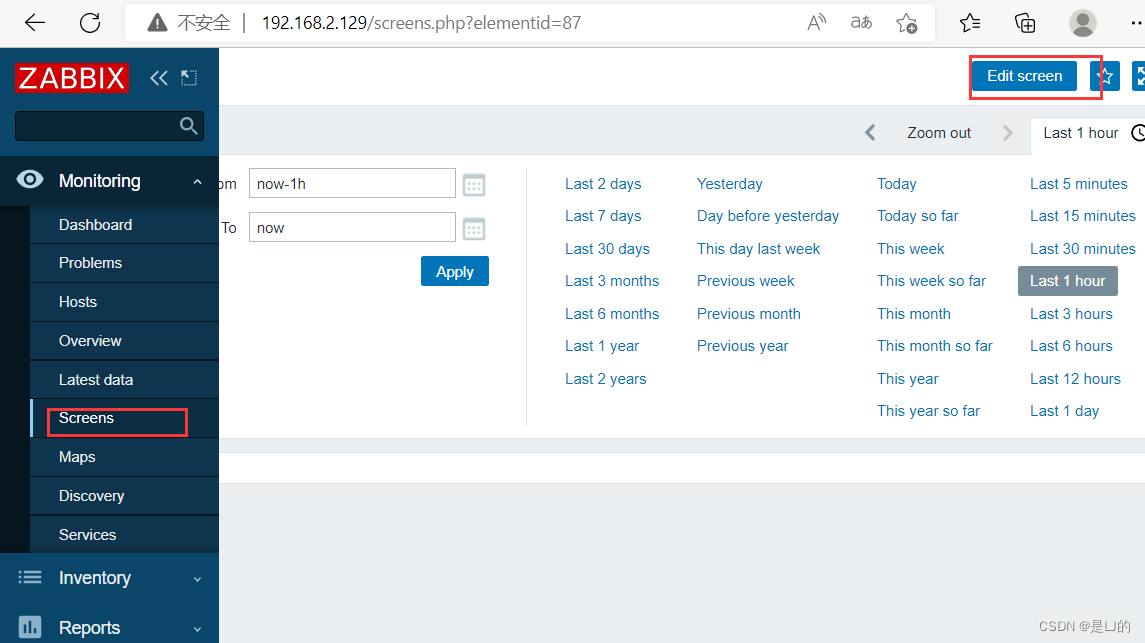
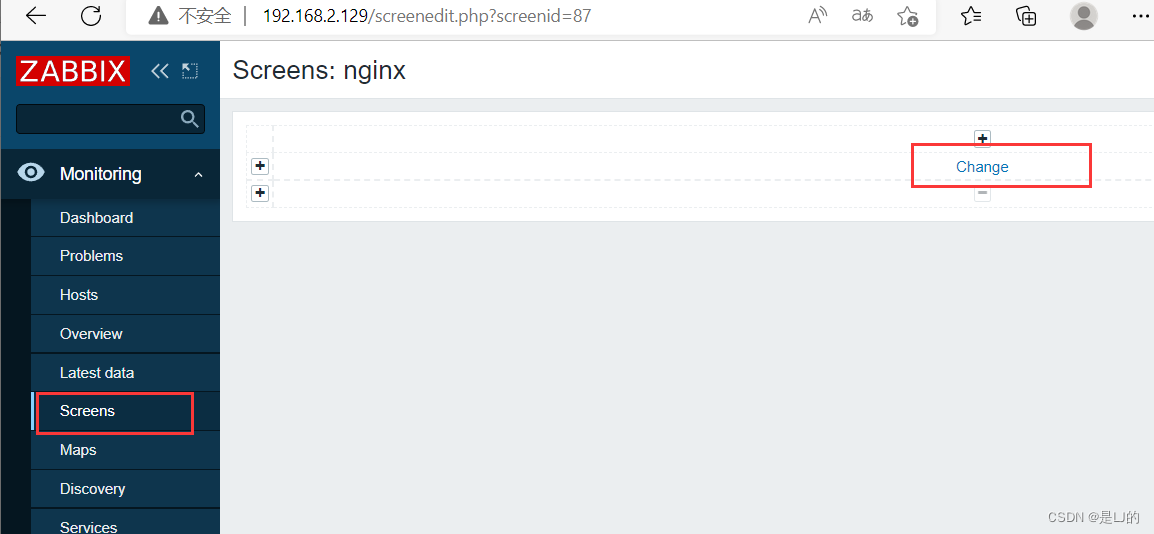
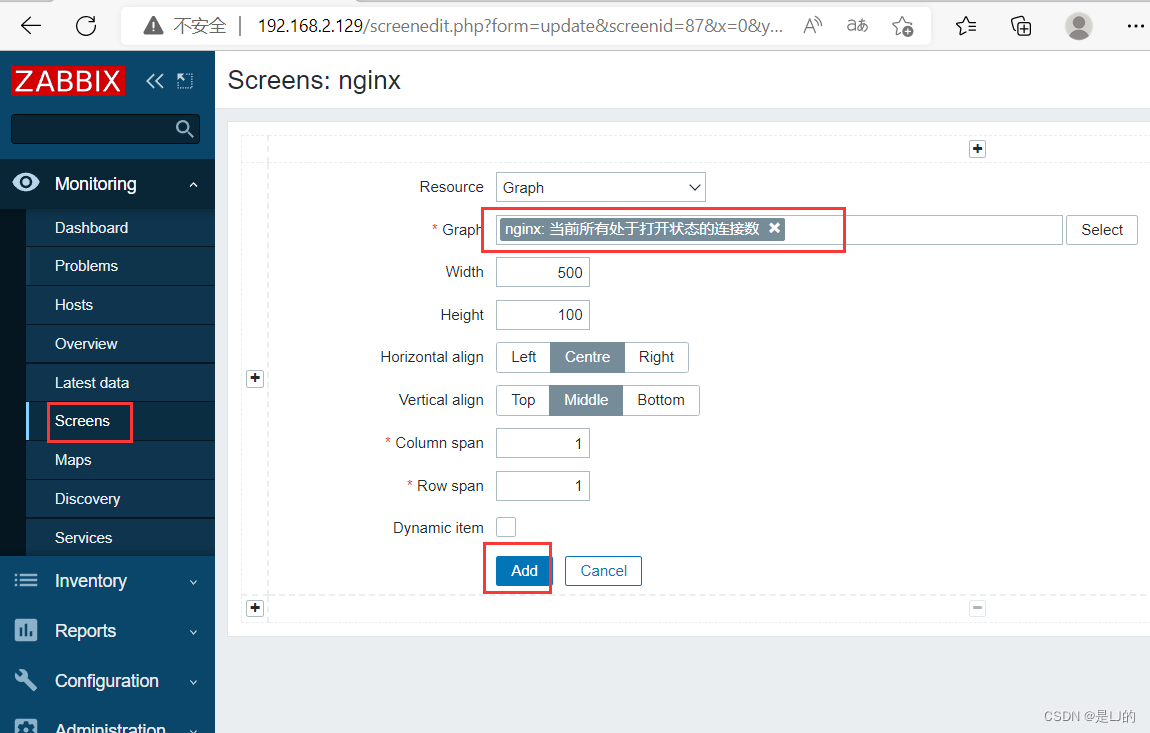
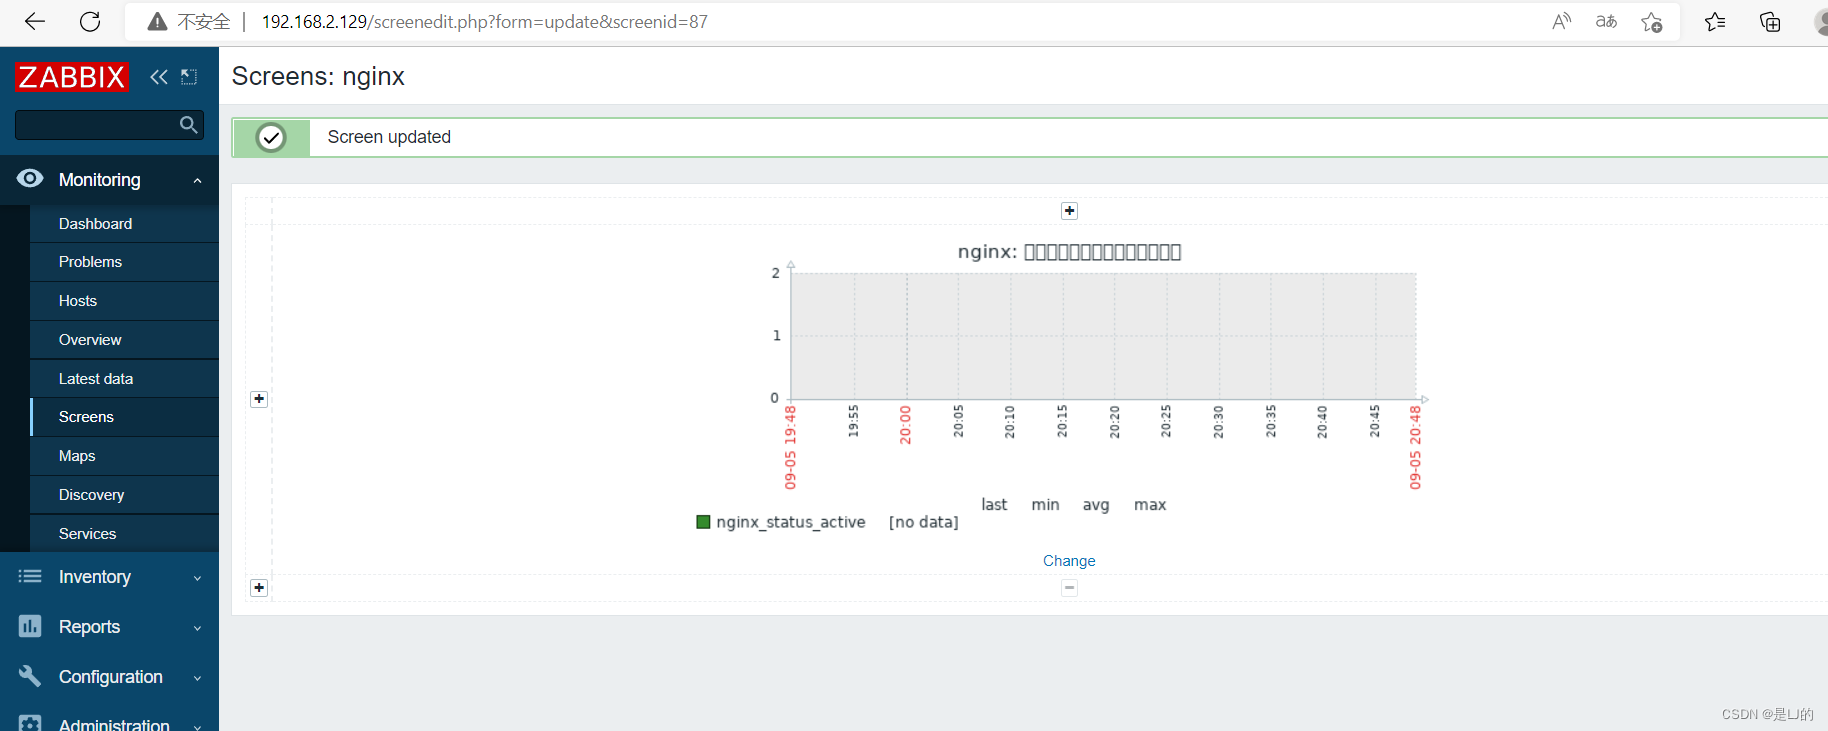
添加完成后就能看总共处理了多少个连接的状态


 585
585


 被折叠的 条评论
为什么被折叠?
被折叠的 条评论
为什么被折叠?
 到【灌水乐园】发言


