


A logarithmic scale (or log scale) is a way of displaying numerical data over a very wide range of values in a compact way—typically the largest numbers in the data are hundreds or even thousands of times larger than the smallest numbers. Such a scale is nonlinear: the numbers 10 and 20, and 60 and 70, are not the same distance apart on a log scale. Rather, the numbers 10 and 100, and 60 and 600 are equally spaced. Thus moving a unit of distance along the scale means the number has been multiplied by 10 (or some other fixed factor). Often exponential growth curves are displayed on a log scale, otherwise they would increase too quickly to fit within a small graph. Another way to think about it is that the number of digits of the data grows at a constant rate. For example, the numbers 10, 100, 1000, and 10000 are equally spaced on a log scale, because their numbers of digits is going up by 1 each time: 2, 3, 4, and 5 digits. In this way, adding two digits multiplies the quantity measured on the log scale by a factor of 100.

A logarithmic scale from 0.1 to 100
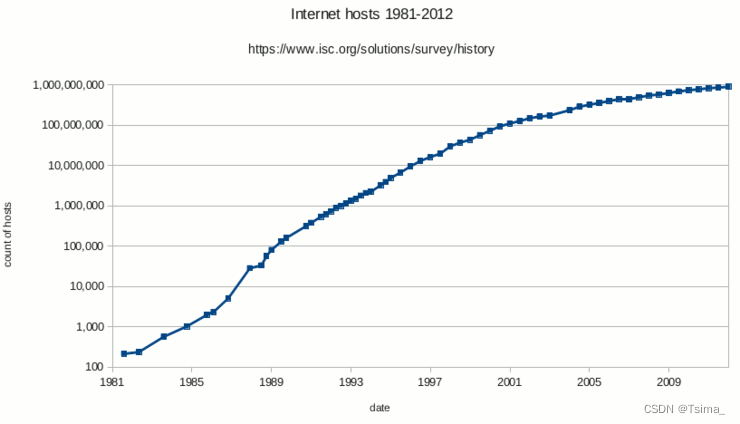
Semi-log plot of the Internet host count over time shown on a logarithmic scale
Contents
1 Common uses
2 Graphic representation
2.1 Log–log plots
2.2 Semi-logarithmic plots
2.3 Extensions
3 Logarithmic units
3.1 Examples
3.2 Units of information
3.3 Units of level or level difference
3.4 Units of frequency interval
3.5 Table of examples
4 See also
4.1 Scale
4.2 Applications


 3334
3334

 被折叠的 条评论
为什么被折叠?
被折叠的 条评论
为什么被折叠?
 到【灌水乐园】发言


