


解决方法一
一个应用占用CPU很高,除了确实是计算密集型应用之外,通常原因都是出现了死循环。
(友情提示:本博文章欢迎转载,但请注明出处:hankchen,http://www.blogjava.net/hankchen)
以我们最近出现的一个实际故障为例,介绍怎么定位和解决这类问题。

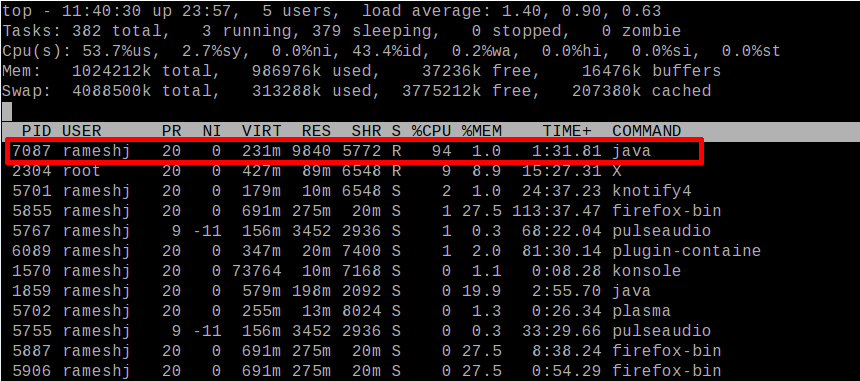
根据top命令,发现PID为28555的Java进程占用CPU高达200%,出现故障。
通过ps aux | grep PID命令,可以进一步确定是tomcat进程出现了问题。但是,怎么定位到具体线程或者代码呢?
首先显示线程列表:
ps -mp pid -o THREAD,tid,time

找到了耗时最高的线程28802,占用CPU时间快两个小时了!
其次将需要的线程ID转换为16进制格式:
printf "%x\n" tid

最后打印线程的堆栈信息:
jstack pid |grep tid -A 30
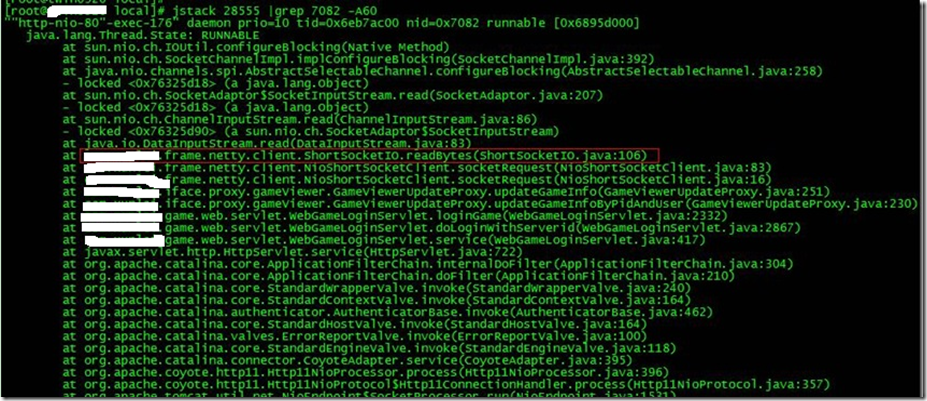
找到出现问题的代码了!
现在来分析下具体的代码:ShortSocketIO.readBytes(ShortSocketIO.java:106)
ShortSocketIO是应用封装的一个用短连接Socket通信的工具类。readBytes函数的代码如下:
public byte[] readBytes(int length) throws IOException {

    if ((this.socket == null) || (!this.socket.isConnected())) {

        throw new IOException("++++ attempting to read from closed socket");

    }

    byte[] result = null;

    ByteArrayOutputStream bos = new ByteArrayOutputStream();

    if (this.recIndex >= length) {

           bos.write(this.recBuf, 0, length);

           byte[] newBuf = new byte[this.recBufSize];

           if (this.recIndex > length) {

               System.arraycopy(this.recBuf, length, newBuf, 0, this.recIndex - length);

           }

           this.recBuf = newBuf;

           this.recIndex -= length;

    } else {

           int totalread = length;

           if (this.recIndex > 0) {

                totalread -= this.recIndex;

                bos.write(this.recBuf, 0, this.recIndex);

                this.recBuf = new byte[this.recBufSize];

                this.recIndex = 0;

    }

    int readCount = 0;

    while (totalread > 0) {

         if ((readCount = this.in.read(this.recBuf)) > 0) {

                if (totalread > readCount) {

                      bos.write(this.recBuf, 0, readCount);

                      this.recBuf = new byte[this.recBufSize];

                      this.recIndex = 0;

               } else {

                     bos.write(this.recBuf, 0, totalread);

                     byte[] newBuf = new byte[this.recBufSize];

                     System.arraycopy(this.recBuf, totalread, newBuf, 0, readCount - totalread);

                     this.recBuf = newBuf;

                     this.recIndex = (readCount - totalread);

             }

             totalread -= readCount;

        }

   }

}
问题就出在标红的代码部分。如果this.in.read()返回的数据小于等于0时,循环就一直进行下去了。而这种情况在网络拥塞的时候是可能发生的。
至于具体怎么修改就看业务逻辑应该怎么对待这种特殊情况了。
最后,总结下排查CPU故障的方法和技巧有哪些:
1、top命令:Linux命令。可以查看实时的CPU使用情况。也可以查看最近一段时间的CPU使用情况。
2、PS命令:Linux命令。强大的进程状态监控命令。可以查看进程以及进程中线程的当前CPU使用情况。属于当前状态的采样数据。
3、jstack:Java提供的命令。可以查看某个进程的当前线程栈运行情况。根据这个命令的输出可以定位某个进程的所有线程的当前运行状态、运行代码,以及是否死锁等等。
4、pstack:Linux命令。可以查看某个进程的当前线程栈运行情况。
转载地址:http://www.blogjava.net/hankchen/archive/2013/03/01/377735.html
解决方法二
package test;
public class ThreadDumpTest {
    public void test() {
        for (int i = 0; i < 10; i++) {
            Thread th = new Thread(new TR(i));
            th.setName("MyThread-" + (1000 + i));
            th.start();
        }
    }
    public static void main(String[] args) {
        ThreadDumpTest t = new ThreadDumpTest();
        t.test();
    }
    private class TR implements Runnable {
        int ins = 0;
        TR(int i) {
            ins = i;
        }
        public void run() {
            while (true) {
                if (ins != 5) {
                    try {
                        Thread.sleep(10000);
                    } catch (Exception e) {
                        e.printStackTrace();
                    }
                }
            }
        }
    }
}
在上面的例子中,所有线程都在执行while循环。除了MyThread-1005 之外,其它线程都会不停地在循环中sleep 10秒钟。MyThread-1005 线程不会进入sleep部分的代码,所以会不停地循环而不做sleep。因为有while循环,所以MyThread-1005 线程会导致很高的CPU利用率。
如何找到占用了大量CPU的线程?
步骤1:
在命令行中执行'top'命令。你会看到一个PID为7074的'java'进程占用了97%的CPU。

步骤2:
'top'命令显示了如上图所示的进程列表。按'shift + h',等几秒钟。你会看到上面光标的位置出现'Show threads on'的消息字样。现在,你可以看到线程级别的CPU/Memory利用率的详细情况。你可以看到一个java线程,PID是7087使用了97%的CPU。
步骤3:
有问题的线程的PID(7087)是十进制的。把它转换成十六进制 。7087相应的十六进制的值是1BAF。然后转换成小写(1baf)。
步骤4:
做一个Thread Dump(kill -3 7074),然后在Thread Dump中查找转换出来的十六进制的线程PID(1baf)。你可以找到一个'0x'开头的'nid '值为1baf(20到22行)。你可以看到正是例子程序中有问题的线程MyThread-1005。从这个线程的stack trace中,你可以找到有问题的代码然后修复它。
[rameshj@rameshj thread]$ java test/ThreadDumpTest
^/Full thread dump Java HotSpot(TM) Client VM (1.5.0_06-b05 mixed mode):
"DestroyJavaVM" prio=1 tid=0x083d2d78 nid=0x1ba2 waiting on condition [0x00000000..0xbff4bf60]
"MyThread-1009" prio=1 tid=0x08510a88 nid=0x1bb3 waiting on condition [0xa9cca000..0xa9ccb020]
        at java.lang.Thread.sleep(Native Method)
        at test.ThreadDumpTest$TR.run(ThreadDumpTest.java:45)
        at java.lang.Thread.run(Thread.java:595)
"MyThread-1008" prio=1 tid=0x08510318 nid=0x1bb2 waiting on condition [0xa9d4b000..0xa9d4bea0]
        at java.lang.Thread.sleep(Native Method)
        at test.ThreadDumpTest$TR.run(ThreadDumpTest.java:45)
        at java.lang.Thread.run(Thread.java:595)
"MyThread-1007" prio=1 tid=0x0850f298 nid=0x1bb1 waiting on condition [0xa9dcc000..0xa9dccf20]
        at java.lang.Thread.sleep(Native Method)
        at test.ThreadDumpTest$TR.run(ThreadDumpTest.java:45)
        at java.lang.Thread.run(Thread.java:595)
"MyThread-1006" prio=1 tid=0x0850d818 nid=0x1bb0 waiting on condition [0xa9e4d000..0xa9e4dda0]
        at java.lang.Thread.sleep(Native Method)
        at test.ThreadDumpTest$TR.run(ThreadDumpTest.java:45)
        at java.lang.Thread.run(Thread.java:595)
"MyThread-1005" prio=1 tid=0x0850c9f8 nid=0x1baf runnable [0xa9ece000..0xa9ecee20]
        at test.ThreadDumpTest$TR.run(ThreadDumpTest.java:43)
        at java.lang.Thread.run(Thread.java:595)
"MyThread-1004" prio=1 tid=0x0850b8e8 nid=0x1bae waiting on condition [0xa9f4f000..0xa9f500a0]
        at java.lang.Thread.sleep(Native Method)
        at test.ThreadDumpTest$TR.run(ThreadDumpTest.java:45)
        at java.lang.Thread.run(Thread.java:595)
"MyThread-1003" prio=1 tid=0x0850aac8 nid=0x1bad waiting on condition [0xa9fd0000..0xa9fd1120]
        at java.lang.Thread.sleep(Native Method)
        at test.ThreadDumpTest$TR.run(ThreadDumpTest.java:45)
        at java.lang.Thread.run(Thread.java:595)
"MyThread-1002" prio=1 tid=0x085099b8 nid=0x1bac waiting on condition [0xaa051000..0xaa051fa0]
        at java.lang.Thread.sleep(Native Method)
        at test.ThreadDumpTest$TR.run(ThreadDumpTest.java:45)
        at java.lang.Thread.run(Thread.java:595)
"MyThread-1001" prio=1 tid=0x08508a28 nid=0x1bab waiting on condition [0xaa0d2000..0xaa0d3020]
        at java.lang.Thread.sleep(Native Method)
        at test.ThreadDumpTest$TR.run(ThreadDumpTest.java:45)
        at java.lang.Thread.run(Thread.java:595)
"MyThread-1000" prio=1 tid=0x08508520 nid=0x1baa waiting on condition [0xaa153000..0xaa153ea0]
        at java.lang.Thread.sleep(Native Method)
        at test.ThreadDumpTest$TR.run(ThreadDumpTest.java:45)
        at java.lang.Thread.run(Thread.java:595)
"Low Memory Detector" daemon prio=1 tid=0x0843cf58 nid=0x1ba8 runnable [0x00000000..0x00000000]
"CompilerThread0" daemon prio=1 tid=0x0843b930 nid=0x1ba7 waiting on condition [0x00000000..0xaa3eb808]
"Signal Dispatcher" daemon prio=1 tid=0x0843a9d0 nid=0x1ba6 waiting on condition [0x00000000..0x00000000]
"Finalizer" daemon prio=1 tid=0x08430740 nid=0x1ba5 in Object.wait() [0xaa52c000..0xaa52d120]
        at java.lang.Object.wait(Native Method)
        - waiting on <0xaa6b0848> (a java.lang.ref.ReferenceQueue$Lock)
        at java.lang.ref.ReferenceQueue.remove(ReferenceQueue.java:116)
        - locked <0xaa6b0848> (a java.lang.ref.ReferenceQueue$Lock)
        at java.lang.ref.ReferenceQueue.remove(ReferenceQueue.java:132)
        at java.lang.ref.Finalizer$FinalizerThread.run(Finalizer.java:159)
"Reference Handler" daemon prio=1 tid=0x0842e898 nid=0x1ba4 in Object.wait() [0xaa5ad000..0xaa5adfa0]
        at java.lang.Object.wait(Native Method)
        - waiting on <0xaa6b0758> (a java.lang.ref.Reference$Lock)
        at java.lang.Object.wait(Object.java:474)
        at java.lang.ref.Reference$ReferenceHandler.run(Reference.java:116)
        - locked <0xaa6b0758> (a java.lang.ref.Reference$Lock)
"VM Thread" prio=1 tid=0x0842bb68 nid=0x1ba3 runnable
"VM Periodic Task Thread" prio=1 tid=0x0843e538 nid=0x1ba9 waiting on condition


 918
918


 被折叠的 条评论
为什么被折叠?
被折叠的 条评论
为什么被折叠?
 到【灌水乐园】发言


