参考书籍:机器学习实用案例解析
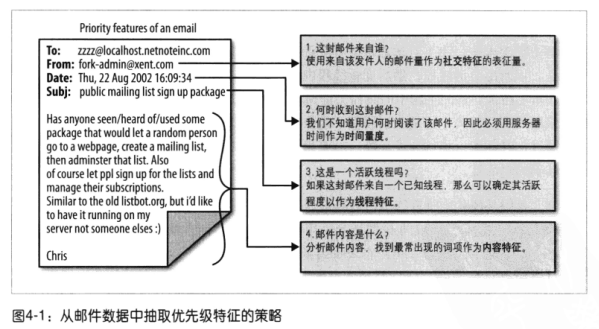
邮件优先级特征
可以参考Google的论文: The learning Behind Gmail Priority Inbox.
主要特征包括:
- 社交特征(social feature): 基于收件人和发件人之间的交互程度,比如某个发件人的邮件被收件人阅读过的百分比.
- 内容特征(content): 用于识别和收件人对邮件采取行为与否高度相关的最近特征词的头部信息.
- 线程特征(thread feature): 记录用户在当前线程下的交互行为.
- 标签特征(label feature): 检查用户通过过滤器给邮件赋予的标签.
2 实现一个智能收件箱
加载程序包以及设置路径
# Load libraries
library('tm')
library('ggplot2')
library('plyr')

# Set the global paths
data.path <- file.path("..", "03-Classification", "data")
easyham.path <- file.path(data.path, "easy_ham")
需要抽取的元素为: 发件人的地址, 接收日期, 主题, 邮件正文
首先提取邮件全文:
# Simply returns the full text of a given email message
msg.full <- function(path)
{
    con <- file(path, open = "rt", encoding = "latin1")
    msg <- readLines(con)
    close(con)
    return(msg)
}
1 社交特征: 发件地址
注意正则表达式!!!
# Retuns the email address of the sender for a given
# email message
msg.vec <- msg.full("./data/easy_ham/00001.7c53336b37003a9286aba55d2945844c")
get.from <- function(msg.vec)
{
    from <- msg.vec[grepl("From: ", msg.vec)] #找到含有From的那一行
    from <- strsplit(from, '[":<> ]')[[1]] #
    from <- from[which(from  != "" & from != " ")]
    return(from[grepl("@", from)][1])
}
2 内容特征: 邮件正文
与第三章类似
# Similar to the function from Chapter 3, this returns
# only the message body for a given email.
get.msg <- function(msg.vec)
{
    msg <- msg.vec[seq(which(msg.vec == "")[1] + 1, length(msg.vec), 1)]
    return(paste(msg, collapse = "\n"))#用换行符分隔开
}
3 线程特征: subj
# Retuns the subject string for a given email message
get.subject <- function(msg.vec)
{
    subj <- msg.vec[grepl("Subject: ", msg.vec)]
    if(length(subj) > 0)#判断是否存在subject
    {
        return(strsplit(subj, "Subject: ")[[1]][2])
    }
    else
    {
        return("")
    }
}
4 时间量度:时间量度(?)
这一节的正则表达式不太懂
# Retuns the date a given email message was received
get.date <- function(msg.vec)
{
    date.grep <- grepl("^Date: ", msg.vec) #Date开头的行
    date.grep <- which(date.grep == TRUE)
    date <- msg.vec[date.grep[1]] #有可能到提取正文中的Date开头的行,取第一个出现的是头部信息中的
    date <- strsplit(date, "\\+|\\-|: ")[[1]][2]# 按照+ - :空格来分开
    date <- gsub("^\\s+|\\s+$", "", date)# 将开头结尾的空格替换为""
    return(strtrim(date, 25))
}
5 调用函数提取信息
# This function ties all of the above helper functions together.
# It returns a vector of data containing the feature set
# used to categorize data as priority or normal HAM
parse.email <- function(path)
{
    full.msg <- msg.full(path)
    date <- get.date(full.msg)
    from <- get.from(full.msg)
    subj <- get.subject(full.msg)
    msg <- get.msg(full.msg)
    return(c(date, from, subj, msg, path))
}

# In this case we are not interested in classifiying SPAM or HAM, so we will take
# it as given that is is being performed.  As such, we will use the EASY HAM email
# to train and test our ranker.
easyham.docs <- dir(easyham.path)
easyham.docs <- easyham.docs[which(easyham.docs != "cmds")]
easyham.parse <- lapply(easyham.docs,
                        function(p) parse.email(file.path(easyham.path, p)))

# Convert raw data from list to data frame
ehparse.matrix <- do.call(rbind, easyham.parse)
allparse.df <- data.frame(ehparse.matrix, stringsAsFactors = FALSE)
names(allparse.df) <- c("Date", "From.EMail", "Subject", "Message", "Path")
6 日期格式转换strptime
原邮件的提取出的日期有两种格式:"Wed, 4 Dec 2002 11:40:18","04 Dec 2002 11:49:23",将这两种格式转换成POSIX日期/时间格式
date.converter <- function(dates, pattern1, pattern2)
{
    #Sys.setlocale("LC_TIME", "C")#先设置locate否则在中文下出错
    #对第一种格式转换
    pattern1.convert <- strptime(dates, pattern1)
    #第二种格式转换并填如1的NA中
    pattern2.convert <- strptime(dates, pattern2)
    pattern1.convert[is.na(pattern1.convert)] <- pattern2.convert[is.na(pattern1.convert)]
    return(pattern1.convert)
}
#两种日期格式如下
pattern1 <- "%a, %d %b %Y %H:%M:%S"
pattern2 <- "%d %b %Y %H:%M:%S"

allparse.df$Date <- date.converter(allparse.df$Date, pattern1, pattern2)
处理后的数据如下:
> head(allparse.df$Date)
[1] "2002-08-22 18:26:25 CST" "2002-08-22 12:46:18 CST"
[3] "2002-08-22 13:52:38 CST" "2002-08-22 09:15:25 CST"
[5] "2002-08-22 14:38:22 CST" "2002-08-22 14:50:31 CST"
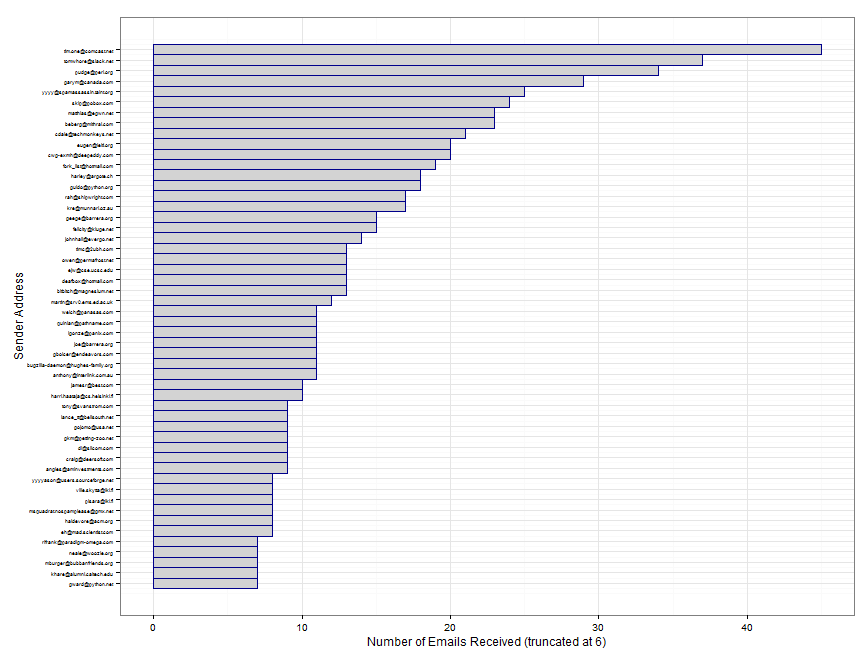
权重数据reshape和画图
library(reshape2)
attach(allparse.df)
#table用来统计subject频率,并且用melt reshape
from.weight <- melt(with(priority.train, table(From.EMail)),
                    value.name="Freq")
#按照频率排序
from.weight <- from.weight[with(from.weight, order(Freq)), ]
# We take a subset of the from.weight data frame to show our most frequent
# correspondents.
from.ex <- subset(from.weight, Freq > 6)
from.scales <- ggplot(from.ex) +
geom_rect(aes(xmin = 1:nrow(from.ex) - 0.5,
xmax = 1:nrow(from.ex) + 0.5,
ymin = 0,
ymax = Freq,
fill = "lightgrey",
color = "darkblue")) +
scale_x_continuous(breaks = 1:nrow(from.ex), labels = from.ex$From.EMail) +
coord_flip() +
scale_fill_manual(values = c("lightgrey" = "lightgrey"), guide = "none") +
scale_color_manual(values = c("darkblue" = "darkblue"), guide = "none") +
ylab("Number of Emails Received (truncated at 6)") +
xlab("Sender Address") +
theme_bw() +
theme(axis.text.y = element_text(size = 5, hjust = 1))
ggsave(plot = from.scales,
filename = file.path("images", "0011_from_scales.pdf"),
height = 4.8,
width = 7)# Log weight scheme, very simple but effective
from.weight <- transform(from.weight,
Weight = log(Freq + 1),
log10Weight = log10(Freq + 1))
from.rescaled <- ggplot(from.weight, aes(x = 1:nrow(from.weight))) +
geom_line(aes(y = Weight, linetype = "ln")) +
geom_line(aes(y = log10Weight, linetype = "log10")) +
geom_line(aes(y = Freq, linetype = "Absolute")) +
scale_linetype_manual(values = c("ln" = 1,
"log10" = 2,
"Absolute" = 3),
name = "Scaling") +
xlab("") +
ylab("Number of emails Receieved") +
theme_bw() +
theme(axis.text.y = element_blank(), axis.text.x = element_blank())
ggsave(plot = from.rescaled,
filename = file.path("images", "0012_from_rescaled.pdf"),
height = 4.8,
width = 7)
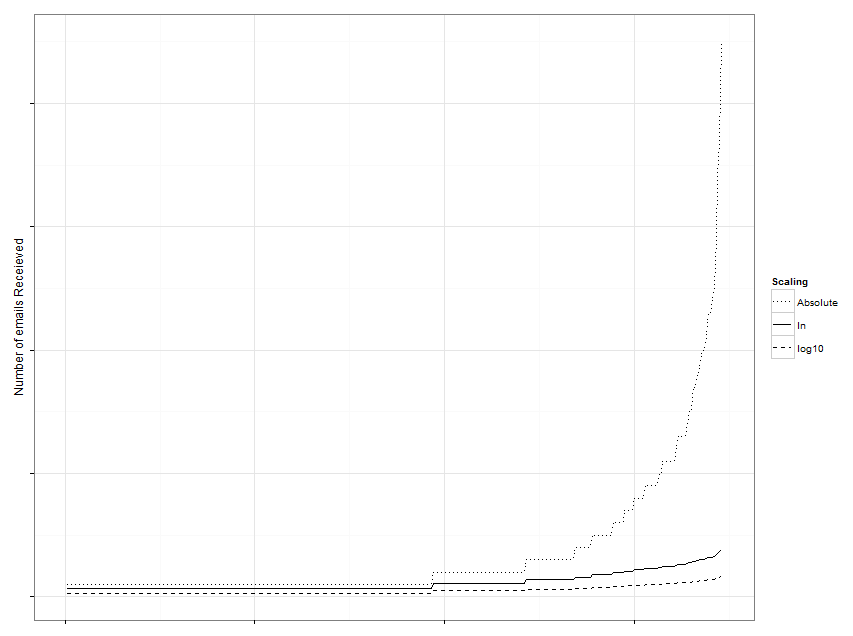
用log,log10的比较图如下, 要注意的是为了避免log1=0 , 我们在对数变换前总是对观测值都加1.其实, 可以用log1p 即 log(1+p)


 1156
1156

 被折叠的 条评论
为什么被折叠?


