import numpy as np
import pandas as pd
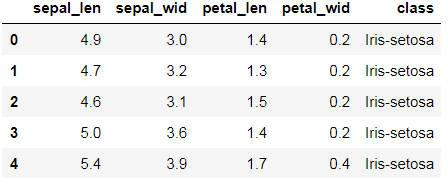
df = pd.read_csv('iris.data')
df.columns = ['sepal_len','sepal_wid','petal_len','petal_wid','class']
df.head()
X = df.iloc[:,0:4].values
y = df.iloc[:,4].values

import matplotlib.pyplot as plt
import math

label_dict = {
   1:'Iris-Setosa', 2:'Iris-Versicolor', 3:'Iris-Virgnica'}
feature_dict = {
   0:'sepal length', 1:'sepal width', 2:'petal length', 3:'petal width'}

plt.figure(figsize = (10, 8))
for cnt in range(4):
    plt.subplot(2, 2, cnt+1)
    for lab in ('Iris-setosa', 'Iris-versicolor', 'Iris-virginica'):
        plt.hist(X[y==lab, cnt], label=lab, bins=10, alpha=0.3, edgecolor='black')
    plt.xlabel(feature_dict[cnt])
    plt.legend(loc = 'upper right', fancybox = True, fontsize = 9)
plt.tight_layout();
plt.show()


 import numpy as npimport pandas as pddf = pd.read_csv('iris.data')df.columns = ['sepal_len','sepal_wid','petal_len','petal_wid','class']df.head()X = df.iloc[:,0:4].valuesy = df.iloc[:,4].value...
 最低0.47元/天 解锁文章


 827
827


 被折叠的 条评论
为什么被折叠?
被折叠的 条评论
为什么被折叠?
 到【灌水乐园】发言


