


Section I: Brief Introduction on Random Forest
Random forests have gained huge popularity om applications of machine learning during the last decade due to their good classification performance,scalability, and ease of use. Intuitively, a random forest can be considered as an ensemble of decoson trees. The idea behind a random forest is to average multiple trees that individually suffer from high variance, to build a more robust model that has a better generalization performance and is less susceptible to overfitting. The major steps are summarized here:
- Step 1: Draw a random boostrap sample for each decision tree with replacement
- Step 2: Randomly select d features without replacement.
From
Sebastian Raschka, Vahid Mirjalili. Python机器学习第二版. 南京:东南大学出版社,2018.
Section II: Random Forest
import matplotlib.pyplot as plt
from sklearn import datasets
import numpy as np
from sklearn.model_selection import train_test_split
from sklearn.ensemble import RandomForestClassifier
from DecisionTrees.visualize_test_idx import plot_decision_regions
plt.rcParams['figure.dpi']=200
plt.rcParams['savefig.dpi']=200
font = {'family': 'Times New Roman',
'weight': 'light'}
plt.rc("font", **font)
#Section 1: Load data and split it into train/test dataset
iris=datasets.load_iris()
X=iris.data[:,[2,3]]
y=iris.target
X_train,X_test,y_train,y_test=train_test_split(X,y,test_size=0.3,random_state=1,stratify=y)
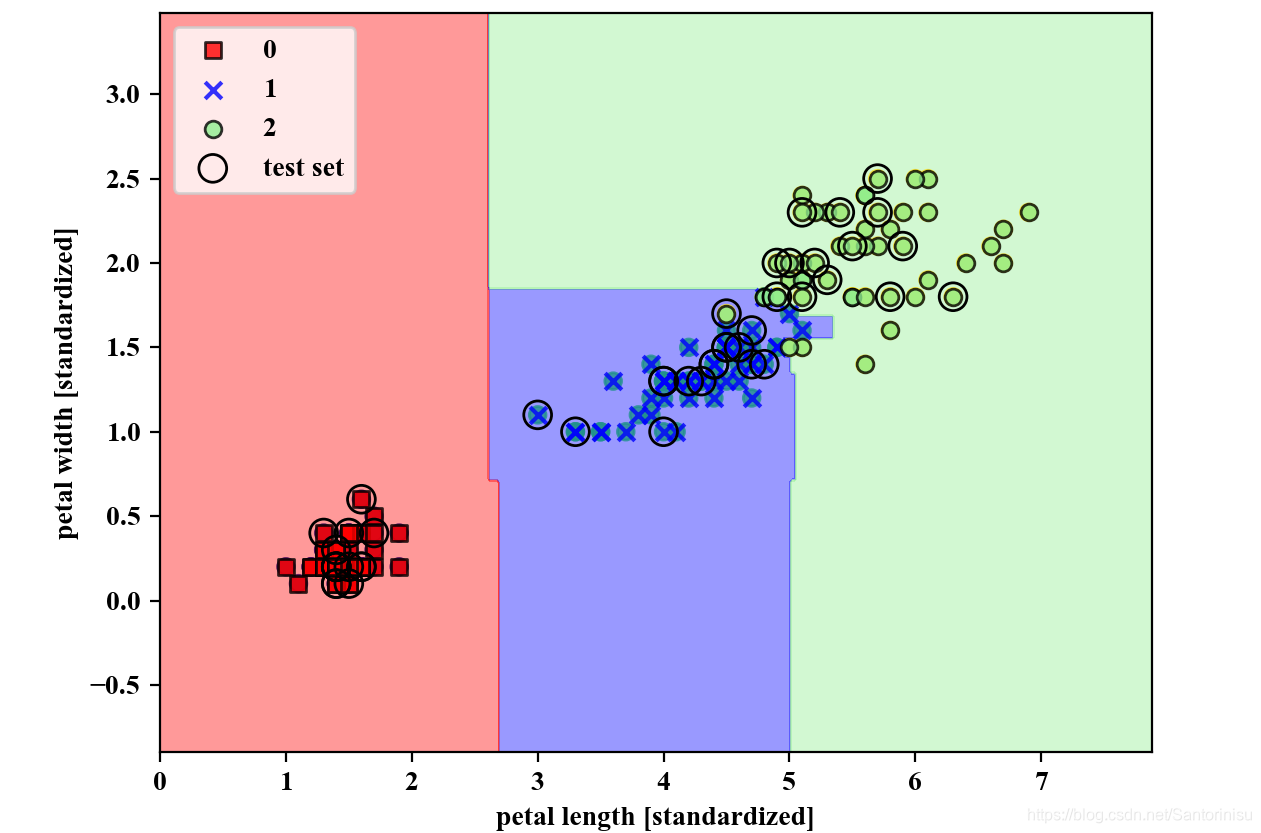
#Section 2: Invoke RandomForest model
forest=RandomForestClassifier(criterion='gini',
n_estimators=25,
random_state=1,
n_jobs=2)
forest.fit(X_train,y_train)
X_combined=np.vstack([X_train,X_test])
y_combined=np.hstack([y_train,y_test])
plot_decision_regions(X=X_combined,
y=y_combined,
classifier=forest,
test_idx=range(105,150))
plt.xlabel('petal length [standardized]')
plt.ylabel('petal width [standardized]')
plt.legend(loc='upper left')
plt.savefig('./fig3.png')
plt.show()
参考文献:
Sebastian Raschka, Vahid Mirjalili. Python机器学习第二版. 南京:东南大学出版社,2018.


 2670
2670


 被折叠的 条评论
为什么被折叠?
被折叠的 条评论
为什么被折叠?
 到【灌水乐园】发言


