


绘制3D图
import matplotlib.pyplot as plt
import numpy as np
from mpl_toolkits.mplot3d import Axes3D
fig = plt.figure()
ax = Axes3D(fig)

plt.show()

fig = plt.figure()
ax = Axes3D(fig)

x = np.arange(-4,4,0.25)
y = np.arange(-4,4,0.25)
X,Y = np.meshgrid(x,y)#x,y传入网格
R = np.sqrt(X**2 + Y**2)
Z = np.sin(R)

#画三D图
ax.plot_surface(X,Y,Z,rstride=1,cstride=1,cmap=plt.get_cmap('rainbow'))
#cmap设置图片颜色,rstride,cstride代表x和y的方向

plt.show()

fig = plt.figure()
ax = Axes3D(fig)

x = np.arange(-4,4,0.25)
y = np.arange(-4,4,0.25)
X,Y = np.meshgrid(x,y)#x,y传入网格
R = np.sqrt(X**2 + Y**2)
Z = np.sin(R)

#画三D图
ax.plot_surface(X,Y,Z,rstride=3,cstride=3,cmap=plt.get_cmap('rainbow'))
#cmap设置图片颜色,rstride,cstride代表x和y的方向

plt.show()

fig = plt.figure()
ax = Axes3D(fig)

x = np.arange(-4,4,0.25)
y = np.arange(-4,4,0.25)
X,Y = np.meshgrid(x,y)#x,y传入网格
R = np.sqrt(X**2 + Y**2)
Z = np.sin(R)

#画三D图
ax.plot_surface(X,Y,Z,rstride=1,cstride=1,cmap=plt.get_cmap('rainbow'))
#cmap设置图片颜色,rstride,cstride代表x和y的方向

ax.contourf(X,Y,Z,zdir='z',offset=-2,cmap='rainbow')
#zdir代表映射的方向,为z方向,offset代表映射的一个位置,到-2这个位置
ax.set_zlim(-2,2)
#设置z轴范围

plt.show()

这个图若是只这样看,看得不全面
若是安装了anaconda电脑上会有自带的ipython


将代码输入进去

按shift+回车键执行

此时可以用鼠标随意自由拉动来观察图像全貌

subplot
import matplotlib.pyplot as plt
import numpy as np
plt.figure()
plt.subplot(2,2,1)
#在一个图片中创建2行2列一个小的绘图,1代表它在这个图像中的第一个位置
plt.plot([0,1],[0,1])
#绘一条从0,0到1,1的直线

plt.subplot(2,2,2)
plt.plot([0,1],[0,1])

plt.subplot(223)#逗号去掉也可
plt.plot([0,1],[0,1])

plt.subplot(224)
plt.plot([0,1],[0,1])

plt.show()

plt.figure()
plt.subplot(2,1,1)
#在一个图片中创建2行1列一个小的绘图,1代表它在这个图像中的第一个位置
plt.plot([0,1],[0,1])
#绘一条从0,0到1,1的直线

plt.subplot(2,3,4)
#因为第一个已经占据了第一列,所以第二张图排到了第4个位置
plt.plot([0,1],[0,1])

plt.subplot(235)#逗号去掉也可
plt.plot([0,1],[0,1])

plt.subplot(236)
plt.plot([0,1],[0,1])

plt.show()

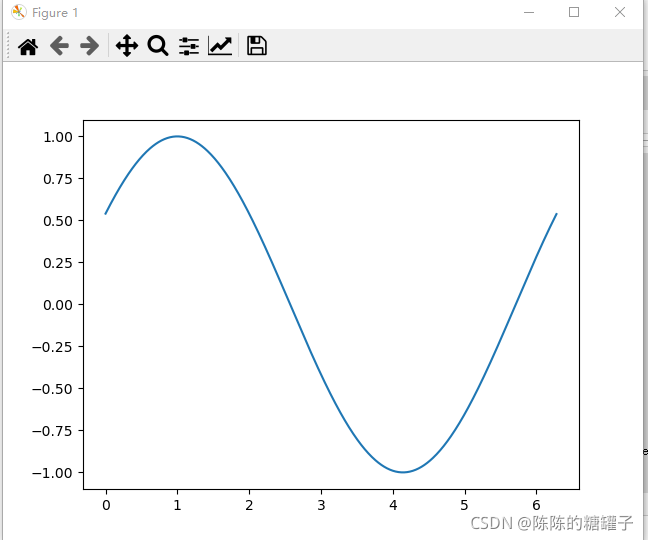
动态图
import matplotlib.pyplot as plt
import numpy as np
from matplotlib import animation
fig,ax = plt.subplots()

x = np.arange(0,2*np.pi,0.01)
#pi就是0.3415926那个
line, = ax.plot(x,np.sin(x))

def animate(i):
    line.set_ydata(np.sin(x+i/10))#y值的改变
    return line,


#初始值,动态图最开始的那张图
def init():
    line.set_ydata(np.sin(x))
    return line,

#画动态图
ani = animation.FuncAnimation(fig=fig,func=animate,init_func=init,interval=20)
#intervel表示间隔是20ms

plt.show()

这里的图无法动起来,所以我们还是要打开ipython

一个动态的不停地绘制正弦曲线的图


 1432
1432


 被折叠的 条评论
为什么被折叠?
被折叠的 条评论
为什么被折叠?
 到【灌水乐园】发言


