


一、如何使用 rem 和 px 函数适配各种屏幕
1、如何适配屏幕
设计稿
大屏
屏幕高

屏幕宽

结论:屏幕宽就左右居中,屏幕高就上下居中
算法
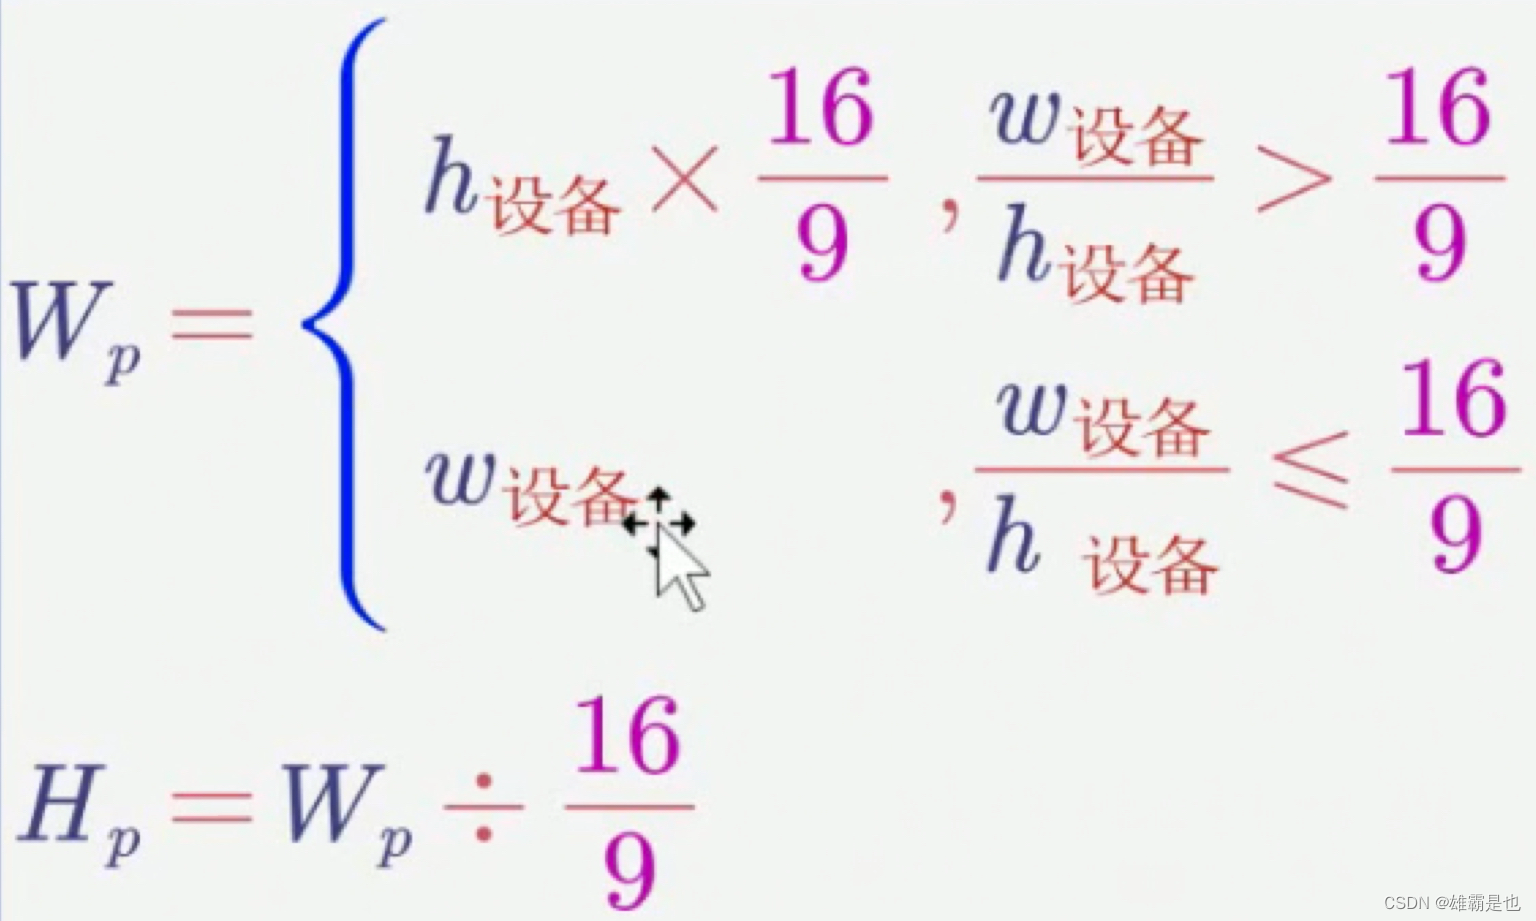
Wp为页面有效宽度,Hp为页面有效高度
页面左右居中,上下居中,四周留白即可
然后在head里用JS设置1rem = Wp /100
1.1 获取设备(浏览器)宽高
const clientWidth = document.documentElement.clientWidth
const clientHeight = document.documentElement.clientHeight
1.2 判断设备宽高是大于16比9还是小于16比9
const pageWidth = clientWidth / clientHeight > 16 / 9 ? clientHeight * (16 / 9) : clientWidth;
const pageHeight = pageWidth / (16/9)
1.3 设置1rem=100px,并写入页面
const string = `<style>html{
	font-size: ${pageWidth / 100}px
}</style>`
document.write(string)
2、 用rem代替像素
像素不能用时用rem

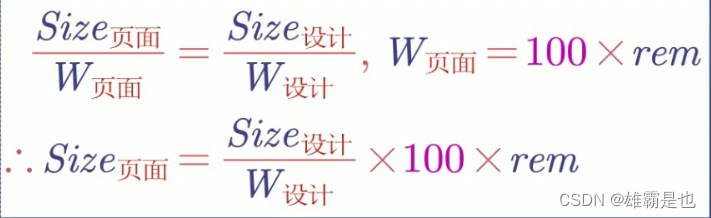
假设某div在设计稿中长100px,设计稿宽度1920px
那么该div在页面中长为100/1920 * 100 rem
2.1 定义px用来转换成rem
@function px($n){
  @return $n /2420 * 100rem;
}
二、如何使用 echarts
1、 引入echarts
import * as echarts from 'echarts';
2、 初始化echarts
const divRef = useRef(null);
	useEffect(()=>{
		var myChart = echarts.init(divRef.current);
     	 此处有省略
})

return (
	此处有省略
  	<div ref={divRef} className="chart"> </div>
	此处有省略
)
3、设置echarts
3.1 基础设置
myChart.setOption({
    textStyle:{
      fontSize: px(12),
      color: '#79839E'
    },
    title:{ show: false},
    legend: {show: false},
    此处有省略
    series:[{
      name:'销量',
      type:'bar',
      data:[5, 20, 36, 10, 10, 20]
    }]
  })
3.2 设置x轴、y轴样式
// x轴样式
xAxis:{
     axisLabel:{
       fontSize: px(12)
     }
 }

//y轴样式
 yAxis: {
     axisLabel:{
       fontSize: px(12)
     }
}
3.3 设置空白区域
grid:{
  x: px(40),
  y: px(40),
  x2: px(40),
  y2: px(40),
}
3.4 修改x轴标签样式
每行两个字
xAxis: {
  axisLabel: {
      formatter(val) {
        if (val.length > 2) {
          const array = val.split('');
          array.splice(2, 0, '\n');
          return array.join('');
        } else {
          return val;
        }
    }
  }
}
注:这样写会报错val.splice(2,0,’\n’);
因为val是字符串,而字符串是没有splice,要先转换成数组,再连在一起
3.5 隐藏x轴图形文字说明
xAxis: {
	axisTick: {show: false}
}
3.6 柱形图加渐变
itemStyle:{
    normal:{
      color: new echarts.graphic.LinearGradient(0,0,1,0,[{
        offset: 0,
        color: '#2034f9'
      },{
      	offset: 1,
        color: '#04a1ff'
      }]),
    }
}
3.7 去掉X轴上的小竖杠
 xAxis: {
   axisTick: {show: false},
 }
3.8 去掉X轴上的白线
 xAxis: {
   axisLine: {show: false},
 }


 7285
7285


 被折叠的 条评论
为什么被折叠?
被折叠的 条评论
为什么被折叠?
 到【灌水乐园】发言


