


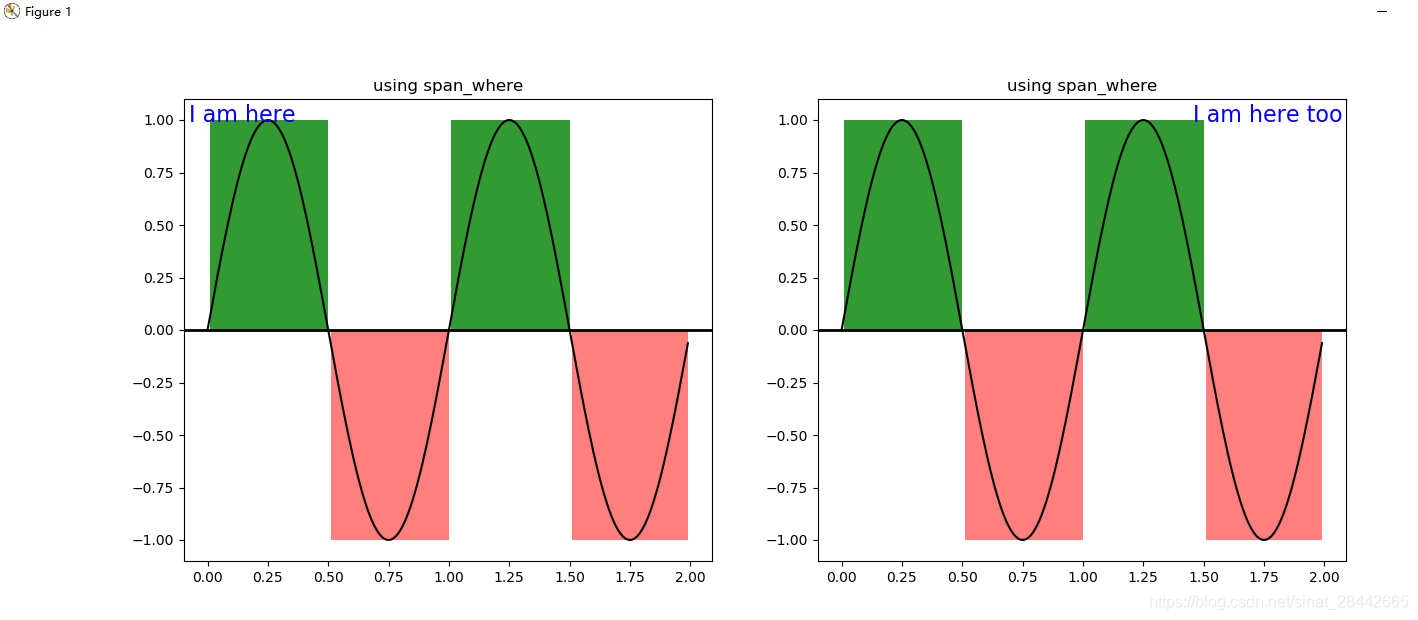
将文本放在matplotlib图的左上角
import numpy as np
import matplotlib.pyplot as plt
import matplotlib.collections as collections


t = np.arange(0.0, 2, 0.01)
s1 = np.sin(2*np.pi*t)
s2 = 1.2*np.sin(4*np.pi*t)

fig = plt.figure(figsize=(15, 6))
ax = fig.add_subplot(1, 2, 1)

ax.set_title('using span_where')
# 设置曲线
ax.plot(t, s1, color='black')
# 设置横轴
ax.axhline(0, color='black', lw=2)
# 设置文本,目标位置 左上角,距离 Y 轴 0.01 倍距离,距离 X 轴 0.95倍距离
ax.text(0.01, 0.95, "I am here ", transform=ax.transAxes, fontdict={'size': '16', 'color': 'b'})

collection = collections.BrokenBarHCollection.span_where(
    t, ymin=0, ymax=1, where=s1 > 0, facecolor='green', alpha=0.8)
ax.add_collection(collection)

collection = collections.BrokenBarHCollection.span_where(
    t, ymin=-1, ymax=0, where=s1 < 0, facecolor='red', alpha=0.5)
ax.add_collection(collection)

"""
ax2
"""
ax2 = fig.add_subplot(1, 2, 2)

ax2.set_title('using span_where')
ax2.plot(t, s1, color='black')
ax2.axhline(0, color='black', lw=2)
# 设置文本,目标位置 左上角,距离 Y 轴 1.91 倍距离(这里说明它是以最左边为轴,需要自行调节),距离 X 轴 0.95倍距离
ax2.text(1.91, 0.95, "I am here too", transform=ax.transAxes, fontdict={'size': '16', 'color': 'b'})

collection = collections.BrokenBarHCollection.span_where(
    t, ymin=0, ymax=1, where=s1 > 0, facecolor='green', alpha=0.8)
ax2.add_collection(collection)

collection = collections.BrokenBarHCollection.span_where(
    t, ymin=-1, ymax=0, where=s1 < 0, facecolor='red', alpha=0.5)
ax2.add_collection(collection)


plt.show()
效果如下:


 1935
1935

 被折叠的 条评论
为什么被折叠?
被折叠的 条评论
为什么被折叠?
 到【灌水乐园】发言


