


直纹面是一种不错的曲面,全部用直线构造即可; 如果直纹面母线上的点共切平面,则可展(这种抽象真漂亮)
老早就想试试画下面这种ruled surface:
【这个“直纹曲面”的原理在现实中的应用是这样的】
发现这是一种直纹面之后就简单了. 我是这么设想的:
先在三维空间里找两个跟坐标平面平行的圆,写成旋转角度的参数方程形式,然后(斜平行)投影到一个垂直于它俩的坐标平面上.
等间隔在两个曲线(圆)上取点,然后连接对应点线段; 对应点之间角度偏差作为一个动态的变量从而得到动的效果.
因为涉及到对应点的序列的生成,以及对应的线段序列的生成,用Geogebra里的交互绘图方式就太麻烦了.
然后,这个软件对矩阵化操作的支持还没有那么强,想来想去就是spreadsheet还没有用到过. 于是从youtube上找到两个视频:
How to Use Spreadsheet on Geogebra
GeoGebra Spreadsheet Power Regression
通过视频学操作应该是最方便的, 其次是网络教程. geogebra.org不知道最近出了什么状况,彻底不能用了;只好去别的地方,发现下面的不错:
然后就得到了开头所示的图片.
The spreadsheet in GeoGebra has most of the regular spreadsheet-features. When it comes to just doing numerical calculations, regular spreadsheet software is more advanced than the GeoGebra spreadsheet; the object-oriented way of doing things in GeoGebra however, makes it a much stronger tool than regular spreadsheets. Apart from manipulating numbers and formulas, you can also manipulate all GeoGebra-objects in the spreadsheet view.
Whenever you need many objects that follow some regular pattern, you can use the spreadsheet.
The basic features of the GeoGebra spreadsheet, features such as: how to make relative copies, how to plot points from the spreadsheet on the drawing pad, and how to use sliders when generating numbers in the spreadsheet, are explained on the pages Functions - Tables and Spreadsheet and Functions - Percentage Change.
Geometrical objects and functions
The recording below demonstrates how to make a simple pattern of circles. It also shows a demonstration of how the Taylor expansion of


 approximates the graph better and better as more terms are used. It is meant as a demonstration of how functions are handled in the spreadsheet, if you just want to demonstrate Taylor expansion, you can use the command:
TaylorPolynomial[<Function>, <x-Value>, <Order Number>]When inserting geometrical objects into the spreadsheet, you must write the command for the object needed. In most cases you can guess the name of the command, start writing and then the code-completion will help.
下载:
Reference:GeoGebra Installation 
GeoGebra Installation
- Installation
- Mass Installation
- FAQ
|
| If you plan to install GeoGebra on multiple devices you may be interested inGeoGebra Mass Installation |
Windows
GeoGebra can be installed for Windows in two ways:
- GeoGebra Installer for Windows (recommended)
- GeoGebra Portable for Windows (runs from USB memory sticks for example)
Please note that the Installer will automatically update to newer versions.
MacOS X
We provide GeoGebra in two ways for Mac OS X:
- GeoGebra in the Mac App Store (recommended)
- GeoGebra Portable for OSX.
Please note that the Mac App Store will automatically update to newer versions.
Linux
The following GeoGebra Linux installers are available:
- 64 bit /32 bit installers for .deb based systems (Debian, Ubuntu)
- 64 bit /32 bit installers for .rpm based systems (Red Hat, openSUSE)
- Portable Linux bundle for 64 and 32 bit Linux systems
Repository
The .deb and .rpm installers will automatically add the official GeoGebra repository to the package management system on the workstation. This will enable automatic update of GeoGebra every time a new version is released. Note that the portable version will not automatically update.
If you want to include GeoGebra in your custom Linux distribution with GeoGebra included, the best way is to add the official GeoGebra repository (http://www.geogebra.net/linux/) to your package management system. The GPG key of the repository is at http://www.geogebra.net/linux/office@geogebra.org.gpg.key. The name of the package isgeogebra5. This will conflict with the earlier versions (4.0, 4.2 and 4.4), which are namedgeogebra (andgeogebra44 for 4.4) and should be deleted first.
All versions
| Version | Windows | Mac OS X | Linux |
|---|---|---|---|
| 4.4 | InstallerPortable | Portable | Portable |
| 5.0 | InstallerPortable | Portable | Portable |
| latest | InstallerPortable | Portable | Portable |
Supported devices and Troubleshooting
Please check the Supported devices page for further information about running GeoGebra on different devices, have a look atthe FAQ for more information and visit the forum for support.
Dynamic Colour
You can make a parabola using trace, as on this page Functions - The Parabola. These traces can instead be created as lines in a spreadsheet.
Parabola. Move the point!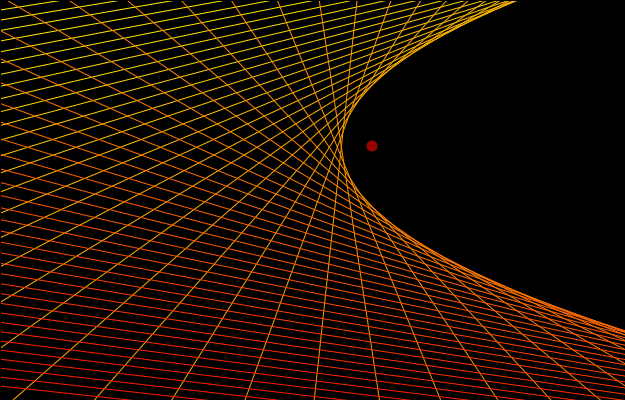
If you let the y-axis be the directrix and a free point A be the focus, then you must make a number of perpendicular bisectors between points on the y-axis and the point A.

In a similar way, you can make perpendicular bisectors between a point and points on a circle, this is shown in the topmost applet.
You specify a dynamic colour by specifying values for red, green and blue. Each value should be between 0 and 1. It is dynamic since you can use variables when specifying the values. In the example above, the following is entered under the Advanced-tab for the first line (in cell B1), these values are then relatively copied when dragging the small rectangle.

When very many objects are used in a worksheet, it may be slow. In such cases it is better to use lists. This is what the next page is about.


 1914
1914

 被折叠的 条评论
为什么被折叠?
被折叠的 条评论
为什么被折叠?
 到【灌水乐园】发言


