


作者:LX
在SuperMap iServer分布式分析服务中,提供了针对海量数据的属性汇总分析功能。本文将介绍如何通过iClient对接分布式分析服务中的属性汇总分析服务并将结果在前端展示。
一、 属性汇总是什么?
分布式分析服务中的属性汇总分析功能指的是对输入的数据集中所选择的属性进行汇总统计。通过对输入的数据集设定分组字段、属性字段以及对属性字段需进行的统计模式,从而得到汇总统计的结果。
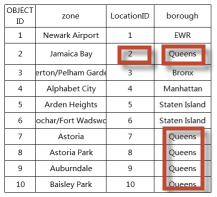
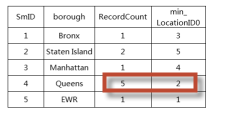
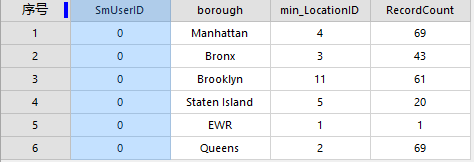
以下图为例,按照字段borough进行分组统计,Queens的个数统计结果为5,再从中取得最小的LocationID为2。
源数据:
属性汇总统计结果:
二、开发准备
1、搭建分布式分析环境并发布分布式分析服务,参考博客《快速搭建iServer大数据分布式空间分析服务》进行分布式分析环境的搭建以及服务的发布;
2、服务端进行属性汇总分析(验证服务有效性)
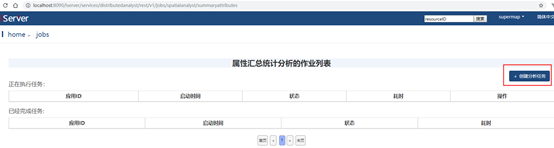
1)发布分布式分析服务,然后进入到服务的jobs资源下,选中属性汇总

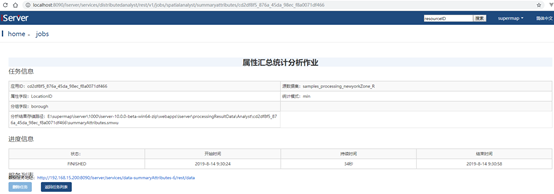
2)创建分析任务

3)分析成功
3、iClient开发包,可以通过官网地址下载: http://support.supermap.com.cn/DownloadCenter/ProductPlatform.aspx
三、 iClient 开发代码
SuperMap提供了多个GIS前端开发地图库,我们在这以iClient for Openlayers为例来对接。
1、引入js文件
需要引入openlayers的css和js文件,以及iclient9-openlayers的css,js文件;
我们的iclient包中只需要引入include-openlayers.js就可以加载以上全部文件
<script type="text/javascript" src="http://iclient.supermap.io/dist/openlayers/include-openlayers.js"></script>
2、定义服务url并创建底图
 //分布式分析服务
  var processingsUrl ="http://localhost:8090/iserver/services/distributedanalyst/rest/v1/jobs";
 //地图服务
  var mapURL ="http://localhost:8090/iserver/services/map-world/rest/maps/World";
  var map = new ol.Map({
                target: 'map',
                view: new ol.View({
                    center: [-73.95, 40.75],
                    zoom: 12,
                    projection: 'EPSG:4326'
                })
            });
   map.addLayer(new ol.layer.Tile({
            source: new ol.source.TileSuperMapRest({
                url: mapURL,
            }),
        }));
3、安全验证
//安全验证
var token=” I5OZZxPYAZIJvL7tCQCZB6qMHrG8hMw0a0hOqvCRlm7sMA_5MyRZSoLZxNbPXHevAvDniCJgtSOiCzx466HPjA..”;
SuperMap.SecurityManager.registerToken(processingsUrl, token);
4、设置属性汇总分析参数
//属性汇总分析参数
 var summaryAttributesJobsParameter = new SuperMap.SummaryAttributesJobsParameter({
       datasetName: "samples_processing_newyorkZone_R",//参与分析的数据集名称
       groupField: "borough",//分组字段
       attributeField: "LocationID",//属性字段
       statisticModes: "min"//统计模式
   });
5、属性汇总分析
//分布式分析服务
var processingService = new ol.supermap.ProcessingService(processingsUrl);
 //执行属性汇总分析
processingService.addSummaryAttributesJob(summaryAttributesJobsParameter, summaryAttributesCompleted);
6、结果展示
分析成功后会把分析结果保存成数据源和工作空间,存储到%iServerRoot%\webapps\iserver\processingResultData目录下,在idesktop打开数据源会看到分析结果如下:
iServer也会将工作空间发布成iServer服务,我们通过在前端查询服务也可以将结果展示在前端地图上来看,前端显示属性汇总结果如下:

附上完整代码:
<!DOCTYPE html>
<html>
<head>
    <meta charset="UTF-8">
    <title data-i18n="resources.title_summaryAttributesJobService"></title>
    <script type="text/javascript" include="echarts" src="../../dist/openlayers/include-openlayers.js"></script>
</head>

<body style=" margin: 0;overflow: hidden;background: #fff;width: 100%;height:100%;position: absolute;top: 0;">
    <div id="map" style="width: 100%;height:100%"></div>
    <div id="infoControl" style=" position: absolute;top: 80px;right: 10px;text-align: left;"></div>
    <script type="text/javascript" include="bootstrap,jquery,widgets" src="../js/include-web.js"></script>
    <script type="text/javascript">
        var host = window.isLocal ? window.server : "http://iclient.supermap.io";
        var processingsUrl = "http://localhost:8090/iserver/services/distributedanalyst/rest/v1/jobs",
            mapURL = "http://localhost:8090/iserver/services/map-world/rest/maps/World",
            map = new ol.Map({
                target: 'map',
                view: new ol.View({
                    center: [-73.95, 40.75],
                    zoom: 12,
                    projection: 'EPSG:4326'
                })
            });
        map.addLayer(new ol.layer.Tile({
            source: new ol.source.TileSuperMapRest({
                url: mapURL,
            }),
        }));
        //安全验证
        SuperMap.SecurityManager.registerToken(processingsUrl, "I5OZZxPYAZIJvL7tCQCZBxiYOPOK8EZwixXh7nTdlfhJ1_cDuVyoHaA1pgUKEG2vJsjHxX1bRvMAf6l6yqzGug..");
        //属性汇总分析
        analyis();
        function analyis() {
            //属性汇总分析参数
            var summaryAttributesJobsParameter = new SuperMap.SummaryAttributesJobsParameter({
                datasetName: "samples_processing_newyorkZone_R",//参与分析的数据集名称
                groupField: "borough",//分组字段
                attributeField: "LocationID",//属性字段
                statisticModes: "min"//统计模式
            });
            //分布式分析服务
            var processingService = new ol.supermap.ProcessingService(processingsUrl);
            //执行属性汇总分析
            processingService.addSummaryAttributesJob(summaryAttributesJobsParameter, summaryAttributesCompleted);
        };
        //分析成功
        function summaryAttributesCompleted(serviceResult) {

            serviceResult.result.setting.serviceInfo.targetServiceInfos.map(function (info) {
               //获取分析成功发布的服务
                var dataUrl = info.serviceAddress + '/data';
               //sql查询参数
                var sqlParam = new SuperMap.GetFeaturesBySQLParameters({
                    queryParameter: {
                        name: "analystResult@UntitledDatasource",
                        attributeFilter: "SMID > 0"
                    },
                    datasetNames: ["UntitledDatasource:analystResult"]
                });
                //sql查询
                new ol.supermap.FeatureService(dataUrl).getFeaturesBySQL(sqlParam,
                    function (serviceResult) {

                        result = serviceResult.result.features.features;
                        console.log("result", result);
                        var names = [];
                        var data1 = [];
                        var data2 = [];
                        for (var i = 0; i < result.length; i++) {
                            names.push(result[i].properties.BOROUGH);
                            data1.push(parseFloat(result[i].properties.MIN_LOCATIONID));
                            data2.push(parseFloat(result[i].properties.RECORDCOUNT));
                        }
                    //设置echarts图表参数
                        option = {
                            color: ['#003366', '#006699'],
                            tooltip: {
                                trigger: 'axis',
                                axisPointer: {
                                    type: 'shadow'
                                }
                            },
                            legend: {
                                data: ['MIN_LOCATIONID', 'RECORDCOUNT']
                            },
                            calculable: true,
                            xAxis: [
                                {
                                    type: 'category',
                                    data: names,
                                    axislabel: {
                                        interval: 0
                                    }
                                }
                            ],
                            yAxis: [
                                {
                                    type: 'value'
                                }
                            ],
                            series: [
                                {
                                    name: 'MIN_LOCATIONID',
                                    type: 'bar',
                                    barGap: 0,
                                    label: {
                                        normal: {
                                            show: true,
                                            position: 'top'
                                        }
                                    },
                                    data: data1
                                },
                                {
                                    name: 'RECORDCOUNT',
                                    type: 'bar',
                                    label: {
                                        normal: {
                                            show: true,
                                            position: 'top'
                                        }
                                    },
                                    data: data2
                                }
                            ]
                        };
                       //创建图表
                        var chart = echarts.init(document.createElement('div'), '', {
                            width: 800,
                            height: 350
                        });
                        chart.setOption(option);
                        var control = new ol.control.Control({
                            element: chart.getDom(),
                            target: document.getElementById('infoControl')
                        });
                        map.addControl(control);

                    });
            });
        }
    </script>
</body>
</html>


 582
582


 被折叠的 条评论
为什么被折叠?
被折叠的 条评论
为什么被折叠?
 到【灌水乐园】发言


