


欢迎关注 『Python』 系列,持续更新中
欢迎关注 『Python』 系列,持续更新中
算法部分源码是我的数模兄弟想要深入研究nmf算法方面的内容发给我让我跑的
参考自博文 https://blog.csdn.net/atease0001/article/details/119903739
当然我们实际计算机项目中一般用现成库的前任写好的命令····
依赖库
import numpy as np
import torch
import random
import matplotlib.pyplot as plt

import pyreadr
import pandas as pd
代码功能
-
导入r语言radata数据
-
通过修改切片选择数据区域,得到待分解的X矩阵

-
调用nmf函数时传入r, maxiter, minError
# 封装好的NMF算法
# X 传入的要被分解的矩阵
# r U V 的维度
# maxiter 最大迭代次数
# minError 迭代损失
def nmf(X, r, maxiter, minError):
- 数据持久化保存
- 绘制损失图
完整代码
# @Time : 2023/4/19 8:19
# @Author : 南黎
# @FileName: 基于pyreadr读入r语言数据转为csv数据.py
import numpy as np
import torch
import random
import matplotlib.pyplot as plt
# 封装好的NMF算法
# X 传入的要被分解的矩阵
# r U V 的维度
# maxiter 最大迭代次数
# minError 迭代损失
def nmf(X, r, maxiter, minError):
# X=U*V'
row, col = X.shape
U = np.around(np.array(np.random.rand(row, r)), 5)#随机生成的U矩阵 服从“0~1”均匀分布的随机样本值。随机样本取值范围是[0,1)
V = np.around(np.array(np.random.rand(col, r)), 5)#随机生成的V矩阵 服从“0~1”均匀分布的随机样本值。随机样本取值范围是[0,1)
obj = []
# 通过迭代
for iter in range(maxiter):
print('-----------------------------')
print('开始第', iter, '次迭代')
# update U
XV = np.dot(X, V)# np.dot(a ,b), 其中a和b都是二维矩阵,此时dot就是进行的矩阵乘法运算
UVV = np.dot(U, np.dot(V.T, V))
U = (U * (XV / np.maximum(UVV, 1e-10)))
# update V
XU = np.dot(X.T, U)
VUU = np.dot(V, np.dot(V.T, V))
V = (V * (XU / np.maximum(VUU, 1e-10)))
d = np.diag(1 / np.maximum(np.sqrt(np.sum(V * V, 0)), 1e-10))
V = np.dot(V, d)
temp = X - np.dot(U, np.transpose(V))#计算损失
error = np.sum(temp * temp)#损失和
print('error:', error)
print('第', iter, '次迭代结束')
obj.append(error)
if error < minError:
break
return U, V, obj
import pyreadr
import pandas as pd
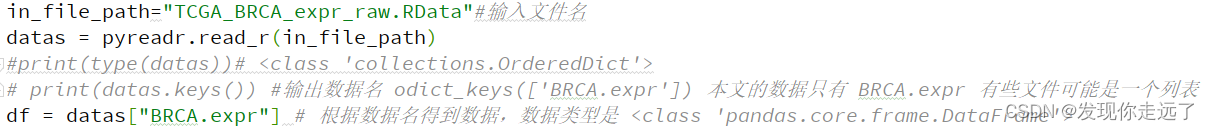
in_file_path="TCGA_BRCA_expr_raw.RData"#输入文件名
datas = pyreadr.read_r(in_file_path)
#print(type(datas))# <class 'collections.OrderedDict'>
# print(datas.keys()) #输出数据名 odict_keys(['BRCA.expr']) 本文的数据只有 BRCA.expr 有些文件可能是一个列表 有多个数据项
df = datas["BRCA.expr"] # 根据数据名得到数据,数据类型是 <class 'pandas.core.frame.DataFrame'>
# print(type(df))# <class 'pandas.core.frame.DataFrame'>
# print(df) #打印数据展示
# #展示列名
# col_names = df.columns
# print("展示列名\n",col_names)
#
# #展示行名
# index_names = df.index
# print("展示行名\n",index_names)
# # 取前面X行数据
# test_df=df.head(10)#取前面10行数据
# print("取前面10行数据\n",test_df)#取前面10行数据
# # df.iloc方法按照切片取指定X行数据
# # 注意:pandas的1.0.0版本后,已经对ix函数进行了升级和重构。 老版本这里不是df.iloc而是df.ix
# # 现在都是新版本了,如果你看到 df.ix这种操作也不要惊讶
#设置要分解矩阵的大小
test_df=df.iloc[0:20, 0:50] # 使用 iloc 函数 ,切片类似matlab 取得第0-20行,第0-50列 (左闭右开)
print("df.iloc方法按照切片取指定X行数据\n",test_df)#取指定X行数据 [5 rows x 1222 columns]
test_df=test_df.values# [20 rows x 50 columns]
print(type(test_df)) # <class 'numpy.ndarray'>
X = np.array(np.abs(test_df)) # 确保非负
print("X shape\n", X.shape)# (20, 50)
# print('X:',X)#初始待分解的矩阵
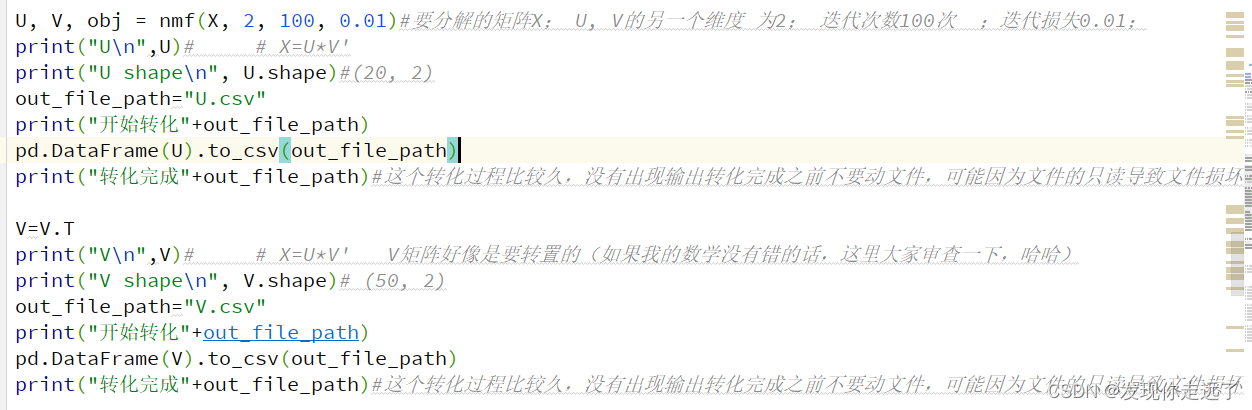
U, V, obj = nmf(X, 2, 100, 0.01)#要分解的矩阵X; U, V的另一个维度 为2; 迭代次数100次 ;迭代损失0.01;
print("U\n",U)# # X=U*V'
print("U shape\n", U.shape)#(20, 2)
out_file_path="U.csv"
print("开始转化"+out_file_path)
pd.DataFrame(U).to_csv(out_file_path)
print("转化完成"+out_file_path)#这个转化过程比较久,没有出现输出转化完成之前不要动文件,可能因为文件的只读导致文件损坏!!
V=V.T
print("V\n",V)# # X=U*V' V矩阵好像是要转置的(如果我的数学没有错的话,这里大家审查一下,哈哈)
print("V shape\n", V.shape)# (50, 2)
out_file_path="V.csv"
print("开始转化"+out_file_path)
pd.DataFrame(V).to_csv(out_file_path)
print("转化完成"+out_file_path)#这个转化过程比较久,没有出现输出转化完成之前不要动文件,可能因为文件的只读导致文件损坏!!
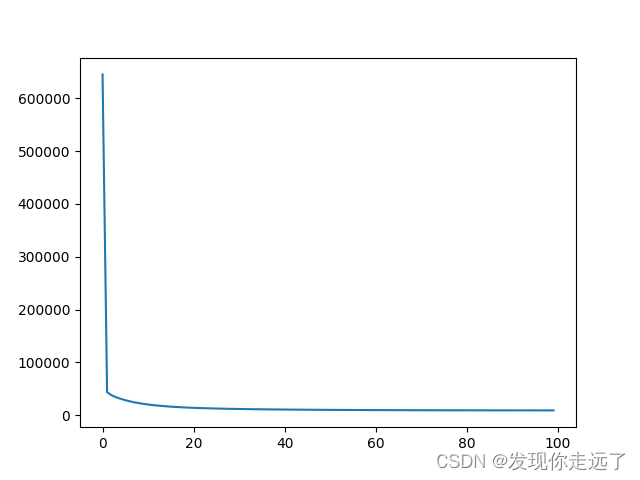
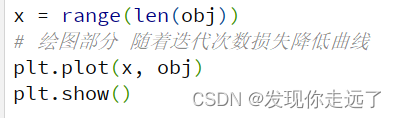
x = range(len(obj))
# 绘图部分 随着迭代次数损失降低曲线
plt.plot(x, obj)
plt.show()
运行代码后出现如下报错,不影响代码运行,强迫症请移步另一文有解决的设置。
【Python】MatplotlibDeprecationWarning: Support for FigureCanvases without a required_interactive 报错解决

总结
大家喜欢的话,给个👍,点个关注!继续跟大家分享敲代码过程中遇到的问题!
版权声明:
发现你走远了@mzh原创作品,转载必须标注原文链接
Copyright 2022 mzh
Crated:2022-1-10
欢迎关注 『Python』 系列,持续更新中
欢迎关注 『Python』 系列,持续更新中
【Python安装第三方库一行命令永久提高速度】
【使用PyInstaller打包Python文件】
【更多内容敬请期待】


 687
687


 被折叠的 条评论
为什么被折叠?
被折叠的 条评论
为什么被折叠?
 到【灌水乐园】发言


