


1. 内核配置(version 4.14)
-
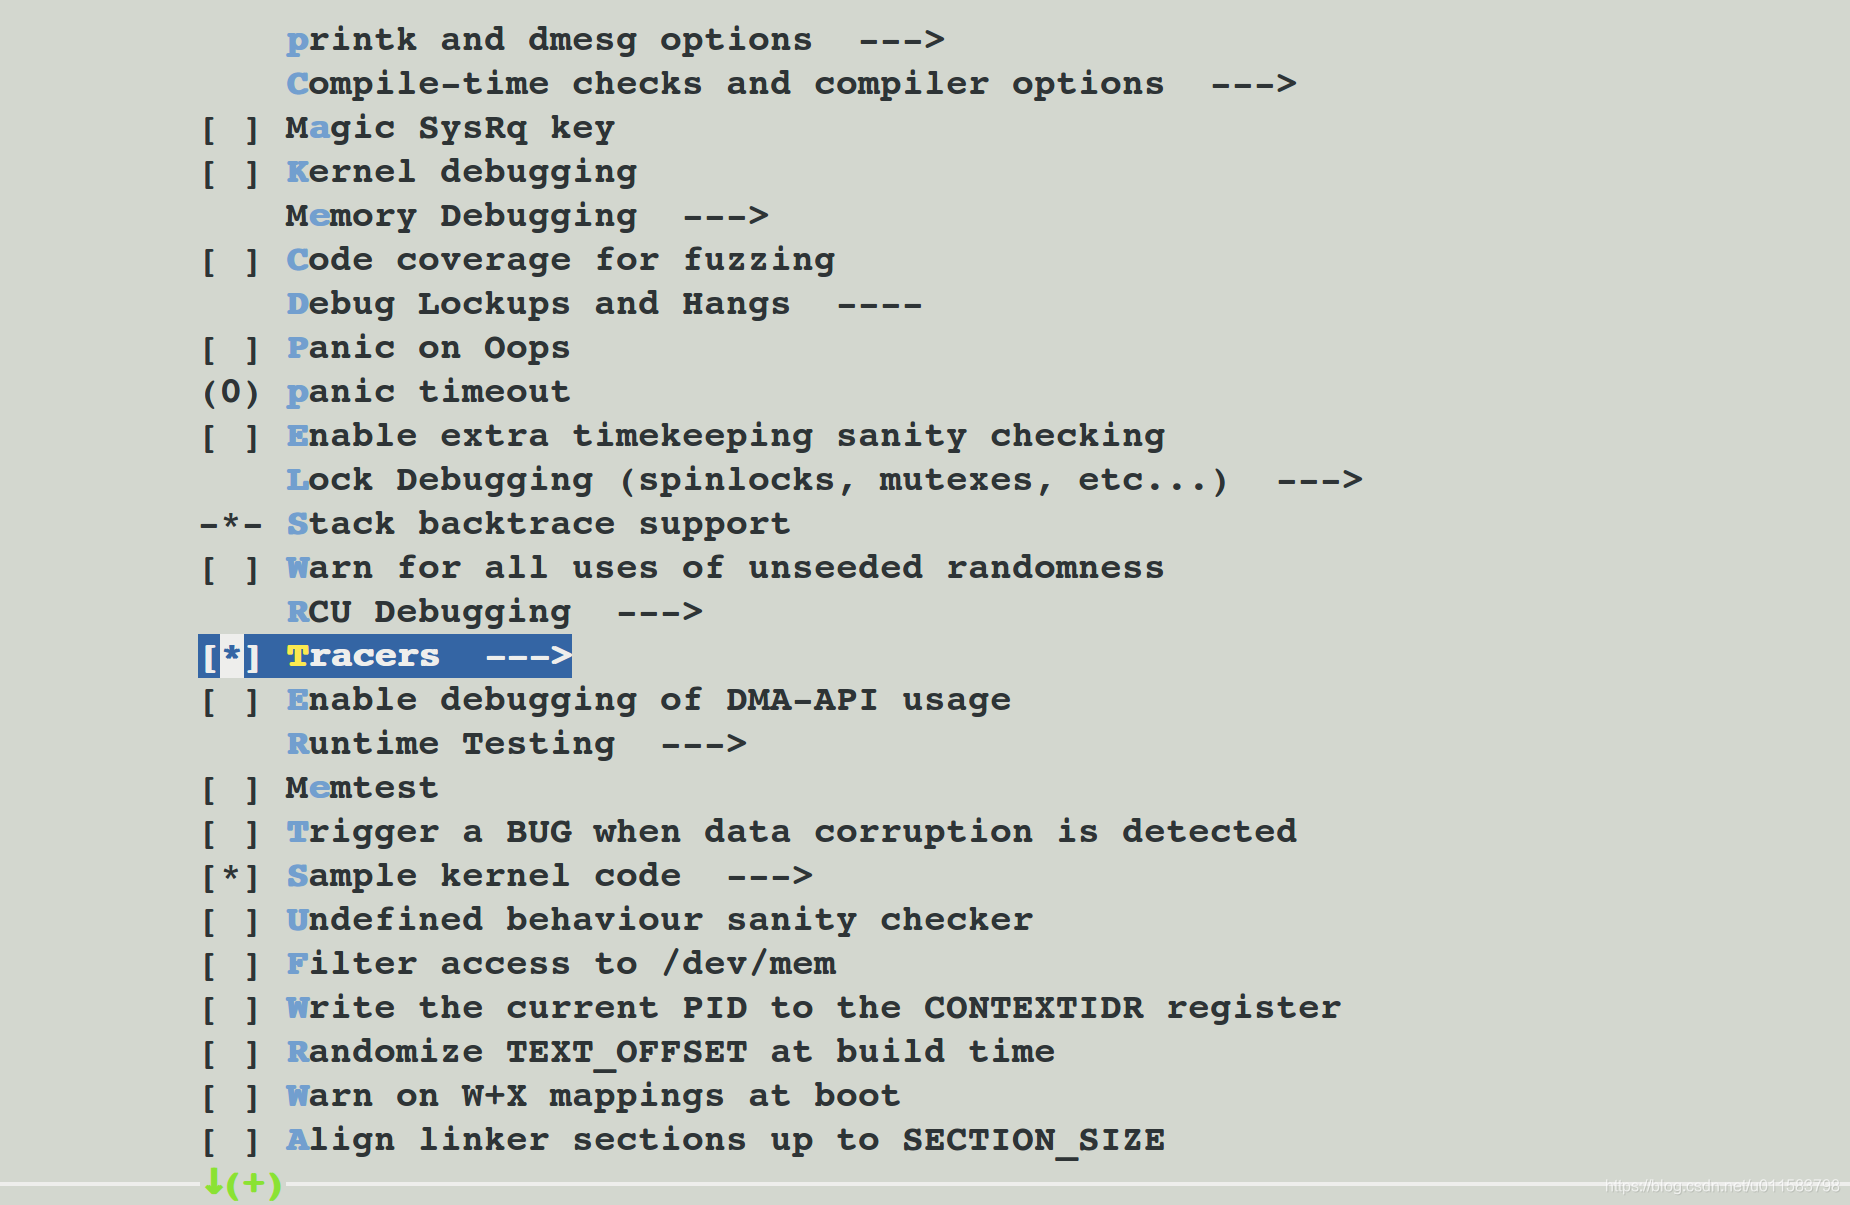
修改内核配置选项


-
挂载debug fs, 并重启
echo >> “debugfs /sys/kernel/debug debugfs defaults 0 0” /etc/fstab
- 查看ftrace支持的跟踪器
cat /sys/kernel/debug/trace/available_tracers
2. 操作流程
# cat README
tracing mini-HOWTO:

# echo 0 > tracing_on : quick way to disable tracing
# echo 1 > tracing_on : quick way to re-enable tracing

 Important files:
  trace			- The static contents of the buffer
			  To clear the buffer write into this file: echo > trace
  trace_pipe		- A consuming read to see the contents of the buffer
  current_tracer	- function and latency tracers
  available_tracers	- list of configured tracers for current_tracer
  buffer_size_kb	- view and modify size of per cpu buffer
  buffer_total_size_kb  - view total size of all cpu buffers

  trace_clock		-change the clock used to order events
       local:   Per cpu clock but may not be synced across CPUs
      global:   Synced across CPUs but slows tracing down.
     counter:   Not a clock, but just an increment
      uptime:   Jiffy counter from time of boot
        perf:   Same clock that perf events use

  trace_marker		- Writes into this file writes into the kernel buffer

  trace_marker_raw		- Writes into this file writes binary data into the kernel buffer
  tracing_cpumask	- Limit which CPUs to trace
  instances		- Make sub-buffers with: mkdir instances/foo
			  Remove sub-buffer with rmdir
  trace_options		- Set format or modify how tracing happens
			  Disable an option by adding a suffix 'no' to the
			  option name
  saved_cmdlines_size	- echo command number in here to store comm-pid list

  available_filter_functions - list of functions that can be filtered on
  set_ftrace_filter	- echo function name in here to only trace these
			  functions
	     accepts: func_full_name or glob-matching-pattern
	     modules: Can select a group via module
	      Format: :mod:<module-name>
	     example: echo :mod:ext3 > set_ftrace_filter
	    triggers: a command to perform when function is hit
	      Format: <function>:<trigger>[:count]
	     trigger: traceon, traceoff
		      enable_event:<system>:<event>
		      disable_event:<system>:<event>
		      stacktrace
		      snapshot
		      dump
		      cpudump
	     example: echo do_fault:traceoff > set_ftrace_filter
	              echo do_trap:traceoff:3 > set_ftrace_filter
	     The first one will disable tracing every time do_fault is hit
	     The second will disable tracing at most 3 times when do_trap is hit
	       The first time do trap is hit and it disables tracing, the
	       counter will decrement to 2. If tracing is already disabled,
	       the counter will not decrement. It only decrements when the
	       trigger did work
	     To remove trigger without count:
	       echo '!<function>:<trigger> > set_ftrace_filter
	     To remove trigger with a count:
	       echo '!<function>:<trigger>:0 > set_ftrace_filter
  set_ftrace_notrace	- echo function name in here to never trace.
	    accepts: func_full_name, *func_end, func_begin*, *func_middle*
	    modules: Can select a group via module command :mod:
	    Does not accept triggers
  set_ftrace_pid	- Write pid(s) to only function trace those pids
		    (function)
  set_graph_function	- Trace the nested calls of a function (function_graph)
  set_graph_notrace	- Do not trace the nested calls of a function (function_graph)
  max_graph_depth	- Trace a limited depth of nested calls (0 is unlimited)

  snapshot		- Like 'trace' but shows the content of the static
			  snapshot buffer. Read the contents for more
			  information
  stack_trace		- Shows the max stack trace when active
  stack_max_size	- Shows current max stack size that was traced
			  Write into this file to reset the max size (trigger a
			  new trace)
  stack_trace_filter	- Like set_ftrace_filter but limits what stack_trace
			  traces
  events/		- Directory containing all trace event subsystems:
      enable		- Write 0/1 to enable/disable tracing of all events
  events/<system>/	- Directory containing all trace events for <system>:
      enable		- Write 0/1 to enable/disable tracing of all <system>
			  events
      filter		- If set, only events passing filter are traced
  events/<system>/<event>/	- Directory containing control files for
			  <event>:
      enable		- Write 0/1 to enable/disable tracing of <event>
      filter		- If set, only events passing filter are traced
      trigger		- If set, a command to perform when event is hit
	    Format: <trigger>[:count][if <filter>]
	   trigger: traceon, traceoff
	            enable_event:<system>:<event>
	            disable_event:<system>:<event>
		    stacktrace
		    snapshot
	   example: echo traceoff > events/block/block_unplug/trigger
	            echo traceoff:3 > events/block/block_unplug/trigger
	            echo 'enable_event:kmem:kmalloc:3 if nr_rq > 1' > \
	                  events/block/block_unplug/trigger
	   The first disables tracing every time block_unplug is hit.
	   The second disables tracing the first 3 times block_unplug is hit.
	   The third enables the kmalloc event the first 3 times block_unplug
	     is hit and has value of greater than 1 for the 'nr_rq' event field.
	   Like function triggers, the counter is only decremented if it
	    enabled or disabled tracing.
	   To remove a trigger without a count:
	     echo '!<trigger> > <system>/<event>/trigger
	   To remove a trigger with a count:
	     echo '!<trigger>:0 > <system>/<event>/trigger
	   Filters can be ignored when removing a trigger.
2.1 irqs跟踪器
当中断被关闭cpu就不能响应其他时间,这时如果有中断发生,cpu需要在下次开中断时才能响应这个中断,这段时间被称为中断延迟。irqs中断跟踪器跟踪中断关闭信息并记录关闭的最大时长
# echo  0 > options/function-trace
# echo irqsoff > current_tracer
# echo 1 > tracing_on
等待一段时间
# echo 0 > tracing_on
# cat trace
# tracer: irqsoff
#
# irqsoff latency trace v1.1.5 on 4.14.108
# --------------------------------------------------------------------
# latency: 23 us, #4/4, CPU#0 | (M:preempt VP:0, KP:0, SP:0 HP:0 #P:4)
--->>> 当前中断的最大延迟为23us,跟踪条目和总跟踪条目为4条
#    -----------------
#    | task: sh-543 (uid:0 nice:0 policy:0 rt_prio:0) --->>> 当前发生中断延迟的进程pid 543,名称sh
#    -----------------
#  => started at: blk_flush_plug_list --->>> 发生中断的开始函数
#  => ended at:   blk_flush_plug_list --->>> 发生中断的结束函数
#
#
#                  _------=> CPU#            --->>> 进程运行的CPU
#                 / _-----=> irqs-off           --->>> d 表示中断已经关闭
#                | / _----=> need-resched    --->>>  需要重新调度标志N: TIF_NEED_RESCHED + PREEMPT_RESCHED,n:TIF_NEED_RESCHED ,p:PREEMPT_RESCHED,.: none
#                || / _---=> hardirq/softirq   --->>> H: 一次软中断中发生了一次硬中断,h:硬中断,s:软中断,.: none
#                ||| / _--=> preempt-depth   --->>> 抢占关闭的嵌套层级
#                |||| /     delay    --->>> 用一些特殊的符号表示延迟的范围,大于1s:$,大于1000us: #, 大于100us:!,大于10us:+
#  cmd     pid   ||||| time  |   caller
#     \   /      |||||  \    |   /
      sh-543     0d...    0us+: trace_hardirqs_off <-blk_flush_plug_list
      sh-543     0d...   22us : trace_hardirqs_on <-blk_flush_plug_list
      sh-543     0d...   24us : stop_critical_timings.part.4 <-blk_flush_plug_list
      sh-543     0d...   28us : <stack trace>
 => ext4_writepages
 => do_writepages
 => __filemap_fdatawrite_range
 => file_write_and_wait_range
 => ext4_sync_file
 => vfs_fsync_range
 => ext4_file_write_iter
 => __vfs_write
 => vfs_write
 => SyS_write
 => el0_svc_naked
2.2 preemptoff 跟踪器
当抢占关闭时,虽然可以响应中断,但高优先级的进程在中断处理完成后,不能抢占低优先级进程直到打开抢占,这样会导致抢占延迟。preemptoff 用于跟踪和记录关闭抢占的最大延迟。
# cd /sys/kernel/debug/tracing/
# echo 0 > options/function-trace
# echo preemptoff > current_tracer
# echo 1 > tracing_on
# echo 0 > tracing_on
# cat trace
# tracer: preemptoff
#
# preemptoff latency trace v1.1.5 on 4.14.108
# --------------------------------------------------------------------
# latency: 32 us, #4/4, CPU#0 | (M:preempt VP:0, KP:0, SP:0 HP:0 #P:4)
#    -----------------
#    | task: sshd-543 (uid:0 nice:0 policy:0 rt_prio:0)
#    -----------------
#  => started at: ip_finish_output2
#  => ended at:   __local_bh_enable_ip
#
#
#                  _------=> CPU#
#                 / _-----=> irqs-off
#                | / _----=> need-resched
#                || / _---=> hardirq/softirq
#                ||| / _--=> preempt-depth   --->>> 此处抢占深度为 1
#                |||| /     delay
#  cmd     pid   ||||| time  |   caller
#     \   /      |||||  \    |   /
    sshd-543     0....    0us+: ip_finish_output2 <-ip_finish_output2
    sshd-543     0d..1   31us : __local_bh_enable_ip <-__local_bh_enable_ip
    sshd-543     0d..1   33us : trace_preempt_on <-__local_bh_enable_ip
    sshd-543     0d..1   36us : <stack trace>
 => ip_finish_output
 => ip_output
 => ip_local_out
 => ip_queue_xmit
 => __tcp_transmit_skb
 => tcp_write_xmit
 => __tcp_push_pending_frames
 => tcp_push
 => tcp_sendmsg_locked
 => tcp_sendmsg
 => inet_sendmsg
 => sock_sendmsg
 => sock_write_iter
 => __vfs_write
 => vfs_write
 => SyS_write
 => el0_svc_naked
2.3 preemptirqoff 跟踪器
在同时存在关闭抢占和关闭中断的上下文中,使用preemptirqoff 跟踪记录其最大延迟
# cd /sys/kernel/debug/tracing/
# echo 0 > options/function-trace
# echo preemptirqsoff > current_tracer
# echo 1 > tracing_on
# echo 0 > tracing_on
# cat trace
# tracer: preemptirqsoff
#
# preemptirqsoff latency trace v1.1.5 on 4.14.108
# --------------------------------------------------------------------
# latency: 35 us, #4/4, CPU#0 | (M:preempt VP:0, KP:0, SP:0 HP:0 #P:4)
#    -----------------
#    | task: sshd-543 (uid:0 nice:0 policy:0 rt_prio:0)
#    -----------------
#  => started at: el1_irq
#  => ended at:   el1_irq
#
#
#                  _------=> CPU#
#                 / _-----=> irqs-off
#                | / _----=> need-resched
#                || / _---=> hardirq/softirq
#                ||| / _--=> preempt-depth
#                |||| /     delay
#  cmd     pid   ||||| time  |   caller
#     \   /      |||||  \    |   /
    sshd-543     0d...    0us+: trace_hardirqs_off <-el1_irq
    sshd-543     0d...   35us : trace_hardirqs_on <-el1_irq
    sshd-543     0d...   37us : stop_critical_timings.part.4 <-el1_irq
    sshd-543     0d...   39us : <stack trace>
 => ip_finish_output2
 => ip_finish_output
 => ip_output
 => ip_local_out
 => ip_queue_xmit
 => __tcp_transmit_skb
 => tcp_write_xmit
 => __tcp_push_pending_frames
 => tcp_push
 => tcp_sendmsg_locked
 => tcp_sendmsg
 => inet_sendmsg
 => sock_sendmsg
 => sock_write_iter
 => __vfs_write
 => vfs_write
 => SyS_write
 => el0_svc_naked
2.4 function跟踪器
记录当前系统运行过程中的所有函数,可以使用set_ftrace_pid跟踪某个进程
# cd /sys/kernel/debug/tracing/
# echo 521 > set_ftrace_pid                                      --->>> 跟踪PID为521的进程
# echo function_graph > current_tracer
# cat trace
# tracer: function_graph
#
# CPU  DURATION                  FUNCTION CALLS
# |     |   |                     |   |   |   |
 1)   6.698 us    |          } /* pick_next_task_idle */
 ------------------------------------------
 1)  test_tu-521   =>    <idle>-0
 ------------------------------------------

 1)   0.349 us    |  fpsimd_thread_switch();
 1)   0.238 us    |  uao_thread_switch();
 ------------------------------------------
 1)    <idle>-0    =>  test_tu-521
 ------------------------------------------

 1)               |          finish_task_switch() {
 1)               |            _raw_spin_unlock_irq() {
 1)   0.254 us    |              preempt_count_sub();
 1)   2.651 us    |            }
 1)   4.858 us    |          }
 1)   0.302 us    |          preempt_count_sub();
 1) * 10100.14 us |        } /* schedule */
 1)               |        hrtimer_try_to_cancel() {
 1)   0.285 us    |          hrtimer_active();
 1)   2.476 us    |        }
 1) * 10131.96 us |      } /* do_nanosleep */
 1) * 10136.63 us |    } /* hrtimer_nanosleep */
 1) * 10141.06 us |  } /* SyS_nanosleep */
 1)               |  SyS_ioctl() {
 1)               |    __fdget() {
 1)               |      __fget_light() {
 1)               |        __fget() {
 1)   0.254 us    |          __rcu_read_lock();
 1)   0.239 us    |          __rcu_read_unlock();
 1)   4.666 us    |        }
 1)   6.809 us    |      }
 1)   9.175 us    |    }
 1)               |    do_vfs_ioctl() {
 1)               |      iav_ioctl [iav]() {
 1)   0.445 us    |        iav_encode_ioctl [iav]();
 1)   2.714 us    |      }
 1)   5.031 us    |    }
 1)   0.254 us    |    fput();
 1) + 20.587 us   |  }
 1)               |  SyS_nanosleep() {
 1)   0.397 us    |    get_timespec64();
 1)               |    hrtimer_nanosleep() {
 1)   0.286 us    |      hrtimer_init();
 1)               |      do_nanosleep() {
 1)               |        hrtimer_start_range_ns() {
 1)               |          lock_hrtimer_base.isra.1() {
 1)               |            _raw_spin_lock_irqsave() {
 1)               |              preempt_count_add() {
 1)   0.301 us    |                preempt_count_add.part.3();
 1)   2.460 us    |              }
 1)   4.666 us    |            }
 1)   6.968 us    |          }
 1)               |          ktime_get() {
 1)   0.238 us    |            arch_counter_read();
 1)   2.429 us    |          }
 1)   0.254 us    |          get_nohz_timer_target();
 1)   0.317 us    |          enqueue_hrtimer();
 1)               |          _raw_spin_unlock_irqrestore() {
 1)   0.587 us    |            preempt_count_sub();
 1)   2.762 us    |          }
 1) + 23.032 us   |        }
 1)               |        schedule() {
 1)   0.270 us    |          preempt_count_add.part.3();
 1)               |          rcu_note_context_switch() {
 1)   0.238 us    |            rcu_sched_qs();
 1)   0.222 us    |            rcu_preempt_qs();
 1)   4.651 us    |          }
 1)               |          _raw_spin_lock() {
 1)   0.238 us    |            preempt_count_add();
 1)   2.603 us    |          }
 1)   0.317 us    |          update_rq_clock.part.6();
 1)               |          deactivate_task() {
 1)               |            dequeue_task_fair() {
 1)               |              update_curr() {
 1)   0.238 us    |                update_min_vruntime();
 1)   2.445 us    |              }
 1)   0.254 us    |              __update_load_avg_se.isra.3();
 1)   0.286 us    |              __update_load_avg_cfs_rq.isra.4();
 1)   0.222 us    |              clear_buddies();
 1)   0.254 us    |              account_entity_dequeue();
 1)   0.238 us    |              update_cfs_shares();
 1)   0.222 us    |              update_min_vruntime();
 1)               |              update_curr() {
 1)   0.254 us    |                update_min_vruntime();
 1)   2.397 us    |              }
 1)   0.254 us    |              __update_load_avg_se.isra.3();
 1)   0.270 us    |              __update_load_avg_cfs_rq.isra.4();
 1)   0.222 us    |              clear_buddies();
 1)   0.254 us    |              account_entity_dequeue();
 1)   2.603 us    |          } /* _raw_spin_lock */
 1)   0.317 us    |          update_rq_clock.part.6();
 1)               |          deactivate_task() {
 1)               |            dequeue_task_fair() {
 1)               |              update_curr() {
 1)   0.238 us    |                update_min_vruntime();
 1)   2.445 us    |              }
 1)   0.254 us    |              __update_load_avg_se.isra.3();
 1)   0.286 us    |              __update_load_avg_cfs_rq.isra.4();
 1)   0.222 us    |              clear_buddies();
 1)   0.254 us    |              account_entity_dequeue();
 1)   0.238 us    |              update_cfs_shares();
 1)   0.222 us    |              update_min_vruntime();
 1)               |              update_curr() {
 1)   0.254 us    |                update_min_vruntime();
 1)   2.397 us    |              }
 1)   0.254 us    |              __update_load_avg_se.isra.3();
 1)   0.270 us    |              __update_load_avg_cfs_rq.isra.4();
 1)   0.222 us    |              clear_buddies();
 1)   0.254 us    |              account_entity_dequeue();
 1)   0.269 us    |              update_cfs_shares();
 1)   0.238 us    |              update_min_vruntime();
 1)   0.238 us    |              hrtick_update();
 1) + 38.032 us   |            }
 1) + 40.206 us   |          }
 1)               |          pick_next_task_fair() {
 1)   0.207 us    |            __rcu_read_lock();
 1)   0.223 us    |            __msecs_to_jiffies();
 1)   0.222 us    |            __rcu_read_unlock();
 1)   6.682 us    |          }
 1)               |          pick_next_task_idle() {
 1)               |            put_prev_task_fair() {
 1)   0.222 us    |              put_prev_entity();
 1)   0.238 us    |              put_prev_entity();
 1)   4.461 us    |            }
 1)   6.683 us    |          }
 ------------------------------------------
 1)  test_tu-521   =>    <idle>-0
 ------------------------------------------

 1)   0.349 us    |  fpsimd_thread_switch();
 1)   0.223 us    |  uao_thread_switch();
 ------------------------------------------
 1)    <idle>-0    =>  test_tu-521
 ------------------------------------------

 1)               |          finish_task_switch() {
 1)               |            _raw_spin_unlock_irq() {
 1)   0.238 us    |              preempt_count_sub();
 1)   2.413 us    |            }
 1)   4.952 us    |          }
 1)   0.286 us    |          preempt_count_sub();
 1) * 10100.77 us |        }
 1)               |        hrtimer_try_to_cancel() {
 1)   0.302 us    |          hrtimer_active();
 1)   2.523 us    |        }
 1) * 10132.52 us |      }
 1) * 10137.04 us |    }
 1) * 10141.73 us |  } /* SyS_nanosleep */
2.5 动态ftrace
动态ftrace需要确保内核打开CONFIG_DYNANIC_FTRACE选项,使用set_ftrace_filter 设置需要跟踪的函数,set_ftrace_notrace设置不要跟踪的函数。
echo <match*> | <*match> |<match> >|>> set_ftrace_filter
其中* 通配符表示,支持所有match开头,结尾,包含match的函数。> 表示覆盖,>> 表示追加
echo > set_ftrace_filter 表示清空过滤器
# echo hrtimer_interrupt SyS_nanosleep > set_ftrace_filter
# echo function > current_tracer
# echo 1 > tracing_on
# usleep 1
# echo 0 > tracing_on
# cat trace
# tracer: function
#
# entries-in-buffer/entries-written: 2707/2707   #P:4
#
#                              _-----=> irqs-off
#                             / _----=> need-resched
#                            | / _---=> hardirq/softirq
#                            || / _--=> preempt-depth
#                            ||| /     delay
#           TASK-PID   CPU#  ||||    TIMESTAMP  FUNCTION
#              | |       |   ||||       |         |
          <idle>-0     [000] d.h2   738.772341: hrtimer_interrupt <-arch_timer_handler_virt
          <idle>-0     [000] d.h2   738.773341: hrtimer_interrupt <-arch_timer_handler_virt
          <idle>-0     [000] d.h2   738.774341: hrtimer_interrupt <-arch_timer_handler_virt
          <idle>-0     [000] d.h2   738.775341: hrtimer_interrupt <-arch_timer_handler_virt
          <idle>-0     [000] d.h2   738.776341: hrtimer_interrupt <-arch_timer_handler_virt
          <idle>-0     [000] d.h2   738.777341: hrtimer_interrupt <-arch_timer_handler_virt
          <idle>-0     [000] d.h2   738.780342: hrtimer_interrupt <-arch_timer_handler_virt
          <idle>-0     [003] d.h2   738.780519: hrtimer_interrupt <-arch_timer_handler_virt
     test_tuning-523   [003] ...1   738.780533: SyS_nanosleep <-el0_svc_naked
          <idle>-0     [002] d.h2   738.782342: hrtimer_interrupt <-arch_timer_handler_virt
          <idle>-0     [003] d.h2   738.790588: hrtimer_interrupt <-arch_timer_handler_virt
     test_tuning-523   [003] ...1   738.790601: SyS_nanosleep <-el0_svc_naked
          <idle>-0     [002] d.h2   738.793342: hrtimer_interrupt <-arch_timer_handler_virt
          <idle>-0     [003] d.h2   738.800656: hrtimer_interrupt <-arch_timer_handler_virt
     test_tuning-523   [003] ...1   738.800669: SyS_nanosleep <-el0_svc_naked
          <idle>-0     [002] d.h2   738.804342: hrtimer_interrupt <-arch_timer_handler_virt
          <idle>-0     [003] d.h2   738.810724: hrtimer_interrupt <-arch_timer_handler_virt
     test_tuning-523   [003] ...1   738.810736: SyS_nanosleep <-el0_svc_naked
          <idle>-0     [002] d.h2   738.815342: hrtimer_interrupt <-arch_timer_handler_virt
          <idle>-0     [003] d.h2   738.820791: hrtimer_interrupt <-arch_timer_handler_virt
     test_tuning-523   [003] ...1   738.820804: SyS_nanosleep <-el0_svc_naked
          <idle>-0     [002] d.h2   738.826342: hrtimer_interrupt <-arch_timer_handler_virt
          <idle>-0     [003] d.h2   738.830859: hrtimer_interrupt <-arch_timer_handler_virt
     test_tuning-523   [003] ...1   738.830872: SyS_nanosleep <-el0_svc_naked
          <idle>-0     [002] d.h2   738.837342: hrtimer_interrupt <-arch_timer_handler_virt
          <idle>-0     [003] d.h2   738.840927: hrtimer_interrupt <-arch_timer_handler_virt
     test_tuning-523   [003] ...1   738.840940: SyS_nanosleep <-el0_svc_naked
2.6 事件跟踪
tracepoint可以输出参数,局部变量等信息
# echo sample-trace:* > set_event
# echo 1 > tracing_on
# cat trace
# tracer: nop
#
# entries-in-buffer/entries-written: 121/121   #P:4
#
#                              _-----=> irqs-off
#                             / _----=> need-resched
#                            | / _---=> hardirq/softirq
#                            || / _--=> preempt-depth
#                            ||| /     delay
#           TASK-PID   CPU#  ||||    TIMESTAMP  FUNCTION
#              | |       |   ||||       |         |
    event-sample-569   [001] ....  3131.692378: foo_bar: foo hello 1540 0x604 BIT3|0x600 {} Mother Goose (00000000,0000000f)
    event-sample-569   [001] ....  3132.716373: foo_bar: foo hello 1541 0x605 BIT1|BIT3|0x600 {0x1} Snoopy (00000000,0000000f)
    event-sample-569   [001] ....  3133.740374: foo_bar: foo hello 1542 0x606 BIT2|BIT3|0x600 {0x1,0x2} Gandalf (00000000,0000000f)
    event-sample-569   [001] ....  3134.764374: foo_bar: foo hello 1543 0x607 BIT1|BIT2|BIT3|0x600 {0x1,0x2,0x3} Frodo (00000000,0000000f)
    event-sample-569   [001] ....  3135.788374: foo_bar: foo hello 1544 0x608 BIT4|0x600 {0x1,0x2,0x3,0x4} One ring to rule them all (00000000,0000000f)
    event-sample-569   [001] ....  3136.812373: foo_bar: foo hello 1545 0x609 BIT1|BIT4|0x600 {} Mother Goose (00000000,0000000f)
    event-sample-569   [001] ....  3137.836374: foo_bar: foo hello 1546 0x60a BIT2|BIT4|0x600 {0x1} Snoopy (00000000,0000000f)
    event-sample-569   [001] ....  3138.860374: foo_bar: foo hello 1547 0x60b BIT1|BIT2|BIT4|0x600 {0x1,0x2} Gandalf (00000000,0000000f)
    event-sample-569   [001] ....  3139.884374: foo_bar: foo hello 1548 0x60c BIT3|BIT4|0x600 {0x1,0x2,0x3} Frodo (00000000,0000000f)
    event-sample-569   [001] ....  3140.908373: foo_bar: foo hello 1549 0x60d BIT1|BIT3|BIT4|0x600 {0x1,0x2,0x3,0x4} One ring to rule them all (00000000,0000000f)
    event-sample-569   [001] ....  3141.932374: foo_bar: foo hello 1550 0x60e BIT2|BIT3|BIT4|0x600 {} Mother Goose (00000000,0000000f)
    event-sample-569   [001] ....  3142.956374: foo_bar: foo hello 1551 0x60f BIT1|BIT2|BIT3|BIT4|0x600 {0x1} Snoopy (00000000,0000000f)
    event-sample-569   [001] ....  3143.980374: foo_bar: foo hello 1552 0x610 0x610 {0x1,0x2} Gandalf (00000000,0000000f)
    event-sample-569   [001] ....  3145.004374: foo_bar: foo hello 1553 0x611 BIT1|0x610 {0x1,0x2,0x3} Frodo (00000000,0000000f)
    event-sample-569   [001] ....  3146.028374: foo_bar: foo hello 1554 0x612 BIT2|0x610 {0x1,0x2,0x3,0x4} One ring to rule them all (00000000,0000000f)
    event-sample-569   [001] ....  3147.052374: foo_bar: foo hello 1555 0x613 BIT1|BIT2|0x610 {} Mother Goose (00000000,0000000f)
    event-sample-569   [001] ....  3148.076374: foo_bar: foo hello 1556 0x614 BIT3|0x610 {0x1} Snoopy (00000000,0000000f)
    event-sample-569   [001] ....  3149.100374: foo_bar: foo hello 1557 0x615 BIT1|BIT3|0x610 {0x1,0x2} Gandalf (00000000,0000000f)
    event-sample-569   [001] ....  3150.124376: foo_bar: foo hello 1558 0x616 BIT2|BIT3|0x610 {0x1,0x2,0x3} Frodo (00000000,0000000f)
    event-sample-569   [001] ....  3150.124381: foo_with_template_simple: foo HELLO 1558
    event-sample-569   [001] ....  3150.124383: foo_with_template_print: bar I have to be different 1558
 event-sample-fn-590   [001] ....  3150.700375: foo_bar_with_fn: foo Look at me 0
 event-sample-fn-590   [001] ....  3150.700377: foo_with_template_fn: foo Look at me too 0
    event-sample-569   [001] ....  3151.148375: foo_bar: foo hello 1559 0x617 BIT1|BIT2|BIT3|0x610 {0x1,0x2,0x3,0x4} One ring to rule them all (00000000,0000000f)
    event-sample-569   [001] ....  3151.148378: foo_with_template_simple: foo HELLO 1559
    event-sample-569   [001] ....  3151.148379: foo_with_template_print: bar I have to be different 1559
 event-sample-fn-590   [001] ....  3151.724373: foo_bar_with_fn: foo Look at me 1
 event-sample-fn-590   [001] ....  3151.724375: foo_with_template_fn: foo Look at me too 1
    event-sample-569   [001] ....  3152.172387: foo_bar: foo hello 1560 0x618 BIT4|0x610 {} Mother Goose (00000000,0000000f)
    event-sample-569   [001] ....  3152.172389: foo_with_template_simple: foo HELLO 1560
    event-sample-569   [001] ....  3152.172390: foo_bar_with_cond: foo Some times print 1560
    event-sample-569   [001] ....  3152.172391: foo_with_template_cond: foo prints other times 1560
    event-sample-569   [001] ....  3152.172392: foo_with_template_print: bar I have to be different 1560
 event-sample-fn-590   [001] ....  3152.748374: foo_bar_with_fn: foo Look at me 2
 event-sample-fn-590   [001] ....  3152.748376: foo_with_template_fn: foo Look at me too 2
    event-sample-569   [001] ....  3153.196375: foo_bar: foo hello 1561 0x619 BIT1|BIT4|0x610 {0x1} Snoopy (00000000,0000000f)
    event-sample-569   [001] ....  3153.196377: foo_with_template_simple: foo HELLO 1561
    event-sample-569   [001] ....  3153.196378: foo_with_template_print: bar I have to be different 1561
 event-sample-fn-590   [001] ....  3153.772373: foo_bar_with_fn: foo Look at me 3
 event-sample-fn-590   [001] ....  3153.772375: foo_with_template_fn: foo Look at me too 3
    event-sample-569   [001] ....  3154.220383: foo_bar: foo hello 1562 0x61a BIT2|BIT4|0x610 {0x1,0x2} Gandalf (00000000,0000000f)
    event-sample-569   [001] ....  3154.220385: foo_with_template_simple: foo HELLO 1562
    event-sample-569   [001] ....  3154.220386: foo_with_template_print: bar I have to be different 1562
 event-sample-fn-590   [001] ....  3154.796374: foo_bar_with_fn: foo Look at me 4
 event-sample-fn-590   [001] ....  3154.796376: foo_with_template_fn: foo Look at me too 4
    event-sample-569   [001] ....  3155.244375: foo_bar: foo hello 1563 0x61b BIT1|BIT2|BIT4|0x610 {0x1,0x2,0x3} Frodo (00000000,0000000f)
    event-sample-569   [001] ....  3155.244377: foo_with_template_simple: foo HELLO 1563
    event-sample-569   [001] ....  3155.244378: foo_with_template_print: bar I have to be different 1563
 event-sample-fn-590   [001] ....  3155.820372: foo_bar_with_fn: foo Look at me 5
 event-sample-fn-590   [001] ....  3155.820374: foo_with_template_fn: foo Look at me too 5
    event-sample-569   [001] ....  3156.268374: foo_bar: foo hello 1564 0x61c BIT3|BIT4|0x610 {0x1,0x2,0x3,0x4} One ring to rule them all (00000000,0000000f)
    event-sample-569   [001] ....  3156.268376: foo_with_template_simple: foo HELLO 1564
    event-sample-569   [001] ....  3156.268378: foo_with_template_print: bar I have to be different 1564
 event-sample-fn-590   [001] ....  3156.844374: foo_bar_with_fn: foo Look at me 6
 event-sample-fn-590   [001] ....  3156.844376: foo_with_template_fn: foo Look at me too 6
    event-sample-569   [001] ....  3157.292375: foo_bar: foo hello 1565 0x61d BIT1|BIT3|BIT4|0x610 {} Mother Goose (00000000,0000000f)
    event-sample-569   [001] ....  3157.292377: foo_with_template_simple: foo HELLO 1565
    event-sample-569   [001] ....  3157.292378: foo_with_template_print: bar I have to be different 1565
 event-sample-fn-590   [001] ....  3157.868374: foo_bar_with_fn: foo Look at me 7
 event-sample-fn-590   [001] ....  3157.868376: foo_with_template_fn: foo Look at me too 7
    event-sample-569   [001] ....  3158.316374: foo_bar: foo hello 1566 0x61e BIT2|BIT3|BIT4|0x610 {0x1} Snoopy (00000000,0000000f)
    event-sample-569   [001] ....  3158.316376: foo_with_template_simple: foo HELLO 1566
    event-sample-569   [001] ....  3158.316377: foo_with_template_print: bar I have to be different 1566
 event-sample-fn-590   [001] ....  3158.892376: foo_bar_with_fn: foo Look at me 8
 event-sample-fn-590   [001] ....  3158.892377: foo_with_template_fn: foo Look at me too 8
    event-sample-569   [001] ....  3159.340374: foo_bar: foo hello 1567 0x61f BIT1|BIT2|BIT3|BIT4|0x610 {0x1,0x2} Gandalf (00000000,0000000f)
    event-sample-569   [001] ....  3159.340376: foo_with_template_simple: foo HELLO 1567
    event-sample-569   [001] ....  3159.340377: foo_with_template_print: bar I have to be different 1567
 event-sample-fn-590   [001] ....  3159.916373: foo_bar_with_fn: foo Look at me 9
 event-sample-fn-590   [001] ....  3159.916374: foo_with_template_fn: foo Look at me too 9
    event-sample-569   [001] ....  3160.364374: foo_bar: foo hello 1568 0x620 0x620 {0x1,0x2,0x3} Frodo (00000000,0000000f)
    event-sample-569   [001] ....  3160.364376: foo_with_template_simple: foo HELLO 1568
    event-sample-569   [001] ....  3160.364378: foo_with_template_cond: foo prints other times 1568
    event-sample-569   [001] ....  3160.364379: foo_with_template_print: bar I have to be different 1568
 event-sample-fn-590   [001] ....  3160.940374: foo_bar_with_fn: foo Look at me 10
 event-sample-fn-590   [001] ....  3160.940376: foo_with_template_fn: foo Look at me too 10
    event-sample-569   [001] ....  3161.388374: foo_bar: foo hello 1569 0x621 BIT1|0x620 {0x1,0x2,0x3,0x4} One ring to rule them all (00000000,0000000f)
    event-sample-569   [001] ....  3161.388378: foo_with_template_simple: foo HELLO 1569
    event-sample-569   [001] ....  3161.388379: foo_with_template_print: bar I have to be different 1569
 event-sample-fn-590   [001] ....  3161.964374: foo_bar_with_fn: foo Look at me 11
 event-sample-fn-590   [001] ....  3161.964376: foo_with_template_fn: foo Look at me too 11
    event-sample-569   [001] ....  3162.412375: foo_bar: foo hello 1570 0x622 BIT2|0x620 {} Mother Goose (00000000,0000000f)
    event-sample-569   [001] ....  3162.412377: foo_with_template_simple: foo HELLO 1570
    event-sample-569   [001] ....  3162.412378: foo_bar_with_cond: foo Some times print 1570
    event-sample-569   [001] ....  3162.412379: foo_with_template_print: bar I have to be different 1570
 event-sample-fn-590   [001] ....  3162.988374: foo_bar_with_fn: foo Look at me 12
 event-sample-fn-590   [001] ....  3162.988376: foo_with_template_fn: foo Look at me too 12
    event-sample-569   [001] ....  3163.436373: foo_bar: foo hello 1571 0x623 BIT1|BIT2|0x620 {0x1} Snoopy (00000000,0000000f)
    event-sample-569   [001] ....  3163.436375: foo_with_template_simple: foo HELLO 1571
    event-sample-569   [001] ....  3163.436376: foo_with_template_print: bar I have to be different 1571
 event-sample-fn-590   [001] ....  3164.012376: foo_bar_with_fn: foo Look at me 13
 event-sample-fn-590   [001] ....  3164.012377: foo_with_template_fn: foo Look at me too 13
    event-sample-569   [001] ....  3164.460374: foo_bar: foo hello 1572 0x624 BIT3|0x620 {0x1,0x2} Gandalf (00000000,0000000f)
    event-sample-569   [001] ....  3164.460376: foo_with_template_simple: foo HELLO 1572
    event-sample-569   [001] ....  3164.460377: foo_with_template_print: bar I have to be different 1572
 event-sample-fn-590   [001] ....  3165.036374: foo_bar_with_fn: foo Look at me 14
 event-sample-fn-590   [001] ....  3165.036376: foo_with_template_fn: foo Look at me too 14
    event-sample-569   [001] ....  3165.484374: foo_bar: foo hello 1573 0x625 BIT1|BIT3|0x620 {0x1,0x2,0x3} Frodo (00000000,0000000f)
    event-sample-569   [001] ....  3165.484376: foo_with_template_simple: foo HELLO 1573
    event-sample-569   [001] ....  3165.484377: foo_with_template_print: bar I have to be different 1573
 event-sample-fn-590   [001] ....  3166.060375: foo_bar_with_fn: foo Look at me 15
 event-sample-fn-590   [001] ....  3166.060377: foo_with_template_fn: foo Look at me too 15
    event-sample-569   [001] ....  3166.508374: foo_bar: foo hello 1574 0x626 BIT2|BIT3|0x620 {0x1,0x2,0x3,0x4} One ring to rule them all (00000000,0000000f)
    event-sample-569   [001] ....  3166.508377: foo_with_template_simple: foo HELLO 1574
    event-sample-569   [001] ....  3166.508378: foo_with_template_print: bar I have to be different 1574
 event-sample-fn-590   [001] ....  3167.084374: foo_bar_with_fn: foo Look at me 16
 event-sample-fn-590   [001] ....  3167.084376: foo_with_template_fn: foo Look at me too 16
    event-sample-569   [001] ....  3167.532374: foo_bar: foo hello 1575 0x627 BIT1|BIT2|BIT3|0x620 {} Mother Goose (00000000,0000000f)
    event-sample-569   [001] ....  3167.532376: foo_with_template_simple: foo HELLO 1575
    event-sample-569   [001] ....  3167.532377: foo_with_template_print: bar I have to be different 1575
 event-sample-fn-590   [001] ....  3168.108374: foo_bar_with_fn: foo Look at me 17
 event-sample-fn-590   [001] ....  3168.108376: foo_with_template_fn: foo Look at me too 17
    event-sample-569   [001] ....  3168.556374: foo_bar: foo hello 1576 0x628 BIT4|0x620 {0x1} Snoopy (00000000,0000000f)
    event-sample-569   [001] ....  3168.556376: foo_with_template_simple: foo HELLO 1576
    event-sample-569   [001] ....  3168.556378: foo_with_template_cond: foo prints other times 1576
    event-sample-569   [001] ....  3168.556379: foo_with_template_print: bar I have to be different 1576
 event-sample-fn-590   [001] ....  3169.132374: foo_bar_with_fn: foo Look at me 18
 event-sample-fn-590   [001] ....  3169.132376: foo_with_template_fn: foo Look at me too 18
    event-sample-569   [001] ....  3169.580374: foo_bar: foo hello 1577 0x629 BIT1|BIT4|0x620 {0x1,0x2} Gandalf (00000000,0000000f)
    event-sample-569   [001] ....  3169.580376: foo_with_template_simple: foo HELLO 1577
    event-sample-569   [001] ....  3169.580377: foo_with_template_print: bar I have to be different 1577
#
再例如跟踪sched_stat_runtime 变量
# cat available_events | grep runtime
sched:sched_stat_runtime
# echo sched:sched_stat_runtime > set_event
# echo 1 > tracing_on
# cat trace
# tracer: nop
#
# entries-in-buffer/entries-written: 29441/32561   #P:4
#
#                              _-----=> irqs-off
#                             / _----=> need-resched
#                            | / _---=> hardirq/softirq
#                            || / _--=> preempt-depth
#                            ||| /     delay
#           TASK-PID   CPU#  ||||    TIMESTAMP  FUNCTION
#              | |       |   ||||       |         |
     rcu_preempt-8     [003] d..2   217.167356: sched_stat_runtime: comm=rcu_preempt pid=8 runtime=9762 [ns] vruntime=1422117555 [ns]
     rcu_preempt-8     [003] d..2   217.171343: sched_stat_runtime: comm=rcu_preempt pid=8 runtime=17555 [ns] vruntime=1422135110 [ns]
     rcu_preempt-8     [003] d..2   217.175348: sched_stat_runtime: comm=rcu_preempt pid=8 runtime=19810 [ns] vruntime=1422154920 [ns]
     rcu_preempt-8     [003] d..2   217.179339: sched_stat_runtime: comm=rcu_preempt pid=8 runtime=14350 [ns] vruntime=1422169270 [ns]
##### CPU 1 buffer started ####
     kworker/1:1-31    [001] d..2   217.196369: sched_stat_runtime: comm=kworker/1:1 pid=31 runtime=15667 [ns] vruntime=1537289642 [ns]
            bopt-509   [003] d..2   217.260343: sched_stat_runtime: comm=bopt pid=509 runtime=13825 [ns] vruntime=1422096379 [ns]
     kworker/3:1-33    [003] d..2   217.324548: sched_stat_runtime: comm=kworker/3:1 pid=33 runtime=219254 [ns] vruntime=1431301808 [ns]
     kworker/3:1-33    [003] d..2   217.668348: sched_stat_runtime: comm=kworker/3:1 pid=33 runtime=17381 [ns] vruntime=1431319189 [ns]
     rcu_preempt-8     [003] d..2   218.123339: sched_stat_runtime: comm=rcu_preempt pid=8 runtime=8715 [ns] vruntime=1422327904 [ns]
     rcu_preempt-8     [003] d..2   218.127348: sched_stat_runtime: comm=rcu_preempt pid=8 runtime=19825 [ns] vruntime=1422347729 [ns]
     rcu_preempt-8     [003] d..2   218.131337: sched_stat_runtime: comm=rcu_preempt pid=8 runtime=14047 [ns] vruntime=1422361776 [ns]
     kworker/3:1-33    [003] d..2   218.172347: sched_stat_runtime: comm=kworker/3:1 pid=33 runtime=16318 [ns] vruntime=1431335507 [ns]
     kworker/3:1-33    [003] d..2   218.348547: sched_stat_runtime: comm=kworker/3:1 pid=33 runtime=217936 [ns] vruntime=1431553443 [ns]
     kworker/3:1-33    [003] d..2   218.676347: sched_stat_runtime: comm=kworker/3:1 pid=33 runtime=16667 [ns] vruntime=1431570110 [ns]
     rcu_preempt-8     [003] d..2   219.147340: sched_stat_runtime: comm=rcu_preempt pid=8 runtime=8619 [ns] vruntime=1422578729 [ns]
     rcu_preempt-8     [003] d..2   219.151346: sched_stat_runtime: comm=rcu_preempt pid=8 runtime=19698 [ns] vruntime=1422598427 [ns]
     rcu_preempt-8     [003] d..2   219.155339: sched_stat_runtime: comm=rcu_preempt pid=8 runtime=14333 [ns] vruntime=1422612760 [ns]
     kworker/3:1-33    [003] d..2   219.180346: sched_stat_runtime: comm=kworker/3:1 pid=33 runtime=16413 [ns] vruntime=1431586523 [ns]
            bopt-509   [003] d..2   219.308342: sched_stat_runtime: comm=bopt pid=509 runtime=13730 [ns] vruntime=1422600253 [ns]
     kworker/3:1-33    [003] d..2   219.372547: sched_stat_runtime: comm=kworker/3:1 pid=33 runtime=218064 [ns] vruntime=1431804587 [ns]
     kworker/3:1-33    [003] d..2   219.684347: sched_stat_runtime: comm=kworker/3:1 pid=33 runtime=16635 [ns] vruntime=1431821222 [ns]
     kworker/3:1-33    [003] d..2   220.188346: sched_stat_runtime: comm=kworker/3:1 pid=33 runtime=16286 [ns] vruntime=1431837508 [ns]
     kworker/1:1-31    [001] d..2   220.204360: sched_stat_runtime: comm=kworker/1:1 pid=31 runtime=24096 [ns] vruntime=1537313738 [ns]
     kworker/3:1-33    [003] d..2   220.396546: sched_stat_runtime: comm=kworker/3:1 pid=33 runtime=217572 [ns] vruntime=1432055080 [ns]
           gmain-431   [001] d..2   220.465410: sched_stat_runtime: comm=gmain pid=431 runtime=47619 [ns] vruntime=15225153 [ns]
     kworker/3:1-33    [003] d..2   220.692347: sched_stat_runtime: comm=kworker/3:1 pid=33 runtime=16635 [ns] vruntime=1432071715 [ns]
     kworker/3:1-33    [003] d..2   221.196347: sched_stat_runtime: comm=kworker/3:1 pid=33 runtime=16413 [ns] vruntime=1432088128 [ns]
            bopt-509   [003] d..2   221.356342: sched_stat_runtime: comm=bopt pid=509 runtime=13477 [ns] vruntime=1423101605 [ns]
     kworker/3:1-33    [003] d..2   221.420547: sched_stat_runtime: comm=kworker/3:1 pid=33 runtime=217968 [ns] vruntime=1432306096 [ns]
     kworker/3:1-33    [003] d..2   221.700347: sched_stat_runtime: comm=kworker/3:1 pid=33 runtime=16413 [ns] vruntime=1432322509 [ns]
        watchdog-538   [001] d..2   221.869641: sched_stat_runtime: comm=watchdog pid=538 runtime=12714 [ns] vruntime=18446744073709332504 [ns]
     rcu_preempt-8     [003] d..2   222.097340: sched_stat_runtime: comm=rcu_preempt pid=8 runtime=8651 [ns] vruntime=1423331160 [ns]
2.7 自定义添加trace point
参照 linux-4.14/samples/trace_events/trace-events-sample.c 示例


 1862
1862


 被折叠的 条评论
为什么被折叠?
被折叠的 条评论
为什么被折叠?
 到【灌水乐园】发言


