QCustomPlot 使用——绘制折线图

    //初始化数据
    QVector<double> temp;
    for (int var = 0; var < 25; ++var) {
        if (rand()%2) {
            temp.append(var);
        }else{
            temp.append(20);
        }
    }
    QVector<double>time;
    for (int var = 0; var < 25; ++var) {
        time.append(var);
    }
    //设置坐标轴的范围
    ui->CustomPlot->xAxis->setRange(0,24);
    ui->CustomPlot->yAxis->setRange(0,40);
     //添加图层,填充数据
    ui->CustomPlot->addGraph(0)->setName("Temp/Time");
    ui->CustomPlot->graph(0)->setData(time,temp);
    QPen pen(Qt::green, 3, Qt::DashDotLine, Qt::RoundCap, Qt::RoundJoin);
    ui->CustomPlot->graph(0)->setPen(pen);

对QCustomPlot的认识
QCustomPlot是一个核心类,需要在另外添加一些属性类,即可完成目标图表的绘制。
Overview of most important classes and their relations
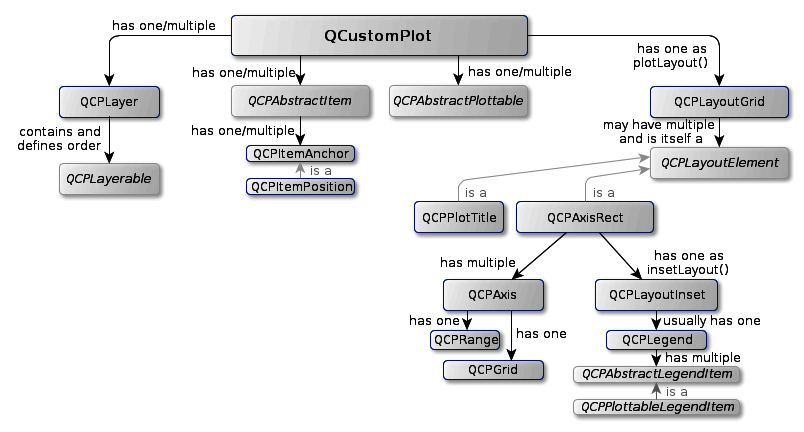
一个QCustomPlot类有一些属性。
1. 四个轴,正常情况下只出现两个轴,xAxis和yAxis。
2. 取出任意的一种轴进行说明。
3. Naming convention of axis parts
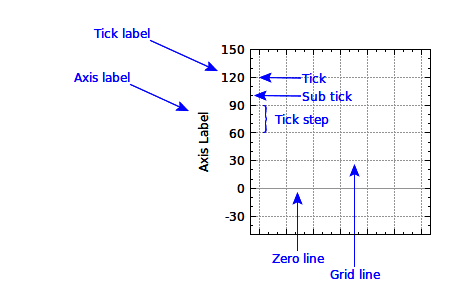
4. 轴(axis)和刻度(tick),然后轴和刻度又有各自的属性。通过操作这些属性即可完成一些目标的功能实现。
5. 以下是一些功能的实现函数
6.

    yAxis->setTickLabelColor(QColor("red"));
    yAxis->setAutoTickStep(false);//设置轴的刻度“跳跃”显示,默认为true
//    AxisType 设置轴出现的位置,上,下,左,右
    yAxis->setAutoTickLabels(true);
    yAxis->setTickLabelType(QCPAxis::ltDateTime);//设置轴刻度的显示类型,一种为数字,一种为时间。设置后可以设置数据显示的格式化。
    yAxis->setNumberFormat("hello");//一个有五种格式化方法,分别有其不同的作用,但是最后一种“hello”的没有看错效果。
    yAxis->setDateTimeFormat("hh:mm:ss");
    yAxis->setTickLabelSide(QCPAxis::lsOutside);//设置轴刻度显示的方面,选项为in或者out
    yAxis->setTickLabelPadding();//设置轴刻度与轴之间的距离
    yAxis->setTickLabelRotation(40);//设置轴刻度的显示方向为倾斜向下
    yAxis->setTickLabels(false);//设置轴刻度是否显示
    yAxis->setTickLength(20,0); //设置轴刻度的长度

    yAxis->setTickStep(1);
    yAxis->setAutoTickStep(false);//设置轴刻度的一跳为1


//    默认类型刻度类型为线性类型
    ui->CustomPlot->yAxis->setScaleType(QCPAxis::stLogarithmic);
    ui->CustomPlot->yAxis->setScaleType(QCPAxis::stLinear);
  //设置不显示子刻度
    yAxis->setSubTickLength(0);
//checkBox控件置顶层
    ui->checkBox->raise();
void mainWidget::on_checkBox_clicked(bool checked)
{
    qDebug() << checked;
    if (checked) {
        ui->CustomPlot->setInteractions(QCP::iRangeDrag | QCP::iRangeZoom );
    } else {
        ui->CustomPlot->setInteraction(QCP::iRangeDrag,false);//一个鼠标拖拽
        ui->CustomPlot->setInteraction(QCP::iRangeZoom,false);//一个滚轮缩放
    }
}

待更。。。

要在Qt中使用QCustomPlot库来绘制折线图并显示数据,你可以按照以下步骤进行操作: 1. 首先,你需要从官方网站下载QCustomPlot库。你可以在中找到官方下载地址。 2. 下载完成后,将qcustomplot.cpp和qcustomplot.h这两个文件添加到你的Qt项目中。你可以直接将这两个文件拷贝到你的项目文件夹中,或者将它们作为已有的文件添加到你的项目中。 3. 然后,在你的Qt项目中包含QCustomPlot头文件。你可以通过在你的代码中添加以下语句来实现: ```cpp #include "qcustomplot.h" ``` 4. 在你的Qt窗口中创建一个QWidget控件,并将其提升为QCustomPlot。这可以通过在Qt设计师中选择该控件并在属性编辑器中选择QCustomPlot来实现。 5. 在代码中,你可以使用QCustomPlot的函数来配置和绘制折线图。你可以使用以下函数来添加数据和绘制折线图: ```cpp QVector<double> xData, yData; // 定义用于存储x和y坐标数据的向量 // 添加数据 xData << 1 << 2 << 3 << 4 << 5; // 假设x坐标数据为1, 2, 3, 4, 5 yData << 10 << 20 << 30 << 40 << 50; // 假设y坐标数据为10, 20, 30, 40, 50 // 创建图表 QCustomPlot *customPlot = new QCustomPlot(this); customPlot->addGraph(); // 添加一个图表 // 设置x和y坐标数据 customPlot->graph(0)->setData(xData, yData); // 设置x和y坐标轴标签 customPlot->xAxis->setLabel("X"); customPlot->yAxis->setLabel("Y"); // 根据数据自动缩放坐标轴范围 customPlot->rescaleAxes(); // 绘制图表 customPlot->replot(); ``` 通过以上步骤,你可以在你的Qt应用程序中使用QCustomPlot绘制折线图并显示数据。希望对你有所帮助!<span class="em">1</span><span class="em">2</span><span class="em">3</span> #### 引用[.reference_title] - *1* [QT——如何使用QCustomPlot绘制折线图](https://blog.csdn.net/UNDEFINED_AUBE/article/details/108223073)[target="_blank" data-report-click={"spm":"1018.2226.3001.9630","extra":{"utm_source":"vip_chatgpt_common_search_pc_result","utm_medium":"distribute.pc_search_result.none-task-cask-2~all~insert_cask~default-1-null.142^v93^chatsearchT3_2"}}] [.reference_item style="max-width: 50%"] - *2* *3* [Qt - QCustomPlot折线图](https://blog.csdn.net/weixin_40774605/article/details/115312518)[target="_blank" data-report-click={"spm":"1018.2226.3001.9630","extra":{"utm_source":"vip_chatgpt_common_search_pc_result","utm_medium":"distribute.pc_search_result.none-task-cask-2~all~insert_cask~default-1-null.142^v93^chatsearchT3_2"}}] [.reference_item style="max-width: 50%"] [ .reference_list ]
评论 1
添加红包

请填写红包祝福语或标题

红包个数最小为10个

红包金额最低5元

当前余额3.43前往充值 >
需支付:10.00
成就一亿技术人!
领取后你会自动成为博主和红包主的粉丝 规则
hope_wisdom
发出的红包
实付
使用余额支付
点击重新获取
扫码支付
钱包余额 0

抵扣说明:

1.余额是钱包充值的虚拟货币,按照1:1的比例进行支付金额的抵扣。
2.余额无法直接购买下载,可以购买VIP、付费专栏及课程。

余额充值