


第一刀 给数据源赋值格式
饼状图 new DefaultPieDataset('名称',值)
树状图(new DefaultCategoryDataset(值,x,y))
折线图(new DefaultCategoryDataset(值,类别,x))
时序图(new TimeSeries (Day,值))
第二刀 生成Jfreechart 对象
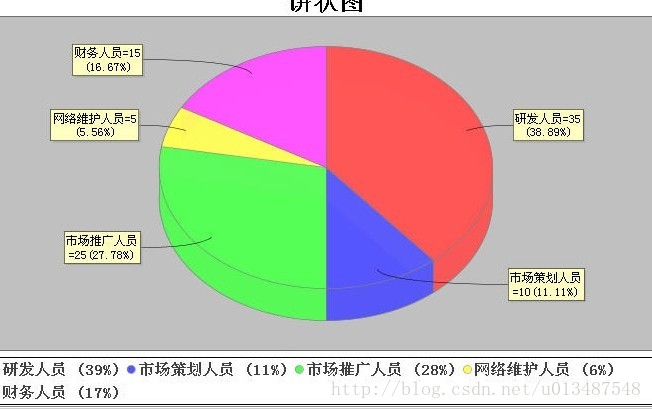
==================饼图========================
public JFreeChart getCakeChart(List<Object[]> lists) {
JFreeChart chart = null;
DefaultPieDataset dataset = new DefaultPieDataset();
for (Object[] o : lists) {
dataset.setValue(o[1].toString(), Double.valueOf(o[2]+""));
}
//String title = "客户贡献分析";
// 获得数据集
// 利用chart工厂创建一个jfreechart实例
chart = ChartFactory.createPieChart3D("", // 图表标题
dataset, // 图表数据集
true, // 是否显示图例
false, // 是否生成工具(提示)
false // 是否生成URL链接
);
// 设置pieChart的标题与字体
/* Font font = new Font("宋体", Font.BOLD, 25);
TextTitle textTitle = new TextTitle(title);
textTitle.setFont(font);
chart.setTitle(textTitle);
chart.setTextAntiAlias(false);*/
// 设置背景色
chart.setBackgroundPaint(new Color(255, 255, 255));
// 设置图例字体
LegendTitle legend = chart.getLegend(0);
legend.setItemFont(new Font("宋体", 1, 15));
// 设置标签字体
PiePlot plot = (PiePlot) chart.getPlot();
plot.setLabelFont(new Font("宋体", Font.TRUETYPE_FONT, 12));
// 指定图片的透明度(0.0-1.0)
plot.setForegroundAlpha(0.95f);
// 图片中显示百分比:自定义方式,{0} 表示选项, {1} 表示数值, {2} 表示所占比例 ,小数点后两位
plot.setLabelGenerator(new StandardPieSectionLabelGenerator(
"{0}={1}({2})", NumberFormat.getNumberInstance(),
new DecimalFormat("0.00%")));
// 图例显示百分比:自定义方式, {0} 表示选项, {1} 表示数值, {2} 表示所占比例
plot.setLegendLabelGenerator(new StandardPieSectionLabelGenerator(
"{0} ({2})"));
// 设置第一个饼块截面开始的位置,默认是12点钟方向
plot.setStartAngle(90);
return chart;
}
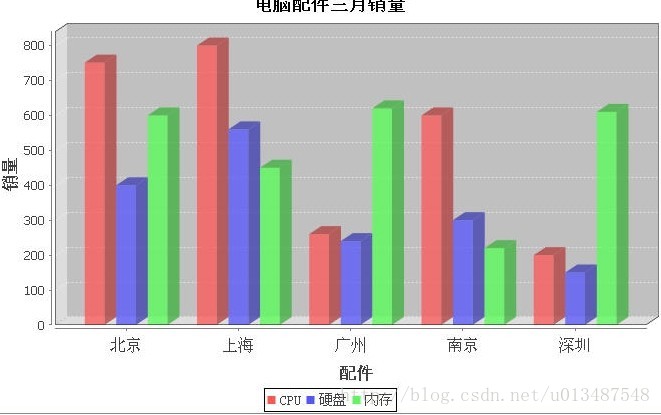
==================树========================
public JFreeChart getTreeChart(List<Object[]> lists) {
JFreeChart chart = null;
DefaultCategoryDataset dataset = new DefaultCategoryDataset();
for (Object[] o : lists) {
dataset.setValue(Double.valueOf(o[2]+""),o[1].toString(), o[1].toString());
}
//创建主题样式
StandardChartTheme standardChartTheme=new StandardChartTheme("CN");
//设置标题字体
standardChartTheme.setExtraLargeFont(new Font("隶书",Font.BOLD,20));
//设置图例的字体
standardChartTheme.setRegularFont(new Font("宋书",Font.PLAIN,15));
//设置轴向的字体
standardChartTheme.setLargeFont(new Font("宋书",Font.PLAIN,15));
//应用主题样式
ChartFactory.setChartTheme(standardChartTheme);
//chart = ChartFactory.createBarChart("hi", "人员分布", "人员数量", dataset,
chart = ChartFactory.createBarChart("", "", "", dataset,
PlotOrientation.VERTICAL, true, true, false); // 创建一个JFreeChart
/*chart.setTitle(new TextTitle("某公司组织结构图", new Font("宋体", Font.BOLD
+ Font.ITALIC, 20)));// 可以重新设置标题,替换“hi”标题
*/ // 获得plot(此对象通常用于绘制图表区域属性)
CategoryPlot plot = chart.getCategoryPlot();
// Axis对象通常用于设置X轴
CategoryAxis axis = plot.getDomainAxis();
// axis.setCategoryLabelPositions(CategoryLabelPositions.UP_90);
axis.setCategoryLabelPositions(CategoryLabelPositions.UP_45);
// 设置图表区域属性
plot.setBackgroundPaint(Color.LIGHT_GRAY);
plot.setRangeGridlinePaint(Color.white);
plot.setDomainGridlinePaint(Color.white);
plot.setDomainGridlinesVisible(true);
return chart;
}
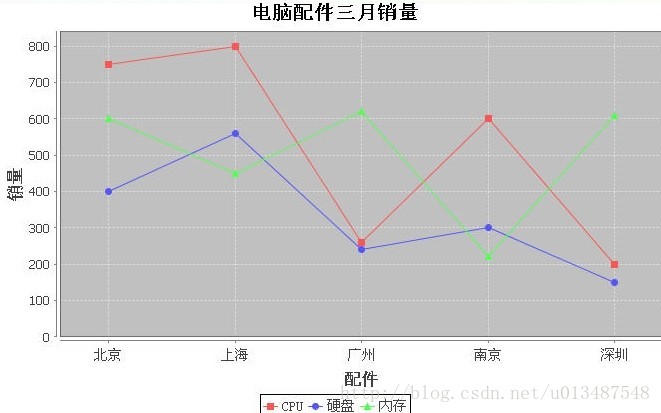
==================折线========================
public JFreeChart getLineChart(List<Object[]> lists) {
JFreeChart chart = null;
DefaultCategoryDataset dataset = new DefaultCategoryDataset();
for (Object[] o : lists) {
dataset.setValue(Double.valueOf(o[2]+""),"1.0", o[1].toString());
}
chart = ChartFactory.createLineChart("", // 图表标题
"", // 目录轴的显示标签
"", // 数值轴的显示标签
dataset, // 数据集
PlotOrientation.VERTICAL, // 图表方向:水平、垂直
true, // 是否显示图例
true, // 是否生成工具(提示)
false // 是否生成URL链接
);
chart.setTextAntiAlias(false);
// 设置背景色
chart.setBackgroundPaint(Color.WHITE);
// 设置图标题的字体
/* Font font = new Font("宋体", Font.BOLD, 20);
TextTitle textTitle = new TextTitle(title);
textTitle.setFont(font);
chart.setTitle(textTitle);*/
// 设置X轴Y轴的字体
Font labelFont = new Font("宋体", Font.BOLD, 16);
chart.setBackgroundPaint(Color.WHITE);
// 设置图例字体
LegendTitle legend = chart.getLegend(0);
legend.setItemFont(new Font("宋体", Font.TRUETYPE_FONT, 14));
// 获得plot
CategoryPlot categoryplot = (CategoryPlot) chart.getPlot();
// x轴 分类轴网格是否可见
categoryplot.setDomainGridlinesVisible(true);
// y轴 数据轴网格是否可见
categoryplot.setRangeGridlinesVisible(true);
// 虚线色彩
categoryplot.setRangeGridlinePaint(Color.WHITE);
// 虚线色彩
categoryplot.setDomainGridlinePaint(Color.WHITE);
// 设置背景色
categoryplot.setBackgroundPaint(Color.lightGray);
// 设置轴和面板之间的距离
CategoryAxis domainAxis = categoryplot.getDomainAxis();
// 设置横轴标签标题字体
domainAxis.setLabelFont(labelFont);
// 设置横轴数值标签字体
domainAxis.setTickLabelFont(new Font("宋体", Font.TRUETYPE_FONT, 14));
// 横轴上的
domainAxis.setCategoryLabelPositions(CategoryLabelPositions.STANDARD);
// 设置距离图片左端距离
domainAxis.setLowerMargin(0.0);
// 设置距离图片右端距离
domainAxis.setUpperMargin(0.0);
NumberAxis numberaxis = (NumberAxis) categoryplot.getRangeAxis();
// 设置纵轴显示标签的字体
numberaxis.setLabelFont(labelFont);
numberaxis.setStandardTickUnits(NumberAxis.createIntegerTickUnits());
numberaxis.setAutoRangeIncludesZero(true);
// 获得renderer
LineAndShapeRenderer lineandshaperenderer = (LineAndShapeRenderer) categoryplot
.getRenderer();
// series 点(即数据点)可见
lineandshaperenderer.setBaseShapesVisible(true);
// series 点(即数据点)间有连线可见
lineandshaperenderer.setBaseLinesVisible(true);
return chart;
}
==================时序图========================
public JFreeChart getBarChart(List<Object[]> lists) {
JFreeChart chart = null;
// 实例化TimeSeries对象
TimeSeries timeseries = new TimeSeries("时序图");
// 实例化Day
/*Day day = new Day();
day = (Day) day.next();
timeseries.add(day, 232);*/
for (Object[] o : lists) {
timeseries.add( Day.parseDay(o[3].toString()),Double.valueOf(o[2]+""));
}
// 创建TimeSeriesCollection集合对象
TimeSeriesCollection dataset = new TimeSeriesCollection(timeseries);
// 生成时序图
chart = ChartFactory.createTimeSeriesChart("",// 标题
"", // 时间轴标签
"", // 数据轴标签
dataset, // 数据集合
true, // 是否显示图例标识
true, // 是否显示tooltips
false); // 是否支持超链接
//String title = "上证指数时序图";
// 设置图例字体
LegendTitle legend = chart.getLegend(0);
legend.setItemFont(new Font("宋体", Font.TRUETYPE_FONT, 15));
// 设置标题字体
//Font font = new Font("宋体", Font.BOLD, 20);
//TextTitle textTitle = new TextTitle(title);
//textTitle.setFont(font);
//chart.setTitle(textTitle);
// Plot 对象的获取操作
XYPlot plot = chart.getXYPlot();
// X 轴对象的获取操作
DateAxis axis = (DateAxis) plot.getDomainAxis();
// 设置日期显示格式
axis.setDateFormatOverride(new SimpleDateFormat("MM-dd-yyyy"));
// 设置X轴标签字体
axis.setLabelFont(new Font("宋体", Font.BOLD, 14));
// Y 轴对象的获取操作
NumberAxis numAxis = (NumberAxis) plot.getRangeAxis();
// 设置Y轴标签字体
numAxis.setLabelFont(new Font("宋体", Font.BOLD, 14));
return chart;
}
第三刀 显示chart
servlet显示
OutputStream out;
out = response.getOutputStream();
response.setContentType("image/png");
ChartUtilities.writeChartAsPNG(out, chart, 700, 400);
Structs2显示
<package name="lee" extends="jfreechart-default" namespace="/">
<action name="getMyChart" class="jfreeChartAction" method="getMyChart">
<result name="success" type="chart">
<param name="height">500</param>
<param name="width">800</param>
</result>
</action>
</package>
用到的插件包
jcommon-1.0.21.jar jfreechart-1.0.17.jar
action还需要 struts2-jfreechart-plugin-2.1.6.jar


 625
625

 被折叠的 条评论
为什么被折叠?
被折叠的 条评论
为什么被折叠?
 到【灌水乐园】发言


