


 本文介绍四个气象数据可视化平台,包括VENTUSKY、ESRI的windy.js、earth.js及gastonmz.com。这些平台使用不同的技术和数据格式,如epak、PNG瓦片和JSON,实现了气象数据的有效展示。
修改于2017/7/6
1.VENTUSKY
demo地址:https://www.ventusky.com
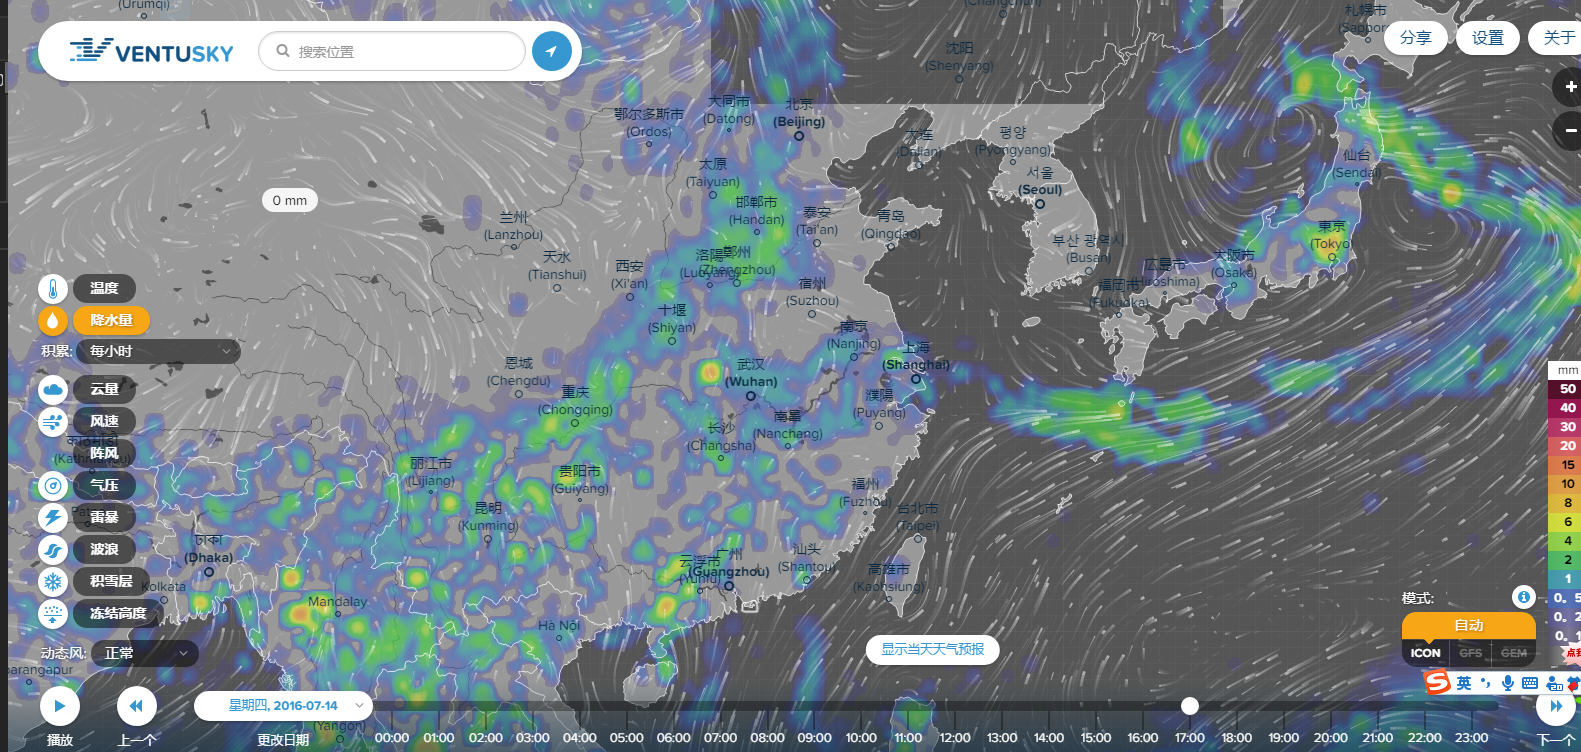
地图数据是png图片格式,非矢量,瓦片URL格式:https://www.ventusky.com/tiles/land/4/11/5.png
气象数据渲染的方式是后台传灰度图,前端根据颜色表来绘制颜色。
地图上鼠标移动可以实时查询信息,信息没有跟服务端交互,应该是前端通过灰度图直接读取信息数据。
地名信息点击查询的实现是通过后台取地名信息数据实现。
流线数据绘制方式应该和earth.js类似。
2.ESRI的windy.js
demo地址:http://esri.github.io/wind-js/
github地址:https://github.com/Esri/wind-js
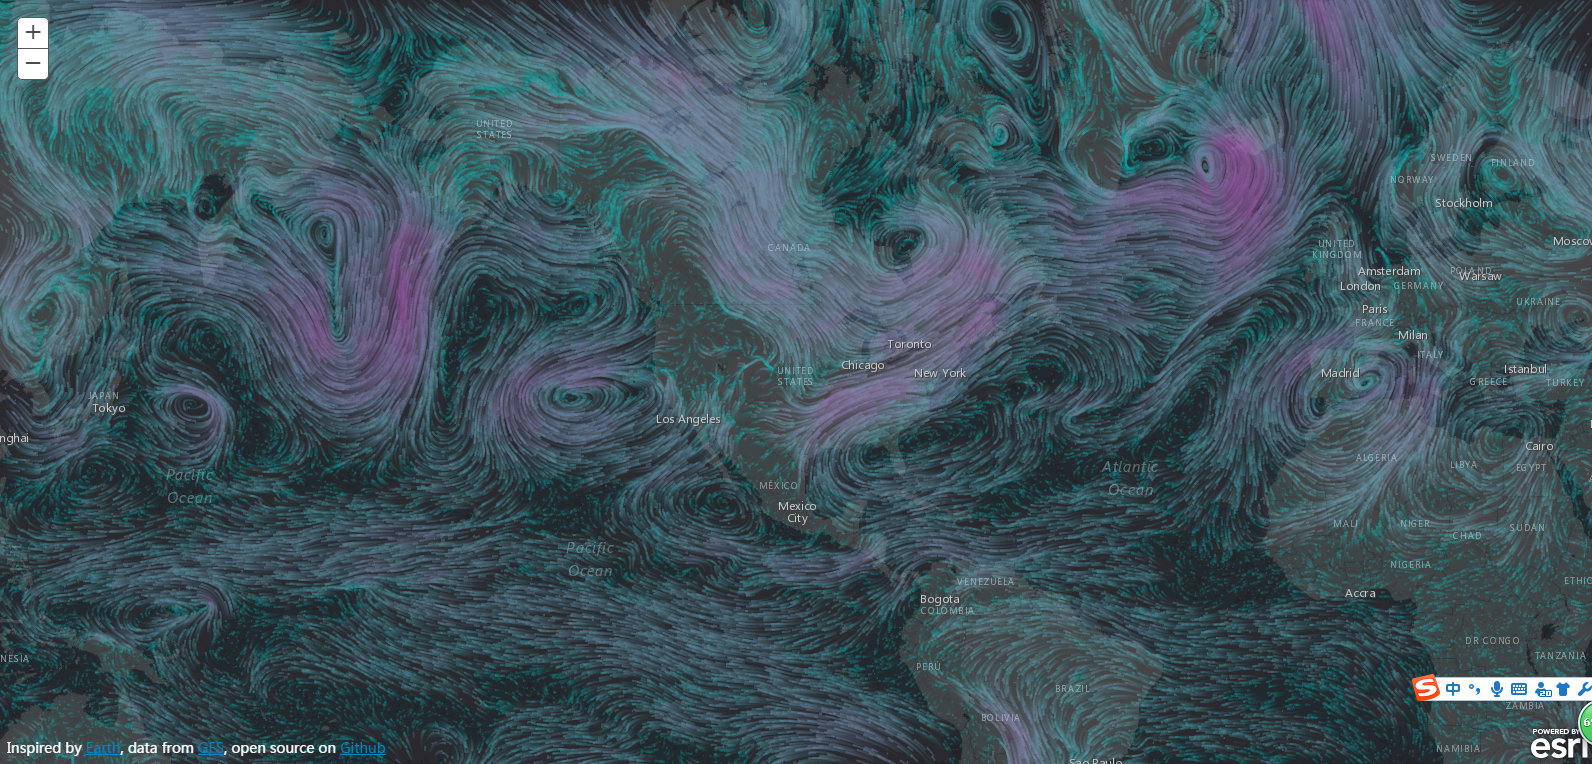
基本内容都是照搬earth.js的,地图框架是arcgis4js。
气象数据是通过将NOAA的GFS(Global Forecast System–全球预报系统)数据转换成JSON格式发送到前端进行渲染的。readme里面有转换的方法。
3.earth.js
demo地址:http://earth.nullschool.net/
GitHub地址:https://github.com/cambecc/earth
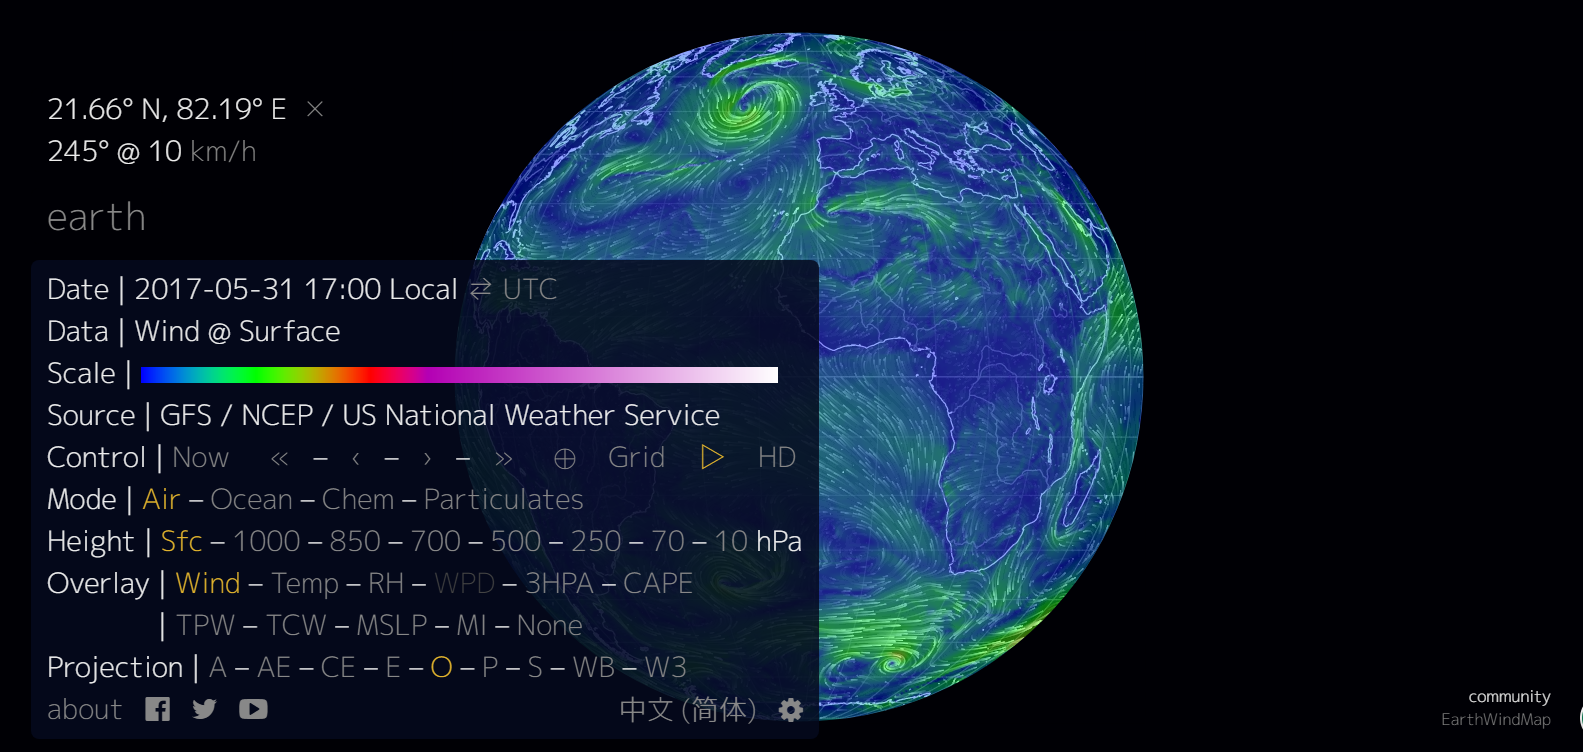
可以查询多种气象数据。
气象面数据用的是epak格式。
4.gastonmz.com
demo地址:http://gastonmz.com/cesium/ios/index.html?type=white
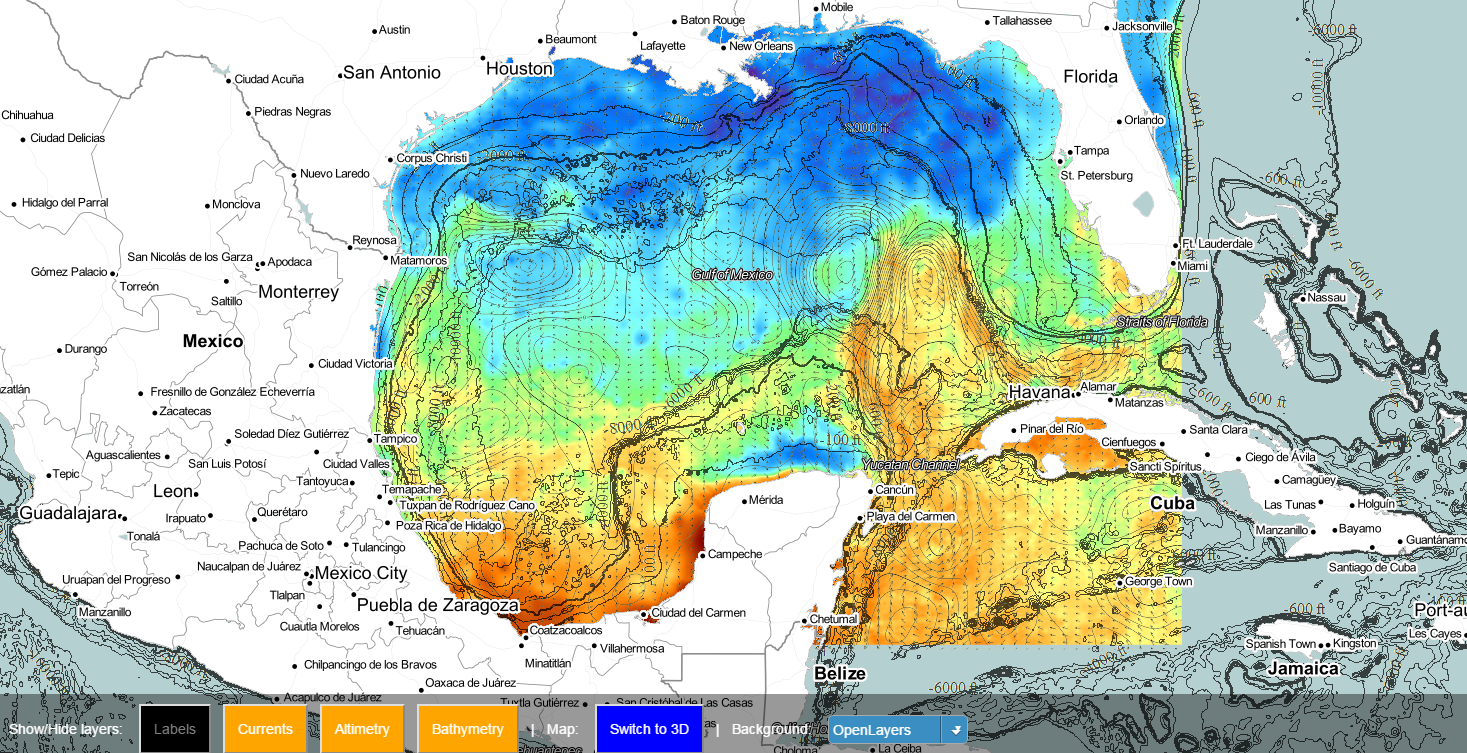
海图数据、流线等值线数据是采用栅格瓦片后台请求而来。
框架采用的ol-cesium。
海图瓦片格式为:https://www.ripcharts.com/SqlTileHandler.ashx?id=1195606&x=16&y=27&z=6&type=png
流线瓦片格式为:https://www.ripcharts.com/SqlTileHandler.ashx?id=1195670&x=128&y=219&z=9&type=png
地名瓦片格式为:https://www.ripcharts.com/SqlTileHandler.ashx?id=596783&x=15&y=27&z=6&type=png
等高线瓦片格式为:https://www.ripcharts.com/SqlTileHandler.ashx?id=1195450&x=16&y=28&z=6&type=png
等深线瓦片格式为:https://www.ripcharts.com/SqlTileHandler.ashx?id=376366&x=13&y=28&z=6&type=png


 5669
5669

 被折叠的 条评论
为什么被折叠?
被折叠的 条评论
为什么被折叠?
 到【灌水乐园】发言


