


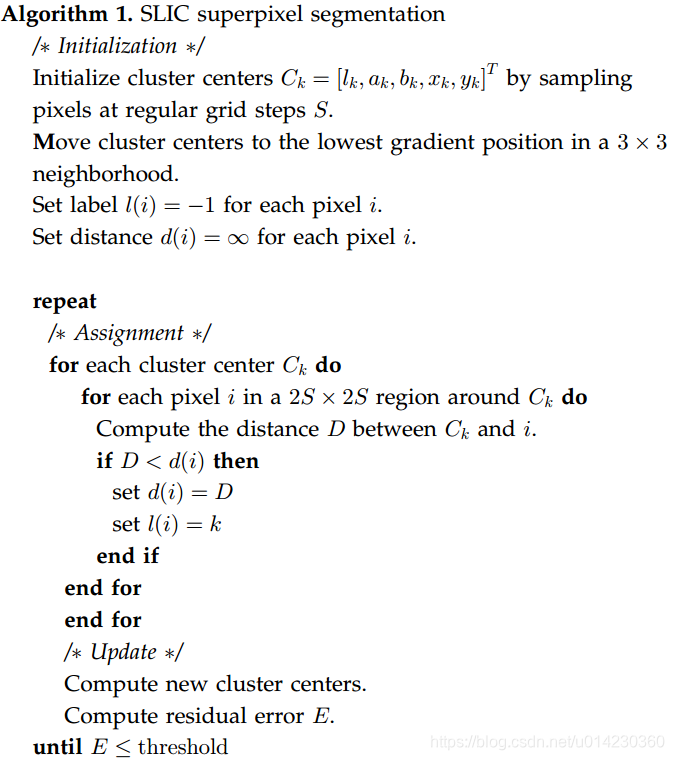
SLIC是一种基于网格化KMeans聚类的超像素分割算法,其计算复杂度为O(N),其中N为像素点个数。SLIC的原理比较简单精致,具体的原理我这里就不介绍了,推荐大家自己去读原始论文加深理解(但我以为看下面这个算法流程图就足够理解原理了)。SLIC的算法流程如下:
如所有其他聚类算法一样,SLIC不能保证连通性,所以需要后处理将旁生的连通域合并到邻近的主连通域上,但是论文中并未给出具体的后处理方法。我给出的方法是按照轮廓接触点个数最多原则合并连通域。由于每个聚类都有自己的“势力范围”,即每个标签覆盖的区域不会超过聚类时限定的范围(一般是2S*2S大小,边缘栅格的聚类例外),所以合并处理时只需要在该范围内操作即可。
下面给出本人实现的SLIC算法程序(控制色域与空域权重比例的系数wDs应设为函数形参,这里就不改了。注意!迭代中限定聚类的栅格是不变的!!!):
function Label=SLIC(img,s,errTh,wDs)
% 基于KMeans的超像素分割
% img为输入图像,维度不限,最大值为255
% s x s为超像素尺寸
% errTh为控制迭代结束的联合向量残差上限
m=size(img,1);
n=size(img,2);
%% 计算栅格顶点与中心的坐标
h=floor(m/s);
w=floor(n/s);
rowR=floor((m-h*s)/2); %多余部分首尾均分
colR=floor((n-w*s)/2);
rowStart=(rowR+1):s:(m-s+1);
rowStart(1)=1;
rowEnd=rowStart+s;
rowEnd(1)=rowR+s;
rowEnd(end)=m;
colStart=(colR+1):s:(n-s+1);
colStart(1)=1;
colEnd=colStart+s;
colEnd(1)=colR+s;
colEnd(end)=n;
rowC=floor((rowStart+rowEnd-1)/2);
colC=floor((colStart+colEnd-1)/2);
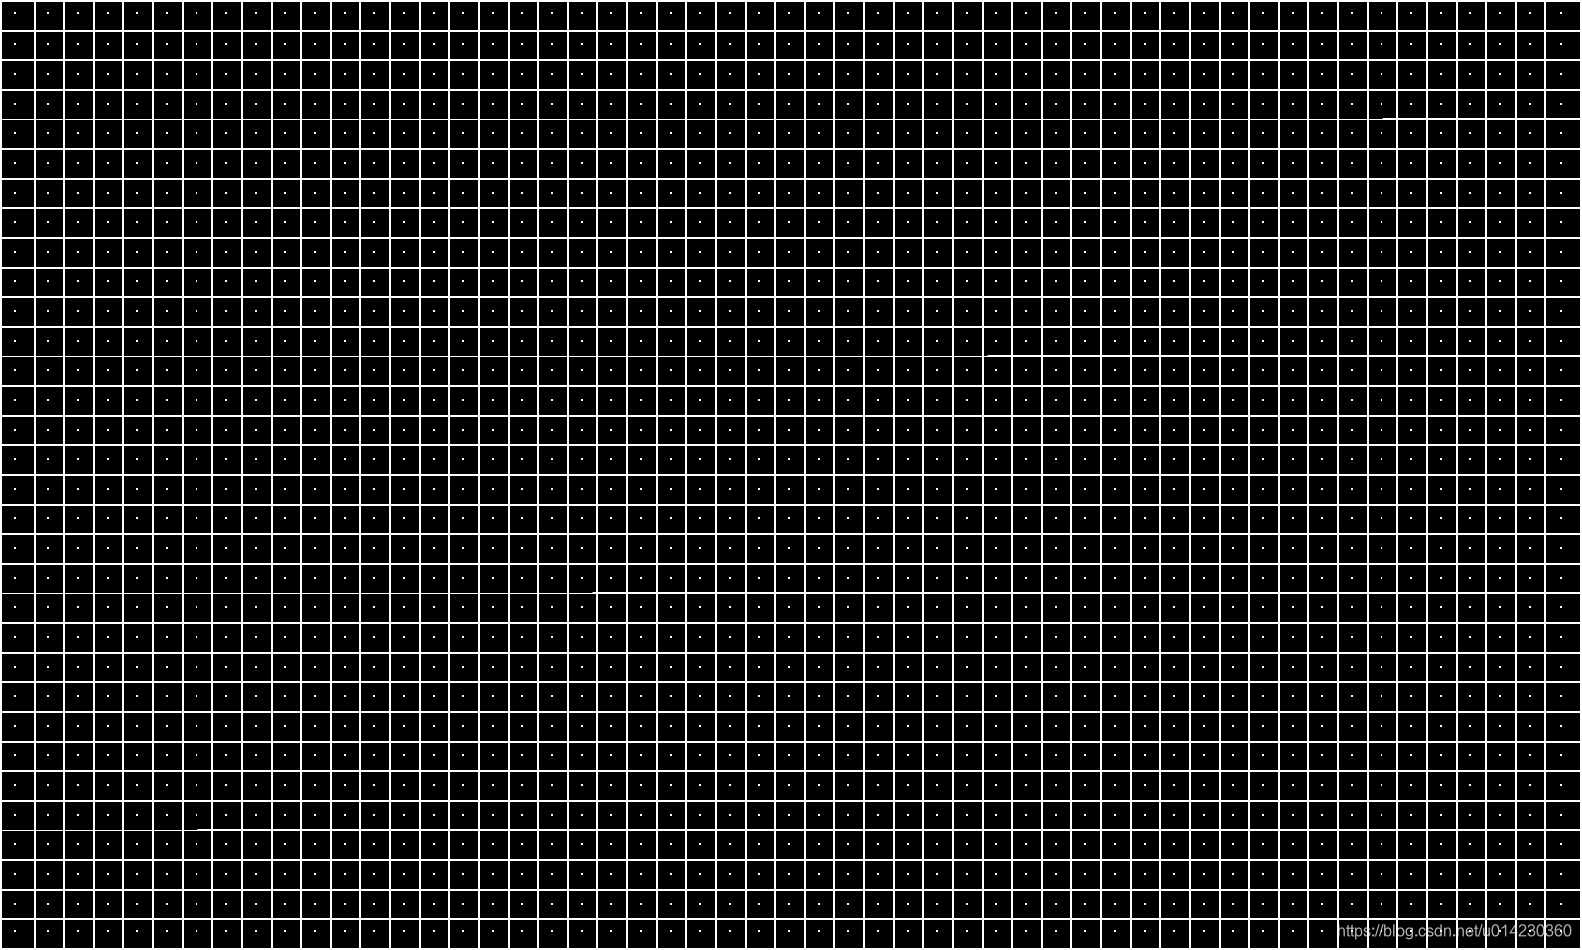
% 显示划分结果
temp=zeros(m,n);
temp(rowStart,:)=1;
temp(:,colStart)=1;
for i=1:h
for j=1:w
temp(rowC(i),colC(j))=1;
end
end
figure,imshow(temp);
imwrite(temp,'栅格.bmp');
%% 计算梯度图像,使用sobel算子和欧式距离
img=double(img)/255;
r=img(:,:,1);
g=img(:,:,2);
b=img(:,:,3);
Y=0.299 * r + 0.587 * g + 0.114 * b;
f1=fspecial('sobel');
f2=f1';
gx=imfilter(Y,f1);
gy=imfilter(Y,f2);
G=sqrt(gx.^2+gy.^2);
%% 选择栅格中心点3*3邻域中梯度最小点作为起始点
rowC_std=repmat(rowC',[1,w]);
colC_std=repmat(colC,[h,1]);
rowC=rowC_std;
colC=colC_std;
for i=1:h
for j=1:w
block=G(rowC(i,j)-1:rowC(i,j)+1,colC(i,j)-1:colC(i,j)+1);
[minVal,idxArr]=min(block(:));
jOffset=floor((idxArr(1)+2)/3);
iOffset=idxArr(1)-3*(jOffset-1);
rowC(i,j)=rowC(i,j)+iOffset;
colC(i,j)=colC(i,j)+jOffset;
end
end
%% KMeans超像素分割
Label=zeros(m,n)-1;
dis=Inf*ones(m,n);
M=reshape(img,m*n,size(img,3)); %像素值重排
% 联合色域值和空域值
colorC=zeros(h,w,size(img,3));
for i=1:h
for j=1:w
colorC(i,j,:)=img(rowC(i),colC(j),:);
end
end
uniMat=cat(3,colorC,rowC,colC);
uniMat=reshape(uniMat,h*w,size(img,3)+2);
iter=1;
while(1)
uniMat_old=uniMat;
% rowC_old=rowC;
% colC_old=colC;
for k=1:h*w
c=floor((k-1)/h)+1;
r=k-h*(c-1);
rowCidx=rowC(r,c);
colCidx=colC(r,c); %聚类中心坐标
%聚类限定的栅格(中心点始终是原s x s栅格的中心点)
rowStart=max(1,rowC_std(r,c)-s);
rowEnd=min(m,rowC_std(r,c)+s-1);
colStart=max(1,colC_std(r,c)-s);
colEnd=min(n,colC_std(r,c)+s);
% colorC=uniMat(k,1:size(img,3));
colorC=M((colCidx-1)*m+rowCidx,:);
for i=rowStart:rowEnd
for j=colStart:colEnd
colorCur=M((j-1)*m+i,:);
dc=norm(colorC-colorCur);
ds=norm([i-rowCidx,j-colCidx]);
d=dc^2+wDs*(ds/s)^2;
if d<dis(i,j)
dis(i,j)=d;
Label(i,j)=k;
end
end
end
end
%显示聚类结果
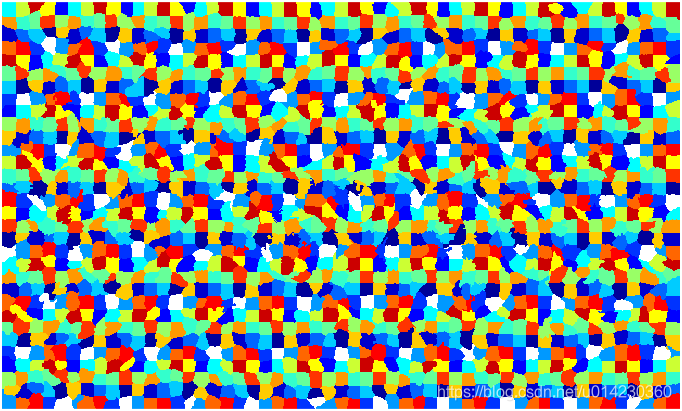
temp=mod(Label,20)+1;
figure;
imagesc(label2rgb(temp-1,'jet','w','shuffle')) ;
axis image ; axis off ;
% 录制gif
F=getframe(gcf);
I=frame2im(F);
[I,map]=rgb2ind(I,256);
if iter == 1
imwrite(I,map,'test.gif','gif','Loopcount',inf,'DelayTime',0.2);
else
imwrite(I,map,'test.gif','gif','WriteMode','append','DelayTime',0.2);
end
iter=iter+1;
% 更新聚类中心
colorC=zeros(h,w,size(img,3));
for k=1:h*w
num=0;
sumColor=zeros(1,size(img,3));
sumR=0;
sumC=0;
c=floor((k-1)/h)+1;
r=k-h*(c-1);
rowCidx=rowC_std(r,c);
colCidx=colC_std(r,c);
rowStart=max(1,rowCidx-s);
rowEnd=min(m,rowCidx+s-1);
colStart=max(1,colCidx-s);
colEnd=min(n,colCidx+s);
for row=rowStart:rowEnd
for col=colStart:colEnd
if Label(row,col)==k
num=num+1;
sumR=sumR+row;
sumC=sumC+col;
color=reshape(img(row,col,:),1,size(img,3));
sumColor=sumColor+color;
end
end
end
colorC(r,c,:)=sumColor/num;
rowC(r,c)=round(sumR/num);
colC(r,c)=round(sumC/num);
end
uniMat=cat(3,colorC,rowC,colC);
uniMat=reshape(uniMat,h*w,size(img,3)+2);
diff=uniMat-uniMat_old;
diff(:,1:2)=sqrt(wDs)*diff(:,1:2)/s;
err=norm(diff)/sqrt(h*w);
if err<errTh %残差低于阈值,结束迭代
break;
end
end
%% 后处理, 按照边界接触点数最多原则分配小连通域的标签
for k=1:h*w
c=floor((k-1)/h)+1;
r=k-h*(c-1);
rowCidx=rowC_std(r,c);
colCidx=colC_std(r,c);
rowStart=max(1,rowCidx-s);
rowEnd=min(m,rowCidx+s-1);
colStart=max(1,colCidx-s);
colEnd=min(n,colCidx+s);
block=Label(rowStart:rowEnd,colStart:colEnd);
block(block~=k)=0;
block(block==k)=1;
label=bwlabel(block);
szlabel=max(label(:)); %标签个数
bh=rowEnd-rowStart+1;
bw=colEnd-colStart+1; %block的宽高
if szlabel<2 %无伴生连通域,略过
continue;
end
labelC=label(rowCidx-rowStart+1,colCidx-colStart+1); %主连通域的标记值
top=max(1,rowStart-1);
bottom=min(m,rowEnd+1);
left=max(1,colStart-1);
right=min(n,colEnd+1);
for i=1:szlabel %遍历连通域
if i==labelC %主连通域不处理
continue;
end
marker=zeros(bottom-top+1,right-left+1); %生成一个外扩一圈的marker,标记哪些点已经被统计过接触情况
bw=label;
bw(bw~=i)=0;
bw(bw==i)=1; %当前连通域标记图
contourBW=bwperim(bw); %求取外轮廓
% figure,imshow(contourBW);
idxArr=find(double(contourBW)==1);
labelArr=zeros(4*length(idxArr),1); %记录轮廓点的4邻域点标记值的向量
num=0;
for idx=1:size(idxArr) %遍历轮廓点,统计其4邻域点的标记值
bc=floor((idxArr(idx)-1)/bh)+1;
br=idxArr(idx)-bh*(bc-1); %轮廓点在block中的行列信息
row=br+rowStart-1;
col=bc+colStart-1; %轮廓点在大图中的行列信息
rc=[row-1,col;...
row+1,col;...
row,col-1;...
row,col+1];
for p=1:4
row=rc(p,1);
col=rc(p,2);
if ~(row>=1 && row<=m && col>=1 && col<=n && Label(row,col)~=k)
continue;
end
if marker(row-top+1,col-left+1)==0 %未被统计过
marker(row-top+1,col-left+1)=1;
num=num+1;
labelArr(num)=Label(row,col);
end
end
end
labelArr(find(labelArr==0))=[]; %去除零元素
uniqueLabel=unique(labelArr);
numArr=zeros(length(uniqueLabel),1);
for p=1:length(uniqueLabel)
idx=find(labelArr==uniqueLabel(p));
numArr(p)=length(idx);
end
idx=find(numArr==max(numArr));
maxnumLabel=uniqueLabel(idx(1)); %接触最多的标签
for row=rowStart:rowEnd
for col=colStart:colEnd
if bw(row-rowStart+1,col-colStart+1)==0
continue;
end
Label(row,col)=maxnumLabel;
end
end
end
end
% 显示连通域处理后聚类结果
temp=mod(Label,20)+1;
figure;
imagesc(label2rgb(temp-1,'jet','w','shuffle')) ;
axis image ; axis off ;脚本文件:
close all;clc;
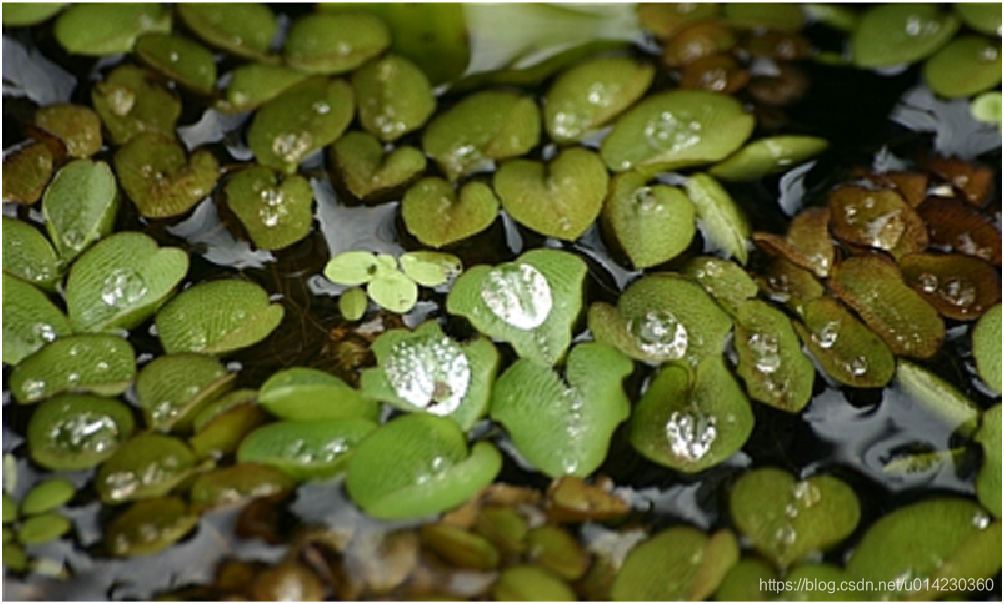
I=imread('1.jpg');
figure,imshow(I);
s=15;
errTh=10^-2;
wDs=0.5^2;
Label=SLIC(I,s,errTh,wDs);
%% 显示轮廓
marker=zeros(size(Label));
[m,n]=size(Label);
for i=1:m
for j=1:n
top=Label(max(1,i-1),j);
bottom=Label(min(m,i+1),j);
left=Label(i,max(1,j-1));
right=Label(i,min(n,j+1));
if ~(top==bottom && bottom==left && left==right)
marker(i,j)=1;
end
end
end
figure,imshow(marker);
I2=I;
for i=1:m
for j=1:n
if marker(i,j)==1
I2(i,j,:)=0;
end
end
end
figure,imshow(I2);测试图像:
栅格划分结果:
聚类过程:
聚类最终结果:

连通域合并后的结果:
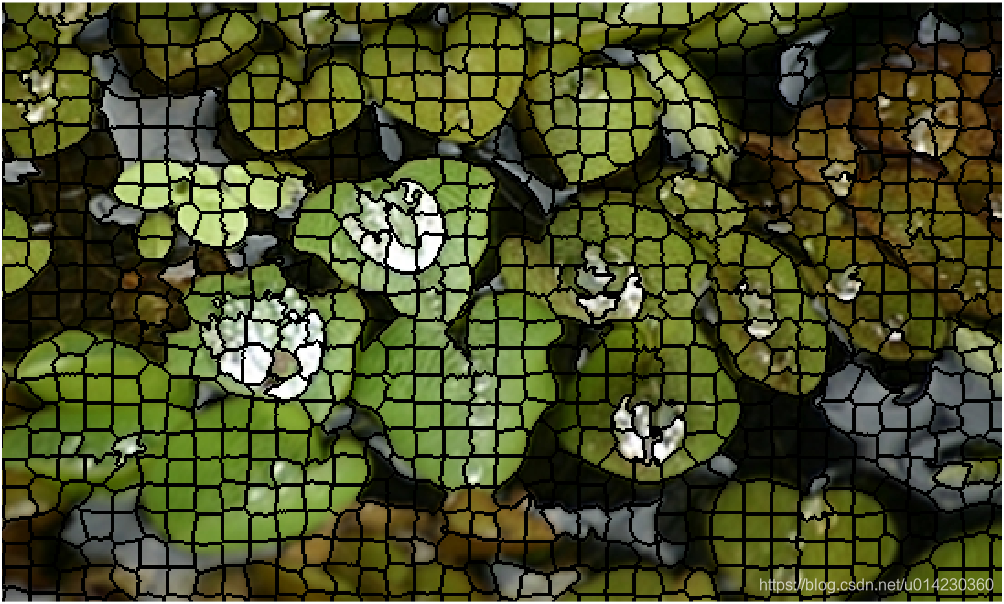
原图+轮廓线:
具体的我就不解释了,自觉程序写得还是很有条理的,读者自己跟踪程序运行进行理解吧。


 261
261

 被折叠的 条评论
为什么被折叠?
被折叠的 条评论
为什么被折叠?
 到【灌水乐园】发言


