


import numpy as np
import pandas as pd
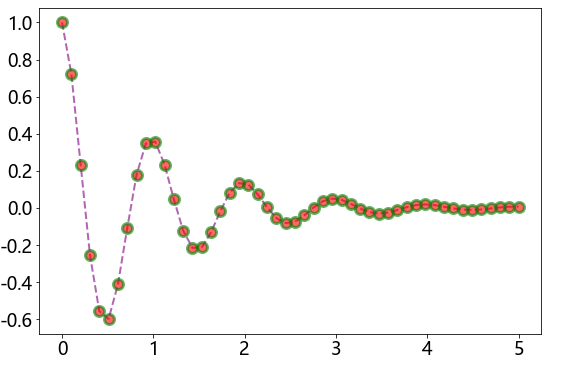
def f(x):
return np.exp(-x) * np.cos(2*np.pi*x)
x = np.linspace(0,5,50)
plt.figure(figsize=(9,6))
plt.plot(x,f(x),color = 'purple',
marker = 'o',
ls = '--',
lw = 2,
alpha = 0.6,
markerfacecolor = 'red',# 点颜⾊
markersize = 10,# 点⼤⼩
markeredgecolor = 'green',#点边缘颜⾊
markeredgewidth = 3)#点边缘宽度
plt.xticks(size = 18) # 设置刻度⼤⼩
plt.yticks(size = 18)


 2618
2618

 被折叠的 条评论
为什么被折叠?
被折叠的 条评论
为什么被折叠?
 到【灌水乐园】发言


