


 本文介绍如何使用ArcGIS Runtime WPF SDK进行图形的创建、编辑及符号化,并展示了如何设置标签和利用命令进行复杂操作。
本文主要包括以下几方面内容:
- 创建,编辑图形(Graphic)
- 符号,几何体,要素
- 标签的显示
最后成品大概是这样的:
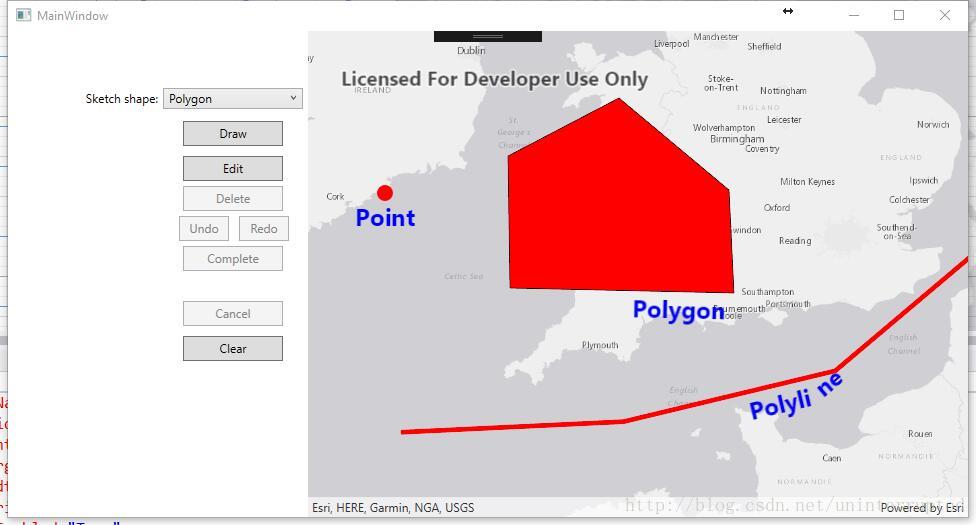
首先,如果对如何使用ArcGIS Runtime WPF SDK有疑问,可以移步使用ArcGIS Runtime WPF SDK (1)创建自己的地图应用程序
创建,编辑图形元素
这一部分的代码和文档参见Sketch graphics on the map
这一部分内容,使用MapView的SketchEditor实现,如果想对SDK有一个更全面的认识,可以参见ArcGIS Runtime WPF SDK (2)命名空间解析一文。
首先,我们需要在MainWindow.xaml中将数据上下文和SketchEditor绑定起来。
// Set the sketch editor configuration to allow vertex editing, resizing, and moving
var config = MyMapView.SketchEditor.EditConfiguration;
config.AllowVertexEditing = true;
config.ResizeMode = SketchResizeMode.Uniform;
config.AllowMove = true;

// Set the sketch editor as the page's data context
this.DataContext = MyMapView.SketchEditor;
然后就可以调用SketchEditor.StartAsync进行绘制了,最后我们会得到一个几何体。至于几何体如何转化为图形,我们在下一节介绍。
// Let the user draw on the map view using the chosen sketch mode
SketchCreationMode creationMode = (SketchCreationMode)SketchModeComboBox.SelectedItem;
Esri.ArcGISRuntime.Geometry.Geometry geometry = await MyMapView.SketchEditor.StartAsync(creationMode, true);
使用返回的几何体创建出图形,然后加入到GraphicOverlay中,就能显示出绘制的图形了。
如果需要编辑的话,进入编辑模式,鼠标点选需要编辑的几何体(的顶点)
// Wait for the user to click a location on the map
var mapPoint = (MapPoint)await MyMapView.SketchEditor.StartAsync(SketchCreationMode.Point, false);

// Convert the map point to a screen point
var screenCoordinate = MyMapView.LocationToScreen(mapPoint);

// Identify graphics in the graphics overlay using the point
var results = await MyMapView.IdentifyGraphicsOverlaysAsync(screenCoordinate, 2, false);

// If results were found, get the first graphic
Graphic graphic = null;
IdentifyGraphicsOverlayResult idResult = results.FirstOrDefault();
if (idResult != null && idResult.Graphics.Count > 0)
{
    graphic = idResult.Graphics.FirstOrDefault();
}

// Return the graphic (or null if none were found)
return graphic;
然后就可以编辑了
Esri.ArcGISRuntime.Geometry.Geometry newGeometry = await MyMapView.SketchEditor.StartAsync(editGraphic.Geometry);
// Display the updated geometry in the graphic
editGraphic.Geometry = newGeometry;
为什么只需要鼠标点点点,就可以进行绘制,编辑等各种操作呢。背后是事件和命令在起作用。
在xaml中设置了button的click事件,然后在click事件的响应函数中设定进入哪种模式就行了(StartAsync的第二个参数)。
//xaml中代码如下
<Button x:Name="EditButton"
        Grid.Row="3" Grid.Column="1"
        Content="Edit"
        Margin="5"
        Width="100" Height="25"
        HorizontalAlignment="Center" VerticalAlignment="Top"
        IsEnabled="False"
        Click="EditButtonClick"/>
//.g.i.cs中间代码
this.EditButton.Click += new System.Windows.RoutedEventHandler(this.EditButtonClick)
//.cs
private async void EditButtonClick(object sender, RoutedEventArgs e)
而其他各种复杂的添加,删除,撤销,重做等操作也只需绑定上SketchEditor的各种命令就行。
<Button Content="Undo"
Margin="5"
Width="50" Height="25"
Command="{Binding UndoCommand}"/>
<Button Content="Redo"
Margin="5"
Width="50" Height="25"
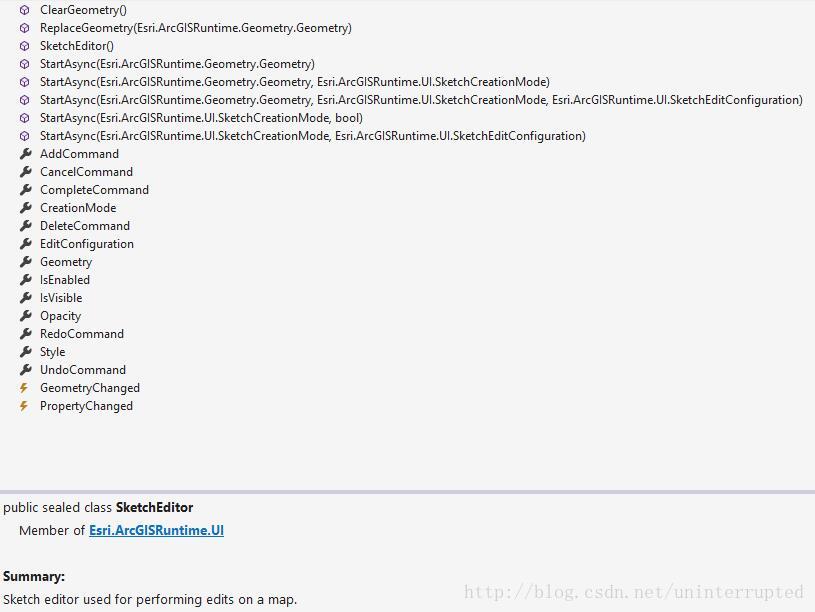
Command="{Binding RedoCommand}"/>灵活使用和绑定该类中的各种函数,命令就行。该对象详情如下:
符号,几何体,要素
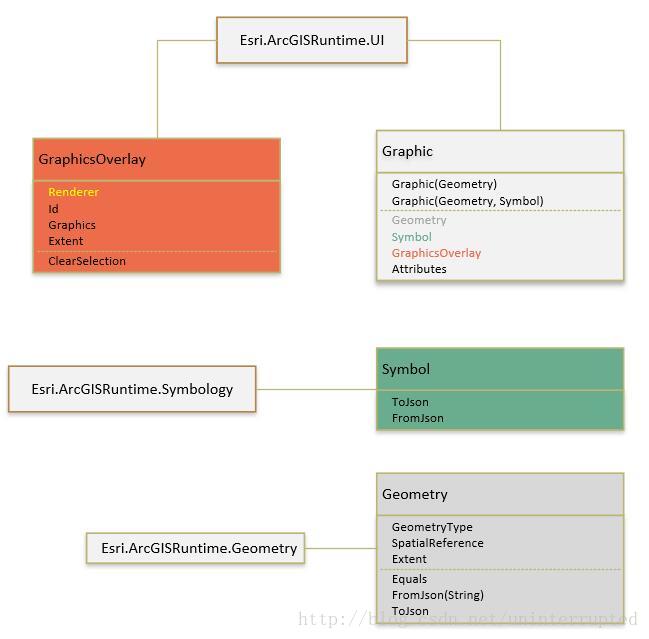
上一节主要介绍了几何体的交互式创建,编辑。但是几何体不是绘图图形。如果需要显示绘制的图形,还需要给几何体设置一个符号,如果存在属性,也设置一个属性。再将图形添加到GraphicOverlay(图形叠加层)中,才能完整的显示出来。简而言之,图形包括,几何体,属性,符号。
下面是一个简单的类图
以下的代码片段为一些基本symbol的创建方式。
Symbol symbol = null;
switch (geometry.GeometryType)
{
    // Symbolize with a fill symbol
    case GeometryType.Envelope:
    case GeometryType.Polygon:
        {
            symbol = new SimpleFillSymbol()
            {
                Color = Colors.Red,
                Style = SimpleFillSymbolStyle.Solid,
            };
            break;
        }
    // Symbolize with a line symbol
    case GeometryType.Polyline:
        {
            symbol = new SimpleLineSymbol()
            {
                Color = Colors.Red,
                Style = SimpleLineSymbolStyle.Solid,
                Width = 5d
            };
            break;
        }
    // Symbolize with a marker symbol
    case GeometryType.Point:
    case GeometryType.Multipoint:
        {

            symbol = new SimpleMarkerSymbol()
            {
                Color = Colors.Red,
                Style = SimpleMarkerSymbolStyle.Circle,
                Size = 15d
            };
            break;
        }
}
另外,请注意,如果一个图形叠置层中所有的几何体的类型都是一样的,而且我们期望他们显示样式也是一样的话,我们无需给每一个图形设置符号,只需要给叠置层同一设置一个符号(使用该符号样式创建出渲染器)就行了。

至于三要素中的‘属性’,会在下一节的标签显示中说明。
标签的显示
SDK支持在Layer层面设置Label的表达式以及属性。详情请见add-labels
我们只需要使用Json创建一个labelDefinition就可以了。Json示例如下:
{
  "labelExpressionInfo":
  {
      "expression": "return $feature.type;"
  },
  "labelPlacement": "esriServerLinePlacementBelowAlong",
  "symbol":
  {
    "color": [255,0,255,123],
    "font": { "size": 16 },
    "type": "esriTS"
  }
}
具体代码如下,别忘了设置LabelsEnabled为true
 // Create a StringBuilder to create the label definition JSON string
 StringBuilder addressLabelsBuilder = new StringBuilder();
 addressLabelsBuilder.AppendLine("{");
  // Create a StringBuilder to create the label definition JSON string
 StringBuilder addressLabelsBuilder = new StringBuilder();
 addressLabelsBuilder.AppendLine("{");
 //     Define a labeling expression that will show the address attribute value
 addressLabelsBuilder.AppendLine("\"labelExpressionInfo\": {");
 addressLabelsBuilder.AppendLine("\"expression\": \"return $feature.type;\"},");
 //     Align labels horizontally
 addressLabelsBuilder.AppendLine("\"labelPlacement\": \"esriServerLinePlacementBelowAlong\",");
 //     Use a green bold text symbol
 addressLabelsBuilder.AppendLine("\"symbol\": {");
 addressLabelsBuilder.AppendLine("\"color\": [0,0,255,255],");
 addressLabelsBuilder.AppendLine("\"font\": {\"size\": 18, \"weight\": \"bold\"},");
 addressLabelsBuilder.AppendLine("\"type\": \"esriTS\"}");
 addressLabelsBuilder.AppendLine("}");
 // Get the label definition string
 var addressLabelsJson = addressLabelsBuilder.ToString();
 // Create a new LabelDefintion object using the static FromJson method
 LabelDefinition labelDef = LabelDefinition.FromJson(addressLabelsJson);
 // Clear the current collection of label definitions (if any)
 _sketchOverlay.LabelDefinitions.Clear();
 // Add this label definition to the collection
 _sketchOverlay.LabelDefinitions.Add(labelDef);
 // Make sure labeling is enabled for the layer
_sketchOverlay.LabelsEnabled = true这样我们就设置好了label的样式,关于Json描述的更多信息可以参考server的rest api相关部分。
如何选取需要显示为Label的属性?我们可以在表达式中使用Arcade,当然啦。作为示例,我们就使用最简单的表达式"\"expression\": \"return $feature.type;\"即$feature.type。选取了feature的‘type’字段作为展示源数据。
下面我们需要给graphic添加一个具有’type’键值的属性。下面的例子是创建出type为图形类型的属性字段。

至此,我们就凑齐了图形的三要素,可以创建出一个图形了new Graphic(geometry, attributes, symbol)。
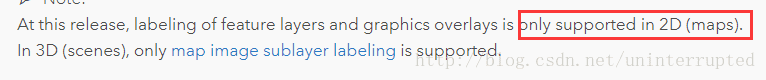
不过值得注意的是,目前label对于三维场景的支持还是比较有限。
本文的示例代码见sketch分支。


 被折叠的 条评论
为什么被折叠?
被折叠的 条评论
为什么被折叠?
 到【灌水乐园】发言


