


本文参考http://blog.csdn.net/xiahouzuoxin/article/details/44959205
在此向原作者致谢
当y的取值离散时,linear regression algorithm不再适用,而应该选择logistic regression.
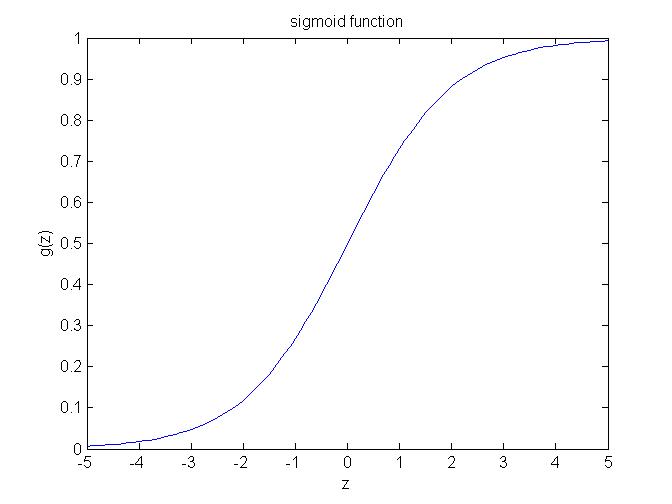
下图是logistic function(or sigmoid function):
下面是matlab代码:
function Logistic_regression
clear all;
close all;
clc;

data = load('LogisticInput.txt');
x = data(:,1:2);
y = data(:,3);

%Plot data
positive = find(y==1);
negtive = find(y==0);
hold on;
plot(x(positive,1),x(positive,2),'blue*');
plot(x(negtive,1),x(negtive,2),'ro');

[m,n] = size(x);
x = [ones(m,1),x];
theta = zeros(n+1,1);
[cost, grad] = cost_func(theta, x, y);
threshold = 0.1;
alpha = 10^(-1);
%stochastic gradient descent
while cost > threshold
    theta = theta + alpha*grad;
    [cost, grad] = cost_func(theta, x, y);
end

hold on
plot_x = [min(x(:,2))-2,max(x(:,2))+2];
plot_y = (-1./theta(3)).*(theta(2).*plot_x + theta(1));
plot(plot_x, plot_y, 'r-');
legend('Positive', 'Negtive', 'Decision')
xlabel('Feature 1');
ylabel('Feature 2');
title('Logistic Regression');

end


function [J,grad] = cost_func(theta, X, y)
%compute likelihood function and gradient
m = length(y);
hx = sigmoid(X*theta);
J = (1/m)*sum(-y.*log(hx)-(1.0-y).*log(1.0-hx));
grad = (1/m)*X'*(y-hx);
end

function g = sigmoid(z)
g = 1./(1+exp(-z));
end
结果:
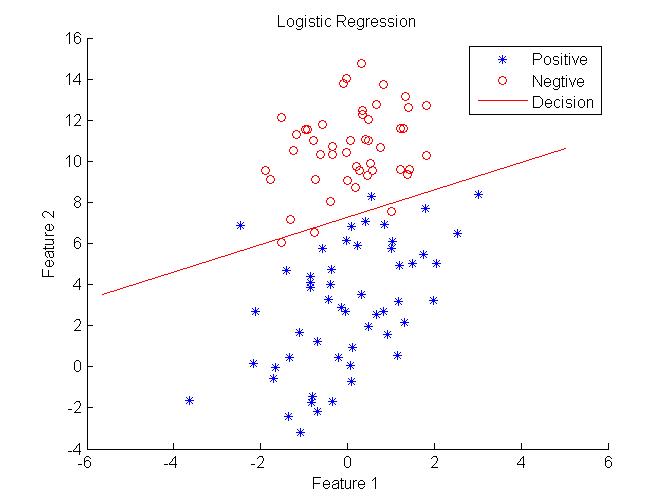
现在对这种回归问题大致有了一点感觉:首先要确定分布的probability function,然后改写为likelihood function,再对likelihood function进行最大化(一般会再改写成log(L_θ)后再处理),进而得到参数的更新方程(batch gradient descent、stochastic gradient descent)。


 194
194

 被折叠的 条评论
为什么被折叠?
被折叠的 条评论
为什么被折叠?
 到【灌水乐园】发言


