


看这篇博客的我就默认已经会用plotly画关系热图了
不会的看这篇博客python关系热图画法2_铁灵的博客-CSDN博客
在plotly.figure_factory.create_annotated_heatmap中改变关系热图的色阶用colorscale这个参数
在plotly.express.imshow中用color_continuous_scale
目录
plotly.figure_factory.create_annotated_heatmap
plotly.figure_factory.create_annotated_heatmap
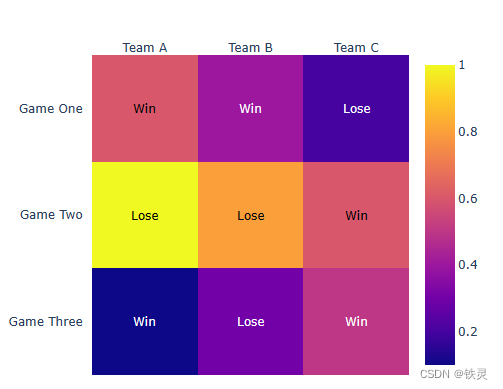
在没有使用colorscale时
代码:
import plotly.figure_factory as ff

z = [[.1, .3, .5],
     [1.0, .8, .6],
     [.6, .4, .2]]

x = ['Team A', 'Team B', 'Team C']
y = ['Game Three', 'Game Two', 'Game One']

z_text = [['Win', 'Lose', 'Win'],
          ['Lose', 'Lose', 'Win'],
          ['Win', 'Win', 'Lose']]

fig = ff.create_annotated_heatmap(z, x=x, y=y, annotation_text=z_text,showscale=True)
fig.update_layout(width=500,height=500)
fig.show()
输出:
使用colorscale改变色阶
输入:
import plotly.figure_factory as ff

z = [[.1, .3, .5],
     [1.0, .8, .6],
     [.6, .4, .2]]

x = ['Team A', 'Team B', 'Team C']
y = ['Game Three', 'Game Two', 'Game One']

z_text = [['Win', 'Lose', 'Win'],
          ['Lose', 'Lose', 'Win'],
          ['Win', 'Win', 'Lose']]

fig = ff.create_annotated_heatmap(z, x=x, y=y, annotation_text=z_text,showscale=True,colorscale='Viridis')
fig.update_layout(width=500,height=500)
fig.show()
在倒数第三行最后面
输出:
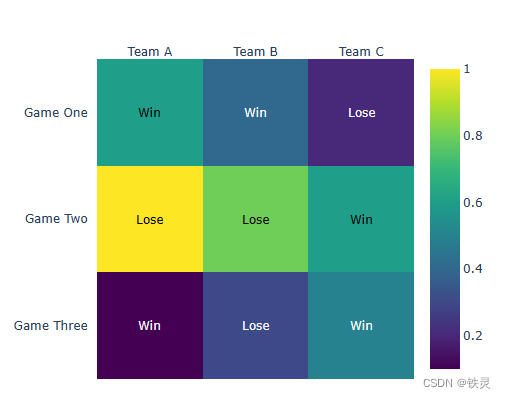
Viridis是翠绿色的意思
colorscale的值并不是什么颜色都可以的,会报错的
下面是一些可选值的参考
['aggrnyl', 'agsunset', 'algae', 'amp', 'armyrose', 'balance',
             'blackbody', 'bluered', 'blues', 'blugrn', 'bluyl', 'brbg',
             'brwnyl', 'bugn', 'bupu', 'burg', 'burgyl', 'cividis', 'curl',
             'darkmint', 'deep', 'delta', 'dense', 'earth', 'edge', 'electric',
             'emrld', 'fall', 'geyser', 'gnbu', 'gray', 'greens', 'greys',
             'haline', 'hot', 'hsv', 'ice', 'icefire', 'inferno', 'jet',
             'magenta', 'magma', 'matter', 'mint', 'mrybm', 'mygbm', 'oranges',
             'orrd', 'oryel', 'oxy', 'peach', 'phase', 'picnic', 'pinkyl',
             'piyg', 'plasma', 'plotly3', 'portland', 'prgn', 'pubu', 'pubugn',
             'puor', 'purd', 'purp', 'purples', 'purpor', 'rainbow', 'rdbu',
             'rdgy', 'rdpu', 'rdylbu', 'rdylgn', 'redor', 'reds', 'solar',
             'spectral', 'speed', 'sunset', 'sunsetdark', 'teal', 'tealgrn',
             'tealrose', 'tempo', 'temps', 'thermal', 'tropic', 'turbid',
             'turbo', 'twilight', 'viridis', 'ylgn', 'ylgnbu', 'ylorbr',
             'ylorrd']
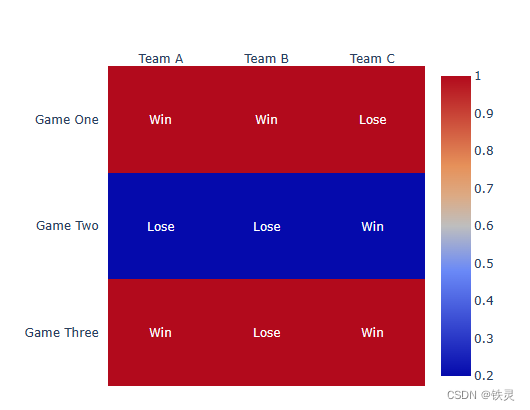
只能使用可选值吗?是否可以自定义
输入:
能是能,但是我没成功,,,知道为啥没成功的小伙伴教我一下(评论区)
import plotly.figure_factory as ff

z = [[1,1, 1],
     [0.2, 0.2, 0.2],
     [1, 1, 1]]

x = ['Team A', 'Team B', 'Team C']
y = ['Game Three', 'Game Two', 'Game One']
colorscale=[[0.1, 'rgb(0,100,255)'],[1, 'rgb(0,255,0)']]

z_text = [['Win', 'Lose', 'Win'],
          ['Lose', 'Lose', 'Win'],
          ['Win', 'Win', 'Lose']]

fig = ff.create_annotated_heatmap(z, x=x, y=y, annotation_text=z_text,showscale=True,colorscale=colorscale)
fig.update_layout(width=500,height=500)
fig.show()
输出:
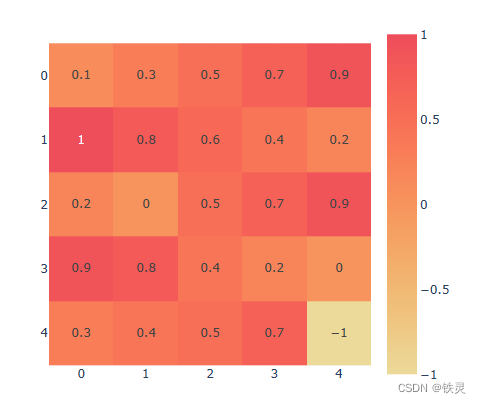
plotly.express.imshow
使用color_continuous_scale改变色阶
输入:
import plotly.express as px

z = [[.1, .3, .5, .7, .9],
     [1, .8, .6, .4, .2],
     [.2, 0, .5, .7, .9],
     [.9, .8, .4, .2, 0],
     [.3, .4, .5, .7, -1]]

fig = px.imshow(z, text_auto=True,color_continuous_scale='oryel')
fig.update_layout(width=500,height=500)
fig.show()
参考值和上面是一样的
输出:


 7096
7096

 被折叠的 条评论
为什么被折叠?
被折叠的 条评论
为什么被折叠?
 到【灌水乐园】发言


