


先上效果图
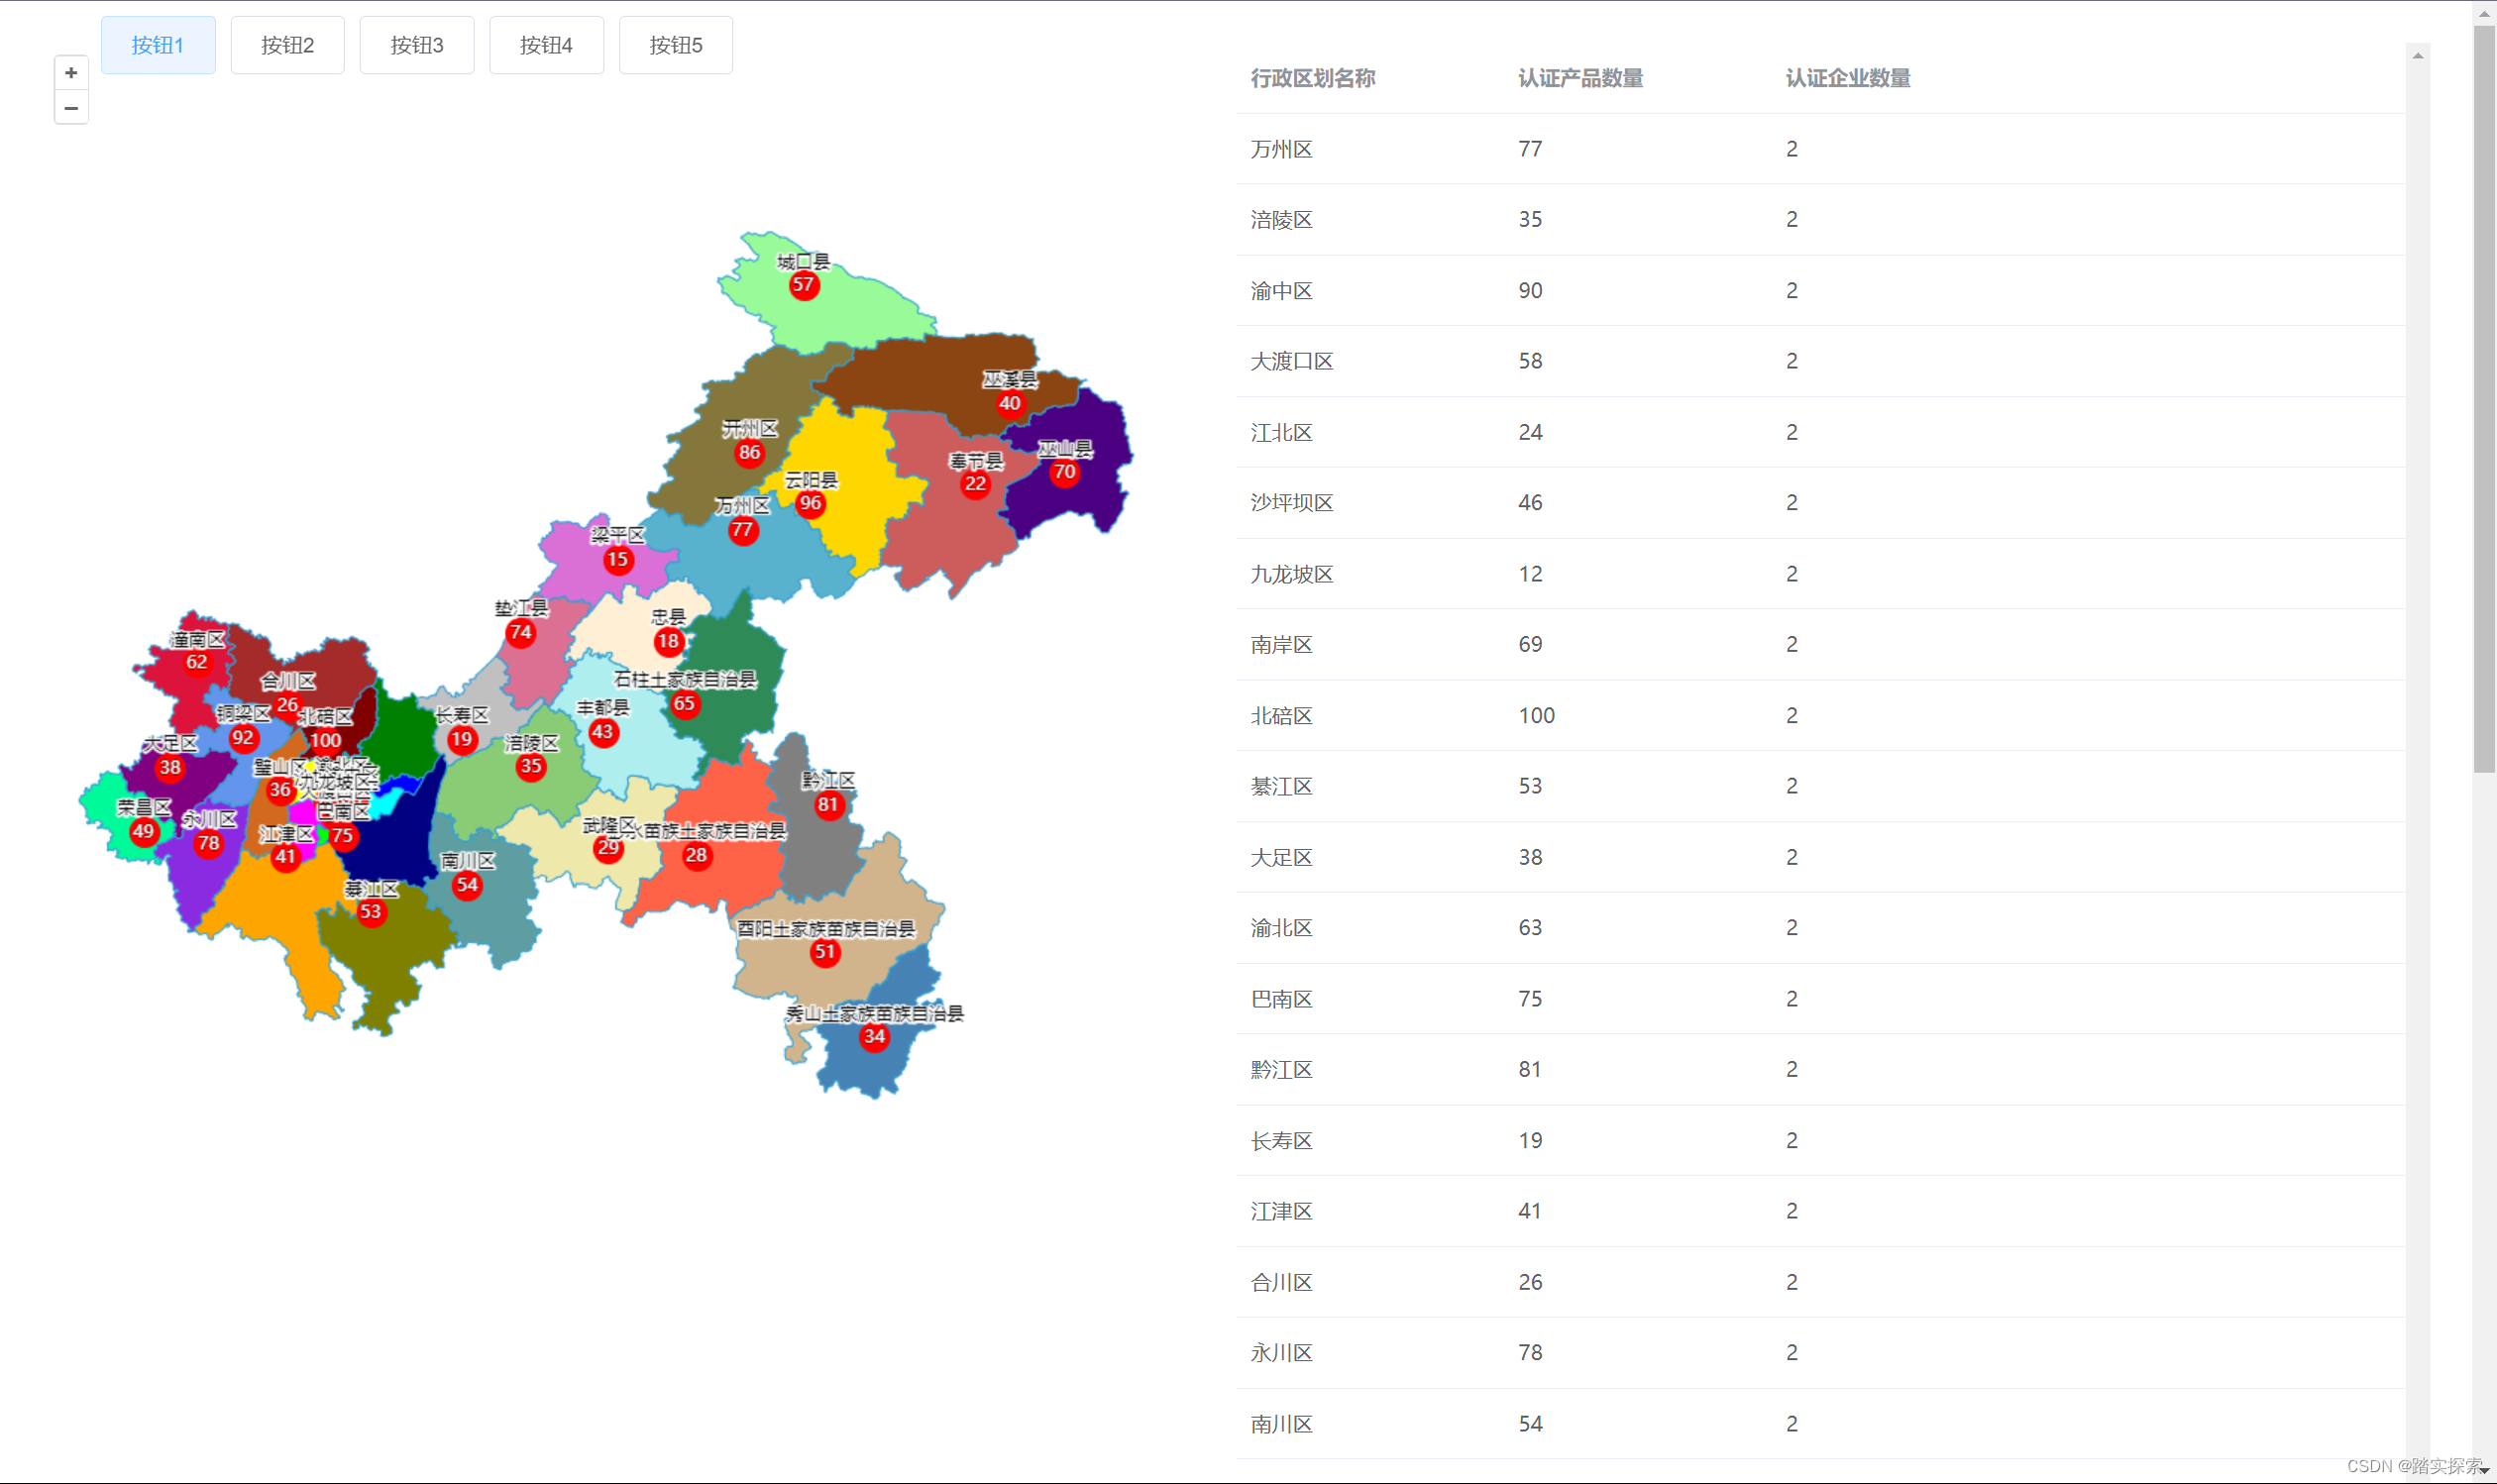
使用 OpenLayers 和 Vue 构建重庆行政区划地图
在本文中,我们将介绍如何使用 OpenLayers 和 Vue 构建一个重庆行政区划地图,并展示区域相关信息。通过点击地图上的行政区划区域,可以高亮显示该区域,并更新表格中的数据。本文将详细讲解实现这一功能的各个方法。
功能解析
初始化地图和加载GeoJSON
我们首先在 mounted 生命周期钩子中调用 initMap 和 loadGeoJSON 方法来初始化地图并加载重庆的行政区划数据。
mounted() {

  this.initMap();
  this.loadGeoJSON();
}
initMap 方法
initMap 方法用于初始化地图,并设置地图的中心和缩放级别。我们在这里定义了地图的投影、中心位置和缩放级别,并监听了地图的点击事件。
initMap() {

  this.map = new Map({

    target: 'map',
    layers: [],
    view: new View({

      projection: 'EPSG:4326',
      center: [108, 30.2],
      zoom: 8,
    }),
  });
  this.map.on('singleclick', this.handleMapClick);
}
loadGeoJSON 方法
loadGeoJSON 方法用于加载重庆的行政区划 GeoJSON 数据,并初始化两个图层:一个用于显示行政区划,一个用于显示红色的点。加载完成后,调用 addPoints 和 fetchAndAddNames 方法来添加点和区域名称。
loadGeoJSON() {

  const vectorSource = new VectorSource({

    url: 'https://geo.datav.aliyun.com/areas_v3/bound/500000_full.json',
    format: new GeoJSON(),
  });

  this.vectorLayer = new VectorLayer({

    source: vectorSource,
    style: this.styleFunction,
  });
  this.map.addLayer(this.vectorLayer);

  const pointSource = new VectorSource();
  this
最低0.47元/天 解锁文章


 1165
1165


 被折叠的 条评论
为什么被折叠?
被折叠的 条评论
为什么被折叠?
 到【灌水乐园】发言


