


皮质 (Cortex)
Part 1 of 4: The Beginning of the Journey Into Brain Computer Interfaces
Part 2 of 4: Machine Learning for Motor Imagery
第4部分的第2部分:用于运动图像的机器学习
When we were children, the world was new to us. We couldn’t understand it but we could see it, touch it, smell it, and much more with our sensory organs. Everything except interpretation. But as we grew older our teachers, parents, etc. taught us how society and the physical world functions, allowing us to eventually form new perspectives to understand the world around us. As the age of big data and ever-improving computational machines arrived, researchers started to think of machines the same way; blank slates that when fed collections of data (acting as the teacher), it can start to form new insights about the system described by the dataset. Particularly the most famous example of this is IBM’s Watson, an artificial intelligence capable of extracting important pieces of data and providing analysis and insights to predict workplace and industry outcomes. Watson was trained using large financial and enterprise datasets to allow it to provide the insights that humans can’t detect due to the large volumes of data. With these advances in machine intelligence, researchers have started to use learning systems in different fields, particularly the field of neuroscience and neural computation. Machine learning algorithms such as linear discriminant analysis (LDA) and support vector machines (SVM) can be used to detect patterns in brain waves that can lead to motor and emotional state classification.
当我们还是孩子的时候,世界对我们来说是新的。 我们无法理解它,但是我们可以通过感官器官看到,触摸,闻到它,还有更多。 一切,除了解释。 但是随着年龄的增长,我们的老师,父母等教会了我们社会和物质世界的运作方式,使我们最终形成了新的视角来了解我们周围的世界。 随着大数据时代和不断改进的计算机器的到来,研究人员开始以相同的方式思考机器。 空白板表示当喂入数据集合(充当教师)时,它可以开始形成有关数据集描述的系统的新见解。 特别是最著名的例子是IBM的Watson ,这是一种人工智能,能够提取重要数据并提供分析和见解以预测工作场所和行业成果。 沃森(Watson)使用大型财务和企业数据集进行了培训,以使其能够提供由于大量数据而人类无法检测到的见解。 随着机器智能的这些进步,研究人员已开始在不同领域,特别是神经科学和神经计算领域中使用学习系统。 诸如线性判别分析(LDA)和支持向量机(SVM)之类的机器学习算法可用于检测脑波中的模式,这些模式可导致运动和情绪状态分类。
This series is an attempt to allow a person with no expertise in the brain-computer interface (BCI) area to understand what they are and how we can use machine learning to analyze brainwaves in unique ways. The project explored in this series is in collaboration with Dr. Chris Crawford of the Human Technology Interaction Lab (HTIL) at the University of Alabama. This also goes to demonstrate that amateur scientists can use basic electroencephalogram (EEG) devices to extract and analyze brainwaves, and in turn can deploy large-scale open source platforms so the general public can experiment with their own brain data.
本系列旨在使没有脑机接口(BCI)领域知识的人了解他们是什么,以及我们如何使用机器学习以独特的方式分析脑电波。 本系列中探索的项目与阿拉巴马大学人类技术互动实验室( HTIL )的Chris Crawford博士合作。 这也证明业余科学家可以使用基本的脑电图(EEG)设备提取和分析脑电波,进而可以部署大规模的开放源代码平台,从而使公众可以用自己的大脑数据进行实验。
Here we will cover the basics behind machine learning and its application to brainwave classification with:
在这里,我们将通过以下内容介绍机器学习及其在脑电波分类中的应用基础知识:
Introduction to BCI.js: We’ll go over BCI.js, a dynamic and efficient library used to run basic machine learning algorithms on brainwave data.
BCI.js简介:我们将介绍BCI.js ,这是一个动态高效的库,用于对脑电波数据运行基本的机器学习算法。
- Experimentation Flow: Before we jump into the algorithms themselves, establishing an experimentation flow will help us understand the setup necessary to run these algorithms. 实验流程:在进入算法本身之前,建立实验流程将帮助我们了解运行这些算法所需的设置。
- Linear Discriminant Analysis (LDA) and Common Spatial Patterns (CSP): We’ll explore these two machine learning algorithms and the insights they can give us into motor and emotional state classification. 线性判别分析(LDA)和常见空间模式(CSP):我们将探讨这两种机器学习算法,以及它们对运动和情绪状态分类的见解。
In order to implement the section of the project described in this article, you will need the following:
为了实现本文描述的项目部分,您将需要以下内容:
A working understand of JavaScript/React and how to create a component tree using React components. Here is the React documentation.
对JavaScript / React以及如何使用React组件创建组件树有一定的了解。 这是React文档 。
A Chrome browser and access to a Muse EEG Version 2
Chrome浏览器并访问Muse EEG版本2
Part 1 of this series explored the Muse EEG, the Bluetooth system, and the project architecture; you can read it here.
本系列的第1部分探讨了Muse EEG,蓝牙系统和项目架构。 你可以在这里阅读。
BCI.js:强大的机器学习库 (BCI.js: A Powerful Machine Learning Library)
An EEG-based BCI project starts with the collection of nervous system data with systems of electrodes or compact hardware solutions such as the Muse EEG. That data is then transported to computing environments such as MATLAB where it is processed with filtering algorithms such as Fourier transforms (will be discussed later in the series) and classification algorithms such as LDA. Researchers at the Human Technology Interaction Lab at the University of Alabama realized that MATLAB analyses of brainwaves weren’t modular and couldn’t be distributed in applications that employed this type of mathematical modeling. They attempted to transport these algorithms to a more modular programming language such as C, but it was difficult for novice programmers to implement and had a steep learning curve. BCI.js was developed to solve these problems; it is a JavaScript library that is portable and relatively easy to use, open-source, and can be integrated with existing applications easily.
基于EEG的BCI项目始于使用电极系统或紧凑型硬件解决方案(例如Muse EEG)收集神经系统数据。 然后将该数据传输到诸如MATLAB之类的计算环境,并在其中使用诸如Fourier变换(将在本系列的后面部分讨论)等滤波算法和诸如LDA的分类算法对其进行处理。 阿拉巴马大学人类技术互动实验室的研究人员意识到,脑波的MATLAB分析不是模块化的,并且不能在采用这种数学模型的应用程序中进行分布。 他们试图将这些算法传输到更模块化的编程语言(例如C)上,但是对于新手程序员来说,实现起来很困难,而且学习曲线也很陡。 开发BCI.js就是为了解决这些问题。 它是一个JavaScript库,可移植且相对易于使用,是开源的,并且可以轻松地与现有应用程序集成。
BCI.js contains many modules that can aid in brain-computer interface application development, but the most important ones are the learn and classify functions for machine learning algorithms, the confusion matrix function, and the transpose function. The learn and classify functions represent the two main phases of a machine learning system: learning and classification. The learning step is meant to act as the teacher in our earlier analogy, feeding data to the system with the purpose of teaching the program about the environment before being able to draw its own conclusions from new data. The classification step is where the program is able identify certain patterns based on new datasets with information learned with training data. To illustrate this, we will use linear discriminant analysis (LDA) as an example. LDA is an algorithm that draws a boundary between two data classes which allows for the classification of new data. We will cover the mathematics behind LDA later in the article, but as this is an example of learn and classify functions, the definition is sufficient. Below is an example of the LDA functions used to learn from existing data and classify new data. Class 1 and 2 represent two classes of data points ranging from 0 to 2 and 7 to 10 respectively. ldaParams is a variable that stores the learned optimization function from the ldaLearn function, and predictions stores the classification vector of the class that the unknownPoints belong to. We will cover optimization functions and how LDA actually learns in the next section, but just know that BCI.js provides simple implementations for machine learning algorithms that require no in-depth knowledge on the mathematics or statistics of them.
BCI.js包含许多有助于脑机接口应用程序开发的模块,但是最重要的模块是机器学习算法的学习和分类功能, 混淆矩阵功能和转置功能。 学习和分类功能代表了机器学习系统的两个主要阶段:学习和分类。 学习步骤的目的是在我们较早的类比中充当老师,将数据馈送到系统,目的是教程序有关环境的信息,然后才能够根据新数据得出自己的结论。 分类步骤是程序能够基于新数据集识别特定模式的信息,这些新数据集具有从训练数据中学到的信息。 为了说明这一点,我们将以线性判别分析(LDA)为例。 LDA是一种在两个数据类之间划定界限的算法,可以对新数据进行分类。 我们将在本文后面介绍LDA背后的数学,但是由于这是学习和分类函数的示例,因此定义就足够了。 以下是LDA功能的示例,用于从现有数据中学习并对新数据进行分类。 1类和2类分别代表两类数据点,分别从0到2和7到10。 ldaParams是一个变量,用于存储从ldaLearn函数中学到的优化函数,而预测则存储unknownPoints所属类的分类向量。 在下一节中,我们将介绍优化功能以及LDA的实际学习方式,但只知道BCI.js为不需要非常深入的数学或统计知识的机器学习算法提供了简单的实现。
The confusion matrix function is the next most important function that BCI.js has to offer. A confusion matrix is a performance metric on a classification system that utilizes the identification of classification outcomes as false positives/negatives and true positives/negatives. The terminology of a confusion matrix can be difficult, but here is a resource to familiarize yourself with such terms.
混淆矩阵函数是BCI.js必须提供的下一个最重要的函数。 混淆矩阵是分类系统上的一项性能指标,它利用分类结果的标识为假阳性/阴性和真阳性/阴性。 混淆矩阵的术语可能很困难,但是这里有资源让您熟悉这些术语。

This confusion matrix will allow us to analyze our machine learning model’s performance and tweak the system to minimize the amount of false positives and false negatives in the system. The next most important, and probably the simplest, function is the transpose function, which does one basic thing: flips a matrix across the diagonal (stretching from top left to bottom right) while maintaining the original order of the elements. In most matrices, the top left, middle, bottom right elements remain in their original position when transposed so that the original element ordering remains the same. The transpose function is useful as it allows a matrix to meet the requirements for matrix multiplication (see here for an in depth look into matrix dimensions when multiplying).
这个混淆矩阵将使我们能够分析机器学习模型的性能并调整系统,以最大程度地减少系统中误报和误报的数量。 下一个最重要且可能是最简单的函数是转置函数,该函数执行一项基本操作:沿对角线翻转矩阵(从左上角到右下角拉伸),同时保持元素的原始顺序。 在大多数矩阵中,左,中,右下元素在转置后仍保持其原始位置,因此原始元素的顺序保持不变。 转置功能很有用,因为它允许矩阵满足矩阵乘法的要求(有关乘法时矩阵尺寸的详细信息,请参见此处 )。

The four functions, learn and classify, confusion matrix, and transpose, are extremely efficient in running machine learning models on brain data. It also allows for real time processing, with some machine learning algorithms implemented by BCI.js taking just under 4 ms to complete. Considering that some machine learning models can take hours to train, BCI.js allows for extremely fast and efficient experimentation. Now that we’ve established these four functions, we’ll cover the experimentation flow and the LDA and common spatial algorithms (CSP) so that we can start implementing them on brain data for motor state classification.
学习和分类 , 混淆矩阵和转置这四个功能对于在大脑数据上运行机器学习模型非常有效。 它还允许实时处理,并且由BCI.js实现的某些机器学习算法需要不到4毫秒的时间才能完成。 考虑到某些机器学习模型可能需要花费数小时才能训练,因此BCI.js允许进行极其快速和高效的实验。 现在我们已经建立了这四个功能,我们将介绍实验流程以及LDA和通用空间算法(CSP),以便我们可以在大脑数据上实现它们以进行运动状态分类。
If you are interested in reviewing other common classification strategies used with EEG data, check out this paper: 10 Year Review of Classification Systems.
如果您有兴趣查看与EEG数据一起使用的其他常见分类策略,请查看本文: 分类系统10年回顾 。
实验流程 (Experimentation Flow)
Before we jump into the technical details about the two machine learning algorithms, let’s step back for a moment. Once the system is developed in its entirety, how should an experiment be executed? We can use the basic outline of a machine learning model as the basis of our protocol; we know it needs a training phase and a testing phase. As mentioned earlier, the training phase “teaches” the model to understand the labeled data so that in the testing phase, it can search for and identify similar patterns in new data. A protocol can be established off of this concept; we need a series of training and testing phases to gain insight into a particular cognitive task. In this project and the series, the main cognitive task focused on is motor imagery as I was interested in exploring the feasibility of detecting imagined movements with Muse.
在深入介绍这两种机器学习算法的技术细节之前,让我们退一步。 系统全面开发后,应如何执行实验? 我们可以使用机器学习模型的基本轮廓作为协议的基础; 我们知道它需要培训阶段和测试阶段。 如前所述,训练阶段“教”模型以了解标记的数据,以便在测试阶段可以搜索和识别新数据中的相似模式。 可以根据此概念建立协议。 我们需要一系列的培训和测试阶段,以洞悉特定的认知任务。 在这个项目和系列中,主要的认知任务是运动图像,因为我有兴趣探索使用缪斯技术检测想象中的动作的可行性。
This hardware was not designed to be ideal for motor imagery, but it is more than sufficient for simple motor tasks. Here is an review on the premotor cortex and the hardware for detection of imagined movements.
该硬件的设计并不是理想的电机图像,但对于简单的电机任务来说已经足够了。 这里是对运动前皮层和用于检测想象的运动的硬件的综述。
In this section, I will use the example of right hand vs. left hand movement detection to describe an ideal experimentation flow that you can then extrapolate to classify different cognitive activities.
在本节中,我将使用左右手运动检测的示例来描述理想的实验流程,然后可以对其进行推断以对不同的认知活动进行分类。
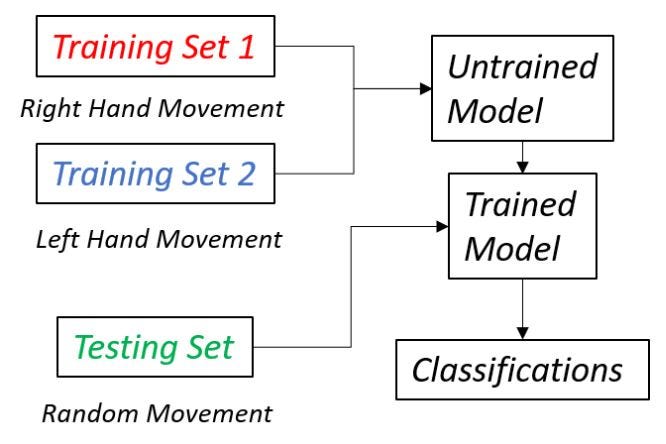
In right hand vs. left hand movement detection, our goal is to identify whether the subject is moving his/her right or left hand (or even a mix of both). We can achieve this by establishing two training sets and one testing set: one training set for right hand data, another one for left hand data, and one testing set for unknown data points in the testing phase. Temporally, we space it out into three blocks, where the subject records themselves moving their right hand for a certain period of time, then their left hand, then hand movements that they want the model to classify. For example, Subject A moves their right hand during the recording period, then their left hand, and for the testing set, they decide to move their right hand only. The model has enough time to train itself with the two training sets before it classifies the movements described in the testing set. Below is an architecture diagram of the experimentation flow.
在右手和左手运动检测中,我们的目标是识别对象是在移动他/她的右手还是左手(甚至是两者的混合)。 我们可以通过建立两个训练集和一个测试集来实现此目的:在测试阶段,一个训练集用于右手数据,另一个训练用于左手数据,一个训练集用于未知数据点。 暂时,我们将其分成三个部分,对象记录自己的右手移动了一段时间,然后是他们的左手,然后是他们希望模型进行分类的手部运动。 例如,受试者A在录制期间先移动右手,然后再移动左手,对于测试集,他们决定只移动右手。 在对测试集中描述的运动进行分类之前,该模型有足够的时间用两个训练集对其进行训练。 下面是实验流程的架构图。
In Part 1, I mentioned that in order to save computation time we limit the amount of data points (buffer) stored in the training and testing sets to around 2000. You can always increase or decrease this amount, but it is important to note that training and testing collection periods must be long enough to fill the limit set by your buffer. If not, then the unequal sizes of arrays make it impossible for the model to train properly. To give some perspective, at a sample rate of 256 (256 values collected per second), it would take around 10 seconds to fill a buffer of 2000 data points. My advice to you when you are developing your own applications is to select those two variables to: minimize computation time, maximize collection efficiency, and to limit the training and testing time. Minimizing computation time and maximizing collection efficiency are machine learning model standards, but why do we want to limit the training and testing time? Even though more training data will make your model accurate, with brain computer interface experimentation, subjecting your participant to more than one minute of activity is tedious and redundant; most meaningful data would come earlier in the experiment.
在第1部分中 ,我提到为了节省计算时间,我们将存储在训练和测试集中的数据点(缓冲区)的数量限制为2000个左右。您可以始终增加或减少该数量,但是请注意,培训和测试的收集周期必须足够长,才能满足缓冲区设置的限制。 如果不是,则数组大小不相等将导致模型无法正确训练。 为了提供一些观点,以256的采样率(每秒收集256个值),填充2000个数据点的缓冲区大约需要10秒。 在开发自己的应用程序时,我的建议是选择这两个变量以:最小化计算时间,最大化收集效率以及限制训练和测试时间。 最小化计算时间和最大化收集效率是机器学习模型的标准,但是为什么我们要限制训练和测试时间呢? 尽管更多的训练数据将使您的模型更加准确,但是通过大脑计算机界面实验,让您的参与者进行一分钟以上的活动是乏味且多余的; 最有意义的数据将在实验的早期出现。
Experimentation flow is extremely important in BCI applications and it must be established even before a machine learning model is created and tested. Knowing the flow of your experiment can actually give you clarity as to what performance task your model is trying to optimize, making it easier to develop the model. Now the fun begins, as we segue into the two types of basic machine learning models we will cover: LDA and CSP.
实验流程在BCI应用程序中非常重要,即使在创建和测试机器学习模型之前也必须建立实验流程。 知道实验的流程实际上可以使您清楚地知道模型正在尝试优化哪些性能任务,从而使开发模型变得更加容易。 现在,有趣的事情开始了,当我们探究两种基本的机器学习模型时,我们将介绍LDA和CSP。
线性判别分析 (Linear Discriminant Analysis)
Linear discriminant analysis (LDA) is a method used in statistics and pattern recognition to characterize two or more classes of data by finding a linear combination of specific features. While that definition seems complicated, the intuition behind the algorithm is actually fairly simple. Let’s use the example of weather; we will use two metrics to determine the type of day with respect to its weather: temperature and precipitation percentage (likelihood that it will rain). For our two classes, hot and cold days, a higher temperature and a lower precipitation percentage is indicative of a hot day, the opposite for cold days. When plotted on a graph with the x-axis modeling temperature and the y-axis modeling precipitation, the points in the lower right corner are hot and the ones in the upper left hand corner are cool. Below is a plot of 16 different days (a mix of hot and cool), with eight in each class. LDA will find the center of each class and define a slope and intercept form function that separates the two classes. Therefore, the model has learned what days are hot or cool from the training data. If you to provide weather information for the 17th day to the model (as part of the testing set), the model can classify it appropriately.
线性判别分析(LDA)是一种用于统计和模式识别的方法,通过找到特定特征的线性组合来表征两类或更多类数据。 尽管该定义似乎很复杂,但算法背后的直觉实际上非常简单。 让我们以天气为例。 我们将使用两个指标来确定相对于天气的一天类型:温度和降水百分比(下雨的可能性)。 对于我们的两个类别(炎热和寒冷的日子),较高的温度和较低的降水百分比表示炎热的天气,而寒冷的日子则相反。 当在带有x轴建模温度和y轴建模降水量的图形上绘制时,右下角的点很热,而左上角的点很酷。 下图是16个不同的日子(冷热混合)的图表,每个班级有8个。 LDA将找到每个类别的中心,并定义将两个类别分隔开的斜率和截距形式函数。 因此,该模型从训练数据中获悉了哪些日子最热还是最冷。 如果要向模型提供第17天的天气信息(作为测试集的一部分),则模型可以对其进行适当的分类。

In this section, we will cover the mathematics behind LDA and how it can be applied to motor imagery tasks. Feel free to skip the mathematics section if you are not comfortable with statistics; it will not limit your understanding of the application section of LDA.
在本节中,我们将介绍LDA背后的数学以及如何将其应用于汽车成像任务。 如果您不熟悉统计信息,可以跳过数学部分。 它不会限制您对LDA应用部分的理解。
LDA的数学 (The Mathematics of LDA)
The formal definition of classification is a process that arranges data according to shared characteristics and qualities. How can we mathematically arrange these data points into their respective classes? In classification, we consider Y classes, categories i, and an input vector X, assuming that there are only two categories/classes. We can classify X as belonging to the class that maximizes:
分类的正式定义是根据共享的特征和质量排列数据的过程。 我们如何在数学上将这些数据点排列到各自的类中? 在分类中,假设只有两个类别,则考虑Y类,类别i和输入向量X。 我们可以将X分类为属于最大化类:

Classification in LDA relies on Bayes Theorem, which states that:
LDA中的分类依赖于贝叶斯定理,该定理指出:

We relate the probability of X being classified in each class to each subsequent value being classified as X within such class, essentially identifying data clusters within each subclass. Since we want Bayes Theorem to provide a probability density function that has favorable mathematical properties, the formula for the normal distribution is used:
我们将X在每个类别中被分类的概率与在该类别中被分类为X的每个后续值相关联,从而实质上标识了每个子类别中的数据簇。 由于我们希望贝叶斯定理提供具有良好数学特性的概率密度函数,因此使用正态分布的公式:

The standard model provided by the normal distribution predicts variable behavior, and if this prediction does not hold, the model’s performance deteriorates. When substituting the normal distribution into Bayes Theorem, maximizing the resulting value will lead to a correct classification prediction. When simplified, the discriminant function is:
正态分布提供的标准模型可以预测变量的行为,如果该预测不成立,则模型的性能会下降。 将正态分布替换为贝叶斯定理时,将结果值最大化将导致正确的分类预测。 简化后,判别函数为:
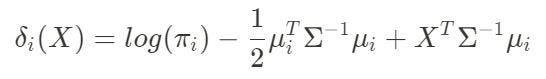
where the mean of inputs in class i (two in our case) and the inverse of the covariance between our two variables (standard deviation) are used. X is classified in the class that yields the highest discriminant function value. When evaluating the discriminant function for both classes, you can use the resulting equation for classification of inputs. If there are more than two classes, evaluate the functions above across i classes; however, for motor imagery purposes, two classes is enough. In order to draw a decision boundary shown in the weather example, you can take the average of the two slopes from the discriminant function outputs for both classes, which would accurately draw a boundary between the two data clusters. Now, let’s move on to our example of motor imagery with right hand vs. left hand movement.
其中使用了第i类的输入平均值(在我们的例子中为两个)和两个变量之间的协方差的倒数(标准差)。 X被归类为产生最高判别函数值的类。 在评估两个类别的判别函数时,可以将所得方程式用于输入分类。 如果有两个以上的类,则在i个类中评估上面的函数; 但是,出于运动成像的目的,两个类别就足够了。 为了绘制天气示例中所示的决策边界,您可以从两个类的判别函数输出中获取两个斜率的平均值,这将准确地绘制两个数据集群之间的边界。 现在,让我们继续以右手与左手运动为例的运动图像示例。
LDA和汽车影像 (LDA and Motor Imagery)
As we established in Part 1, the data collected in the training phase is stored in a React Context so that it can be accessed at any time from any component. By creating a separate component for LDA, we can compartmentalize our code while still being able to pass values to and from that component. BCI.js’ LDA learn and classify can be used to learn the parameters from the training data and classify new points. In the learn function, the slope and intercept of the decision boundary are calculated, so there’s no need to implement the above calculations yourself. Before we can input data into the LDA learn function, we must compute the LDA parameters from CSP algorithms, which is shown below.
正如我们在第1部分中建立的那样,训练阶段收集的数据存储在React Context中,以便可以随时从任何组件访问它们。 通过为LDA创建一个单独的组件,我们可以划分代码,同时仍然能够与该组件之间传递值。 BCI.js的LDA 学习和分类可用于从训练数据中学习参数并分类新点。 在学习功能中,将计算决策边界的斜率和截距,因此无需自己执行上述计算。 在将数据输入LDA 学习功能之前,我们必须从CSP算法计算LDA参数,如下所示。
While we haven’t discussed CSP yet, we employ a CSP signal project algorithm to separate and amplify the two signals. The computeFeatures function is used to compute the parameters and amplify the signals of the training sets, which we can then use in the learn function to calculate the parameters of LDA. Below is a code snippet of the flow of data from pre-processing to LDA parameters.
尽管我们尚未讨论CSP,但我们采用了CSP信号投影算法来分离和放大两个信号。 该computeFeatures函数用于计算参数并放大训练集的信号,然后我们可以在学习函数中使用它来计算LDA的参数。 以下是从预处理到LDA参数的数据流的代码片段。
We first transpose the datasets to comply with matrix multiplication rules as explained earlier. Then, we learn the parameters for CSP so that we can isolate and amplify the two different signal types, one for right hand movement and the other for the left hand. We then generate feature vectors from the CSP parameters and each of the training sets which will aid in training the classifier. Next, the LDA parameters are learned and two variables, theta and b, are generated. Theta describes the change in x and y, and b describes the intercept of the linear function. The slope m is calculated by taking the negative change in y and dividing it by the change in x, and b is normalized using the distribution of the x-axis. We can use theta and b to describe an equation y = mx+b which defines our decision boundary. Below are two examples of LDA plotted and with a decision boundary.
我们首先对数据集进行转置 ,以符合前面所述的矩阵乘法规则。 然后,我们学习CSP的参数,以便我们可以隔离和放大两种不同的信号类型,一种用于右手运动,另一种用于左手。 然后,我们从CSP参数和每个训练集生成特征向量,这将有助于训练分类器。 接下来,学习LDA参数,并生成两个变量theta和b 。 Theta描述x和y的变化, b描述线性函数的截距。 斜率m是通过将y的负变化除以x的变化来计算的,而b使用x轴的分布进行归一化。 我们可以使用theta和b来描述方程y = mx + b ,它定义了我们的决策边界。 以下是绘制的LDA的两个示例,并带有决策边界。

This visualization represents two datasets comparing right and left hand movement. In this experiment, the subject physically moves either their left or right hand to collect two sets of training data. At the top of the image, a graph is shown in which the subject mixed both right and left hand movements in both training sets, which confused the model. In the bottom of the image, the subject thought of left hand movement in one training set and right hand movement in the other, and the model accurately separated the right hand dataset (red) and the left hand dataset (blue) based on signal amplitude and used the discriminant function to draw a decision boundary between the two datasets. With a properly trained model, testing data can be accurately classified based on the plotted line and users can visually see the classification of their brain waves.
该可视化表示比较右手和左手运动的两个数据集。 在此实验中,受试者会物理移动他们的左手或右手以收集两组训练数据。 在图像的顶部,显示了一个图形,其中受试者在两个训练集中混合了左右手的运动,这混淆了模型。 在图像的底部,受试者想到一个训练集中的左手运动而另一个训练集中的右手运动,并且该模型根据信号幅度准确地分离了右手数据集(红色)和左手数据集(蓝色)并使用判别函数在两个数据集之间绘制决策边界。 使用经过适当训练的模型,可以根据绘制的线对测试数据进行准确分类,并且用户可以直观地看到其脑电波的分类。
That’s all for LDA! We covered the mathematics behind the algorithm and how it can be applied to draw decision boundaries in motor imagery experiments. Next, we will cover common spatial pattern (CSP) algorithms and how they can be used to isolate signals to aid in classification.
LDA就这些了! 我们介绍了该算法背后的数学原理,以及如何将其应用于运动图像实验中的决策边界。 接下来,我们将介绍常见的空间模式(CSP)算法以及如何将其用于隔离信号以帮助分类。
常见的空间格局 (Common Spatial Patterns)
Another type of algorithm used for the classification of motor states in multi-channel EEG devices is the common spatial pattern, or CSP. The method uses linear transformations to project the multi-channel EEG signals into a subspace to generate spatial pattern vectors. In this section, since our weather example in the previous paragraph doesn’t apply, we will use our recurring example of right hand vs. left hand movement classification. While we won’t cover the mathematics of a common spatial pattern as it is beyond the scope of this series, examples of CSP with respect to motor imagery will be explored.
用于在多通道EEG设备中进行运动状态分类的另一种算法是通用空间模式或CSP。 该方法使用线性变换将多通道EEG信号投影到子空间中以生成空间模式向量。 在本节中,由于前面段落中的天气示例不适用,因此将使用我们的右手与左手运动分类的重复示例。 虽然我们不会涵盖常见空间模式的数学知识,因为它不在本系列的范围之内,但我们将探索有关运动图像的CSP示例。
CSP algorithms essentially isolate and project signals. To use an example, if you have two audio signals playing at the same time, a CSP algorithm can isolate and project the signals onto the same subspace, allowing you to analyze both individually. We’ve seen a similar example of this with motor imagery and LDA, where the CSP algorithm projected the two signals (right hand vs. left hand) on two separate axes. An example of this is shown below, where the red points represent right hand movement and the blue points represent left hand movement. The red points are projected across the x-axis and the blue points are projected along the y-axis, which is key for the LDA to generate parameters from each signal. The green points are from the testing set, and are projected across both axes, meaning that there was both right and left hand movements.
CSP算法本质上隔离并投影信号。 以一个示例为例,如果您同时播放两个音频信号,则CSP算法可以将信号隔离并将其投影到同一子空间,从而使您可以分别分析这两个信号。 我们在电机图像和LDA上看到了类似的示例,其中CSP算法将两个信号(右手和左手)投射在两个单独的轴上。 下面显示了一个示例,其中红色点代表右手移动,蓝色点代表左手移动。 红点沿x轴投影,蓝点沿y轴投影,这是LDA从每个信号生成参数的关键。 绿点来自测试集,并且投影在两个轴上,这意味着左右手都在运动。

CSP algorithms don’t act as a form of learning itself, but rather processes the data to make the learning process easier. BCI.js combines CSP and LDA to create a powerful system for processing and classification. However, there are other forms of processing such as Fourier transforms that can provide even better accuracy and performance. Fourier transforms can be combined with support-vector machine (SVM) algorithms to provide a higher classification accuracy in certain situations. We will discuss that system in Part 3. However, to build a simple classification system, CSP is a great processing method to better help classification algorithms extract features from EEG data.
CSP算法本身并不是学习的一种形式,而是处理数据以简化学习过程。 BCI.js结合了CSP和LDA,以创建一个功能强大的系统进行处理和分类。 但是,还有其他形式的处理,例如傅立叶变换 ,可以提供更好的准确性和性能。 傅里叶变换可以与支持向量机(SVM)算法结合使用,以在某些情况下提供更高的分类精度。 我们将在第3部分中讨论该系统。但是,对于构建简单的分类系统而言,CSP是一种很好的处理方法,可以更好地帮助分类算法从EEG数据中提取特征。
结论 (Conclusion)
In this article, we have covered BCI.js, experimentation flow, and the CSP-LDA classification model combination. You can now implement this solution to start extracting meaningful data from brain waves. Below are some helpful tips:
在本文中,我们介绍了BCI.js,实验流程和CSP-LDA分类模型组合。 现在,您可以实施此解决方案以开始从脑电波中提取有意义的数据。 以下是一些有用的提示:
Remember to check the version on your Muse and charge it fully for the best performance. Sometimes different versions of Muse require alteration of the MuseClient configuration (from Part 1) in the source code.
切记检查Muse上的版本并充分充电以达到最佳性能。 有时,不同版本的Muse要求更改源代码中的MuseClient配置(来自第1部分 )。
- Try and create a timer to ensure the storage array is full before moving onto machine learning so that there is consistency in the datasets. 在进行机器学习之前,尝试创建一个计时器以确保存储阵列已满,以确保数据集中的一致性。
Always output a performance metric to check the accuracy of your model. BCI.js has a confusion matrix function that can help you calculate model accuracy.
始终输出性能指标以检查模型的准确性。 BCI.js具有混淆矩阵功能,可以帮助您计算模型的准确性。
In Part 3 of the series, we will build on our discussion of machine learning by diving into some more complex algorithms, such as Fourier transforms and SVM algorithms. We will also cover a way to improve model accuracy and data quality through a method known as a data bandpass filter.
在本系列的第3部分中,我们将通过深入研究一些更复杂的算法,例如傅立叶变换和SVM算法,来建立关于机器学习的讨论。 我们还将介绍一种通过称为数据带通滤波器的方法来提高模型准确性和数据质量的方法。
Stay tuned for Part 3!
请继续关注第3部分!
翻译自: https://towardsdatascience.com/whats-on-your-mind-a8f556af8839


 5万+
5万+

 被折叠的 条评论
为什么被折叠?
被折叠的 条评论
为什么被折叠?
 到【灌水乐园】发言


