


数据库功能
Pandas has four main time related classes. Timestamp, DatetimeIndex, Period, and PeriodIndex.
熊猫有四个主要的时间相关类。 时间戳,DatetimeIndex,Period和PeriodIndex。
First, let’s look at Timestamp. Timestamp represents a single timestamp and associates values with points in time. For example, let’s create a timestamp using a string 9/1/2016 10:05AM, and here we have our timestamp. Timestamp is interchangeable with Python’s datetime in most cases.
首先,让我们看一下时间戳。 时间戳表示单个时间戳,并将值与时间点关联。 例如,让我们使用字符串9/1/2016 10:05 AM创建一个时间戳,这里有我们的时间戳。 大多数情况下,时间戳可以与Python的日期时间互换。
Suppose we weren’t interested in a specific point in time, and instead wanted a span of time. This is where Period comes into play.Period represents a single time span, such as a specific day or month.Here we are creating a period that is January 2016, and here’s an example of a period that is March 5th, 2016.
假设我们对特定的时间点不感兴趣,而是想要一段时间。 这是《时代》发挥作用的地方。 期间代表一个单一的时间跨度,例如特定的一天或一个月。这里我们创建的期间为2016年1月,下面是一个示例的期间为2016年3月5日。
The index of a timestamp is DatetimeIndex. Let’s look at a quick example. First, let’s create our example series t1, we’ll use the Timestamp of September 1st, 2nd and 3rd of 2016. When we look at the series, each Timestamp is the index and has a value associated with it, in this case, a, b and c.
时间戳记的索引为DatetimeIndex 。 让我们看一个简单的例子。 首先,让我们创建示例系列t1,我们将使用2016年9月1日,2日和3日的时间戳记。在查看该序列时,每个时间戳记都是索引并具有与其相关的值,在这种情况下, ,b和c。
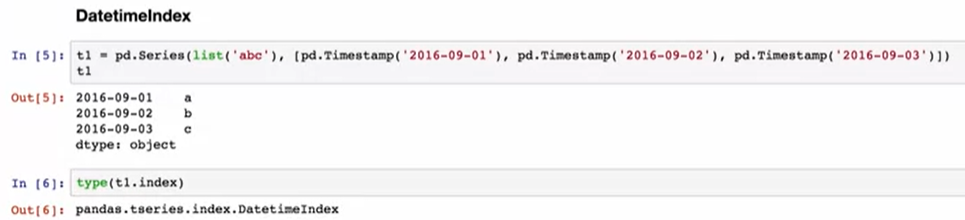
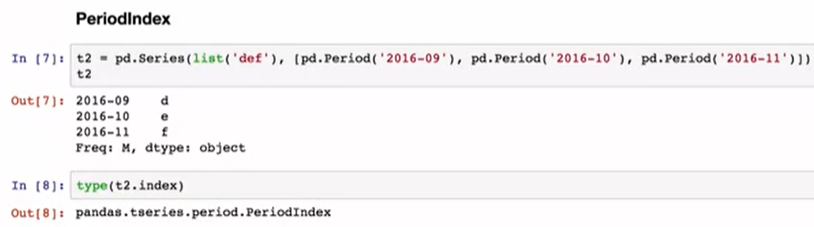
Looking at the type of our series index, we see that it’s DatetimeIndex. Similarly, the index of period is PeriodIndex. Let’s create another example series t2. This time, we’ll use the values d, e, and f and match them with the period September, October and November 2016. Looking at the type of the ts2.index, we can see that it’s PeriodIndex.
查看系列索引的类型,我们看到它是DatetimeIndex。 同样,期间的索引是PeriodIndex。 让我们创建另一个示例系列t2。 这次,我们将使用值d,e和f并将它们与2016年9月,10月和11月的时间段进行匹配。查看ts2.index的类型,我们可以看到它是PeriodIndex。
Now, let’s look into how to convert to Datetime. Suppose we have a list of dates as strings. If we create a DataFrame using these dates as the index. And some randomly generated data, this is the DataFrame we get.
现在,让我们看一下如何转换为Datetime 。 假设我们有一个日期列表作为字符串。 如果我们使用这些日期作为索引创建一个DataFrame。 还有一些随机生成的数据,这就是我们得到的DataFrame。
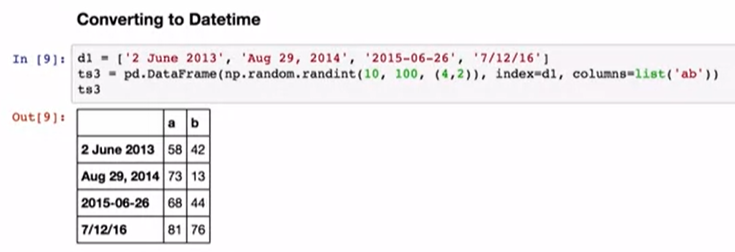
Looking at the index we can see that it’s pretty messy and the dates are all in different formats.
查看索引,我们可以看到它很凌乱,日期都采用不同的格式。
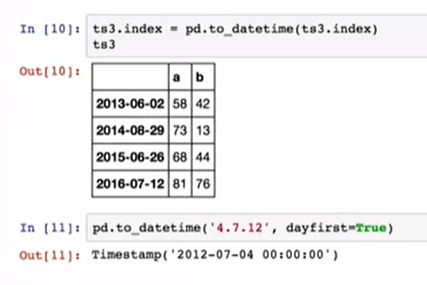
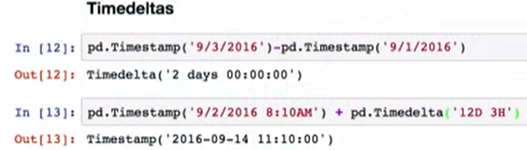
Using pandas to_datetime, pandas will try to convert these to Datetime and put them in a standard format. to_datetime also has options to change the date parse order. For example, we can pass in the argument dayfirst = True to parse the date in European date format.Timedeltas are differences in times. We can see that when we take the difference between September 3rd and September 1st, we get a Timedelta of two days. We can also do something like find what the date and time is for 12 days and three hours past September 2nd, at 8:10 AM.
使用pandas to_datetime,pandas会尝试将它们转换为Datetime并将其放置为标准格式。 to_datetime还具有更改日期解析顺序的选项。 例如,我们可以传入参数dayfirst = True来解析欧洲日期格式的日期.Timedeltas是时间差。 我们可以看到,当我们采用9月3日和9月1日之间的差额时,我们将获得两天的Timedelta。 我们还可以执行一些操作,例如查找9月2日上午8:10之前的12天零3个小时的日期和时间。
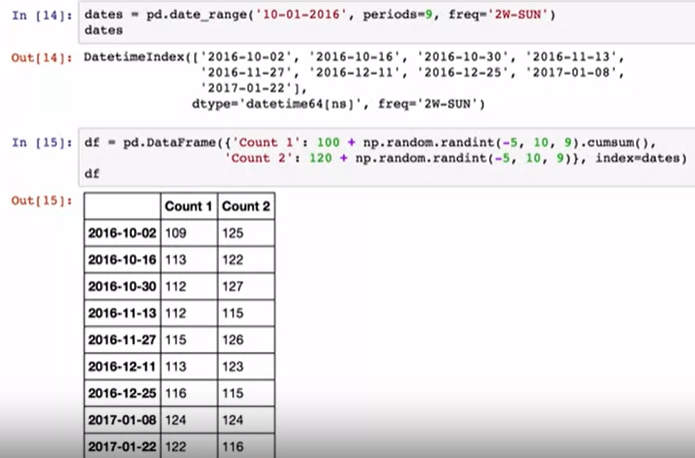
Next, let’s look at a few tricks for working with dates in a DataFrame.Suppose we want to look at nine measurements, taken bi-weekly, every Sunday, starting in October 2016. Using date_range, we can create this DatetimeIndex.Now, let’s create a DataFrame using these dates, and some random data, and see what we can do with it.
接下来,让我们看一下在DataFrame中处理日期的一些技巧。假设我们要查看从2016年10月开始的每个星期日每两周进行九次测量。使用date_range,我们可以创建此DatetimeIndex。现在,让我们使用这些日期和一些随机数据创建一个DataFrame,然后看看我们可以用它做什么。
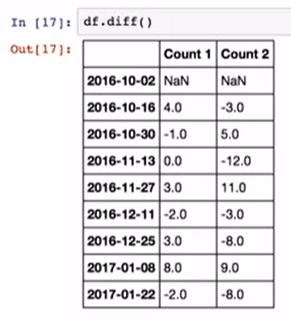
First, we can check what day of the week a specific date is. For example, here we can see that all the dates in our index are on a Sunday. We can use diff to find the difference between each date’s value.
首先,我们可以检查特定日期是星期几。 例如,在这里我们可以看到索引中的所有日期都在星期日。 我们可以使用diff查找每个日期的值之间的差异。
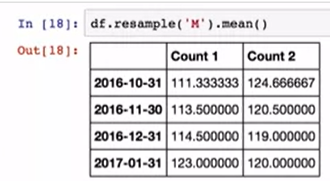
Suppose we wanted to know what the mean count is for each month in our DataFrame. We can do this using resample.
假设我们想知道DataFrame中每个月的平均计数是多少。 我们可以使用重采样来做到这一点。
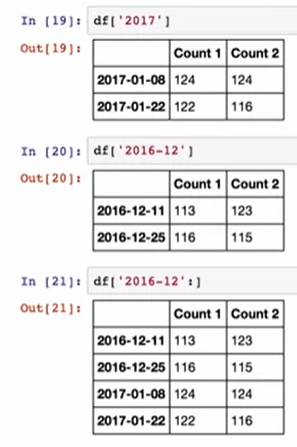
We can use partial string indexing to find values from a particular year, or from a particular month, or we can even slice on a range of dates. For example, here we only want the values from December 2016 onwards.
我们可以使用部分字符串索引来查找特定年份或特定月份的值,甚至可以分割日期范围。 例如,这里我们只需要从2016年12月开始的值。
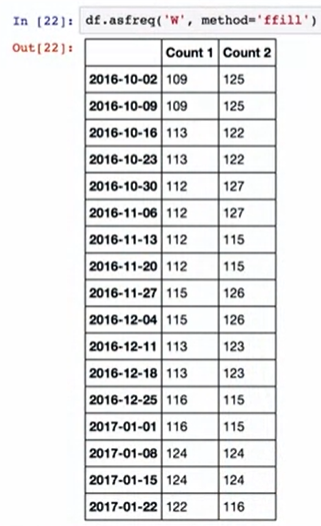
Another cool thing we can do is change the frequency of our dates in our DataFrame using asfreq. If we use this to change the frequency from bi-weekly to weekly, we’ll end up with missing values every other week. So let’s use the forward fill method on those missing values.
我们可以做的另一件很酷的事情是使用asfreq更改DataFrame中日期的频率。 如果我们使用此方法将频率从每两周一次更改为每周一次,则最终每两周就会丢失值。 因此,让我们对那些缺少的值使用正向填充方法。
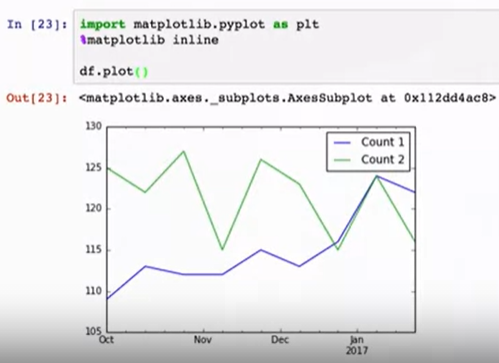
One last thing I wanted to briefly touch upon is plotting time series. Importing matplotlib.pyplot, and using the iPython magic %mapplotlib inline, will allow you to visualize the time series in the notebook.
我想简要介绍的最后一件事是绘制时间序列。 导入matplotlib.pyplot ,并使用iPython魔术%mapplotlib inline ,将使您可以在笔记本中可视化时间序列。
https://www.coursera.org/learn/python-data-analysis/lecture/31dEi/date-functionality
https://www.coursera.org/learn/python-data-analysis/lecture/31dEi/date-functionality
翻译自: https://medium.com/python-in-plain-english/data-functionality-58a3f99ed158
数据库功能


 2206
2206


 被折叠的 条评论
为什么被折叠?
被折叠的 条评论
为什么被折叠?
 到【灌水乐园】发言


