


 本文介绍了多重共线性在回归分析中的概念及其影响。多重共线性发生在自变量间存在高度相关时,使得模型难以区分各自变量对因变量的单独影响。文章探讨了多重共线性的成因,如虚拟变量使用不当和变量间的计算关系。通过实例展示了如何通过相关分析和方差膨胀因子(VIF)检测多重共线性。同时,解释了VIF为何优于相关分析,并提出了解决多重共线性的策略,包括忽略、删除相关变量、组合变量以及使用主成分分析。最后,文章提供了真实世界的例子,如跑步消耗热量与距离、圈数和睡眠时间的关系,以及分类变量的虚拟变量设置,以进一步阐明多重共线性问题。
Regression is the way of describing the relationship between a dependent variable and independent variables. What if the independent variables are related to themselves? This concept is called multicollinearity.
回归是描述因变量和自变量之间关系的方式。 如果自变量与自身相关怎么办? 这个概念称为多重共线性。
Multicollinearity is a state of very high correlation among the independent variables, i.e. A predictor variable can be used to predict another predictor variable.
多重共线性是自变量之间具有非常高相关性的状态,即,可以使用一个预测变量来预测另一个预测变量。
Both the independent features have a similar impact on the dependent variable so the regression model fails to understand the individual effect of each independent variables on the dependent variable.
这两个独立特征对因变量的影响相似,因此回归模型无法理解每个独立变量对因变量的影响。
多重共线性的原因。 (Reasons for multicollinearity.)
- It can be caused by the inaccurate use of dummy variables. 这可能是由于虚拟变量使用不正确引起的。
- It can be caused by the inclusion of a variable which is computed from other variables in the data set. 这可能是由于包含了一个变量,该变量是根据数据集中的其他变量计算得出的。
- Multicollinearity can also result from the repetition of the same kind of variable.- e.g. Sex and Gender 多重共线性也可能源于相同种类变量的重复。例如,性别和性别
让我们考虑以下情况-(Let us consider the following scenario -)
Salary of a person in an organization is a function of ‘Years of experience’, ‘Age’, ‘X3’,’ X4’…
组织中人员的薪水取决于“经验年限”,“年龄”,“ X3”,“ X4” ...
Salary = β0+ β1 (“Years of experience”)+ β2(“Age”)+…
工资=β0 +β1(“多年的经验”)+β2(“时代”)+ ...
β1 — The marginal effect on salary for an additional unit in Years of experience, holding other variables constant
β1-在多年经验中,在其他变量不变的情况下,增加单位对工资的边际影响
β2- The marginal effect on salary for an additional unit of Age, holding other variables constant
β2-在其他变量不变的情况下,附加年龄单位对工资的边际影响
Multicollinearity is when the independent variables themselves are correlated so that the individual effects are obscure.
多重共线性是指自变量本身相互关联,从而使各个影响不明确的情况。
What regression does is it tears apart the individual effect of β1 and β2 on “Salary”.
回归的作用是破坏了β1和β2对“工资”的单独影响。
But, the problem here is, the more experienced a person is, probably the older they get at the same time. So regression can’t differentiate the impact of ‘Years of experience’ and ‘Age’ on ‘Salary’,
但是,这里的问题是,一个人越有经验,可能同时变得越老。 因此,回归无法区分“经验年”和“年龄”对“薪资”的影响,
It fails to understand whether the increase in “Age” has led to an increased “Salary” or increase in “Years of experience” have led to an increased “Salary”.
它无法理解“年龄”的增加是否导致“薪水”的增加,还是“经验年限”的增加导致“薪水”的增加。
那么我们可以保持其他变量不变吗? (So can we hold the other variables constant?)
Let’s see an with an example.
让我们来看一个例子。
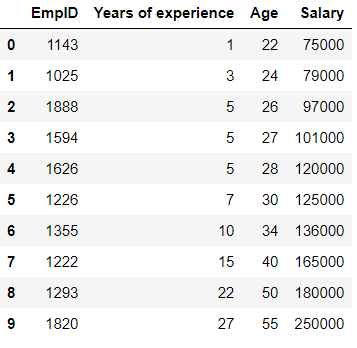
Consider the following Data frame -
考虑以下数据框-
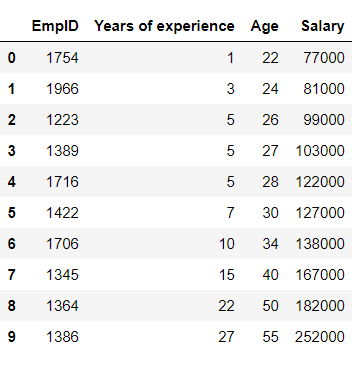
From this data, we will build a regression model to predict salary.
根据这些数据,我们将建立回归模型来预测薪水。
CODE:
码:
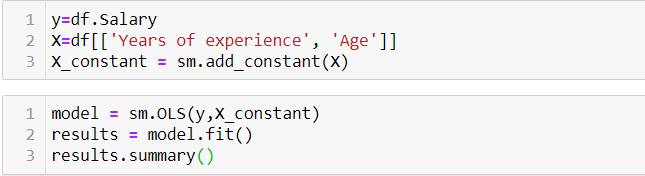
OUTPUT:
输出:
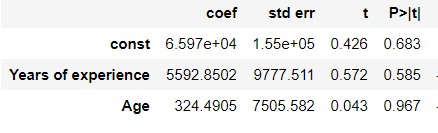
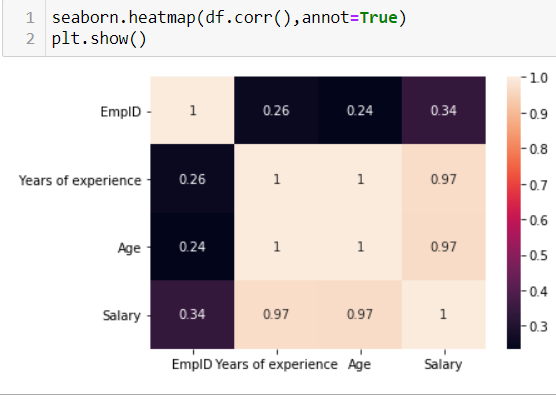
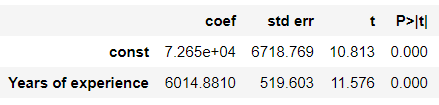
In this case, the independent variables (Years of experience and Age) are positively correlated to the dependent variable (Salary).
在这种情况下,自变量(经验和年龄)与因变量(工资)呈正相关。
- 1 unit increase in ‘Years of experience’ will lead 5592.85 unit increase in ‘Salary’. “经验年”增加1个单位将导致“工资”增加5928.85个单位。
- 1 unit increase in ‘Age’ will lead 324.49 unit increase in ‘Salary’. “年龄”的每增加1单位将导致“工资”的每增加324.49。
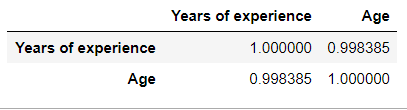
We know that as Years of experience increases the age of the person also increases. They are positively correlated.
我们知道,随着年龄的增长,人的年龄也会增加。 它们是正相关的。
CODE:
码:

OUTPUT:
输出:
This is the reason for the high standard error for both the independent variables.
这是两个自变量都具有高标准误差的原因。
And their p values are greater than the alpha value (0.05), This means neither of the independent variables are significant.
并且它们的p值大于alpha值(0.05),这意味着两个自变量都不是显着的。
Multicollinearity makes it tedious to assess the relative importance of the independent variables in explaining the variation caused by the dependent variable.
多重共线性使得评估自变量在解释因变量引起的变化方面的相对重要性变得乏味。
多共线性如何影响模型? (HOW MULTICOLINEARITY AFFECTS THE MODEL?)
The coefficients here are still unbiased. They are the best guess for our β1 and β2, but they are very sensitive. Multicollinearity also makes the estimates very sensitive to minor changes in specification. So, if β1 and β2 are correlated, it inflates the variance of affected variables. Their Stander Error would shoot such that both the p values are high, and neither of these 2 variables seems to be statistically significant. It is like both of these variables are fighting for the effect on salary, but gets on each other’s way as they move in the same direction. Regression is having tough time teasing apart the effect on salary from each variable. So the Standard Error gets very high.
这里的系数仍然没有偏见。 它们是对我们的β1和β2的最佳猜测,但它们非常敏感。 多重共线性还使估计值对规格的微小变化非常敏感。 因此,如果β1和β2相关,则会扩大受影响变量的方差。 他们的标准错误会导致p值都很高,而这两个变量似乎都没有统计学意义。 就像这两个变量都在争夺薪水的影响一样,但是当它们朝着相同的方向移动时,它们会互相影响。 回归正面临艰难的时光,难以将每个变量对薪资的影响分开。 因此,标准误会很高。
如何检测多重冲突。 (HOW TO DETECT MULTICOLLINEARITY.)
1。 二元相关分析 (1 . Bivariate correlation analysis–)
0 to 0.5 — Low positive correlation
0至0.5-低正相关
0.5 to 1.0 — High positive correlation
0.5至1.0 —高正相关
0 to -0.5 — Low negative correlation
0至-0.5 —低负相关
-0.5 to -1.0 — High negative correlation
-0.5至-1.0-高负相关
相关性有多少?(HOW MUCH IS TOO MUCH CORRELATION?)
Commonly correlation value between -0.5 to 0.5 is considered okay. But there is no rule of thumb. It depends on the data we handle.
通常认为-0.5到0.5之间的相关值可以。 但是没有经验法则。 这取决于我们处理的数据。
2.方差膨胀系数(VIF)— (2. Variance inflation factor (VIF) —)
The variance inflation factor (VIF) quantifies the extent of correlation between one predictor and the other predictors in a model
方差膨胀因子(VIF)量化了模型中一个预测变量与其他预测变量之间的相关程度
A VIF can be computed for each predictor in a predictive model.
可以为预测模型中的每个预测变量计算VIF 。
- A value of 1 means that the predictor is not correlated with other variables. 值为1表示预测变量与其他变量不相关。
- The higher the value, the greater the correlation of the variable with other variables. 值越高,变量与其他变量的相关性越大。
- Values of more than 4 or 5 are sometimes regarded as being moderate to high, with values of 10 or more being regarded as very high. 有时将大于4或5的值视为中等到高,将10或更大的值视为非常高。
These numbers are just rules of thumb; in some contexts, a VIF of 2 could be a great problem (e.g., if estimating price elasticity), whereas, in straightforward predictive applications, very high VIFs may be unproblematic.
这些数字只是经验法则。 在某些情况下, VIF为2可能是个大问题(例如,如果估计价格弹性) ,而在直接的预测应用中,非常高的VIF可能没有问题。
If one variable has a high VIF it means that other variables must also have high VIFs. In the simplest case, two variables will be highly correlated, and each will have the same high VIF.
如果一个变量具有较高的VIF,则意味着其他变量也必须具有较高的VIF。 在最简单的情况下,两个变量将高度相关,并且每个变量都具有相同的高VIF。
VIF is more robust, we are no longer looking at bivariate relation. In VIF we take 1 feature at a time and create a linear regression model.
VIF更强大,我们不再关注双变量关系。 在VIF中,我们一次采用1个特征并创建线性回归模型。
Suppose there are 4 independent feature — X1, X2, X3, X4
假设有4个独立功能-X1,X2,X3,X4
VIF shows how much X1 is being explained by the 3 other variables and how much of its information is already contained in the 3 other variables.
VIF显示了其他三个变量正在解释多少X1,其他三个变量中已经包含了多少信息。
手动计算VIF (Manual Calculation of VIF)
X1 = β0+ (β1*X2)+ (β2*X3)+ (β3*X4)
X1 =β0 +(β1 * X2)+(β2 * X3)+(β3 * X4)
Then we build a statistical linear model and calculate R2
然后我们建立统计线性模型并计算R2
VIF(X1)= 1/(1-R2)
VIF(X1)= 1 /(1-R2)
So suppose R2 is 0.8
因此,假设R2为0.8
VIF(X1)= 1/(1–0.8) = 5
VIF(X1)= 1 /(1-0.8)= 5
CODE:
码:

OUTPUT:
输出:
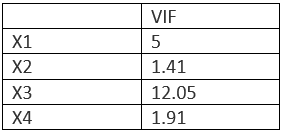
Here X3 has a VIF score of 12. That means X3 is being explained by the other 3 variables.
这里X3的VIF分数为12。这意味着X3由其他3个变量解释。
VIF有多少? (HOW MUCH IS TOO MUCH VIF?)
Normally the threshold is 5 or 10, depending on the data. 3 is used as a threshold if data is huge and of good quality — like audited finance reports.
通常,阈值是5或10,具体取决于数据。 如果数据量巨大且质量良好(例如,经过审核的财务报告),则使用3作为阈值。
为什么VIF优于相关分析? (Why VIF better than correlation analysis?)
Correlation is bivariate, i.e. it can show the connection between 2 variable at a time whereas in VIF, X1 can have a weak connection with all the variables, but those week connections together can lead to multicollinearity as well
相关性是双变量的,即一次可以显示两个变量之间的联系,而在VIF中, X1与所有变量之间的联系很弱,但是那些周联系在一起也可以导致多重共线性
多重冲突解决方案(SOLUTION TO MULTICOLLINEARITY)
1.忽略多重共线性–(1. Ignore multicollinearity–)
If the model is used for prediction only, then the standard error of the coefficients are not important. As long the coefficients themselves are unbiased, which they are, we can use our model for prediction. It’s not like it invalidate all the other variables in the model.
如果该模型仅用于预测,则系数的标准误差并不重要。 只要系数本身是无偏的,我们就可以使用模型进行预测。 这并不是使模型中的所有其他变量无效。
If the correlated variables are not of particular interest to study question — e.g. If our target variable is ‘Sales’ in an organization and our objective is to find the impact of ‘Advertisement’ on ‘Sales’. Even if some other independent features are correlated, we can just ignore them.
如果相关变量对研究问题不是特别感兴趣,例如,如果我们的目标变量是组织中的“销售”,而我们的目标是发现“广告”对“销售”的影响。 即使其他一些独立功能相关联,我们也可以忽略它们。
If the correlation is not extreme.
如果相关性不是极端的话。
2.删除相关变量之一- (2. Remove one of the correlated variables -)
If the variables are providing the same information- e.g. ‘Height’, ‘Weight’ and ‘BMI’ will have high VIF score. We can drop ‘Height’ and ‘Weight’ as BMI comprises of height and weight.
如果 这些变量提供相同的信息-例如'Height','Weight'和'BMI'将具有较高的VIF分数。 由于BMI由身高和体重组成,因此我们可以删除“身高”和“体重”。
NOTE: Beware of omitted variable bias.
注意:当心遗漏的变量偏差。
3.结合相关变量- (3. Combine the correlated variables-)
‘Years of experience’ and ‘Age’ — can be combined to create a new feature ‘Seniority score’, So that there is no information loss.
可以将“年限”和“年龄”组合在一起以创建新功能“高级分数”,从而不会丢失任何信息。
4. PCA- (4. PCA -)
PCA is a way to deal with highly correlated variables, so there is no need to remove them.
PCA是处理高度相关变量的一种方法,因此无需删除它们。
In the following data frame-
在以下数据框中-
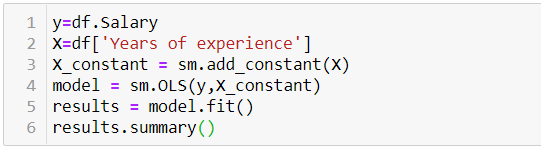
If we make a linear regression model for Salary with Years of experience variable alone.
如果我们为年数可变的薪水建立线性回归模型 单独。
CODE:
码:
OUTPUT:
输出:
The p-value is 0.00001 which is not surprising as years of experience effects salary.
p值为0.00001,这并不奇怪,因为多年的经验会影响工资。
Now add the ‘Age’ variable to the regression model — which is highly correlated to the values of ‘Years of experience’.
现在,将“年龄”变量添加到回归模型中,该变量与“经验年”的值高度相关。
Will the coefficients of years of experience change? Will SE or p-value change?
多年经验的系数会改变吗? SE或p值会改变吗?
OUTPUT:
输出:
The standard error increased but the coefficient almost remains the same. This proves coefficients are unbiased but SE did ramp up significantly.
标准误差增加,但是系数几乎保持不变。 这证明了系数是无偏的,但SE确实显着上升。
完美的多种族 (PERFECT MULTOCOLLINEARITY)
i.e. Coefficient = 1.0
即系数= 1.0
Perfect multicollinearity is when one of the regressors is an exact linear function of the other regressors
完美的多重共线性是指其中一个回归变量是其他回归变量的精确线性函数
If there are 2 perfectly collinear variables, the model fails. We can’t get any regression output. The model is trying to ease out individual effects but we haven’t given any leverage to tease out the individual effect.
如果存在2个完全共线的变量,则模型将失败。 我们无法获得任何回归输出。 该模型正在尝试减轻个体影响,但我们尚未发挥任何杠杆作用来消除个体影响。
真实的例子 (REAL WORLD EXAMPLES)
Calories burned by a runner in a track = β0+ β1(‘Distance’)+ β2 (‘Laps’)+ β3(‘Hours slept the previous night’) + β4( BMI) +…
热量在轨道=β0 +β1( '距离')+β2( '圈')燃烧由浇道+β3( '小时睡前一晚')+β4(BMI)+ ...
- So if one lap is 200m, we know Distance = no of laps *200. So there is no extra info provided both contain the same info — Here we have to remove one variable. They provide the same info just in different units. 因此,如果一圈是200m,我们知道距离=圈数* 200。 因此,没有多余的信息,只要它们都包含相同的信息-在这里我们必须删除一个变量。 它们只是以不同的单位提供相同的信息。
2. Dummy variable — Dummy variables created for a categorical variable with 4 categories, We have to drop any one of the 4 dummy variables to avoid multicollinearity.
2.虚拟变量-为具有4个类别的分类变量创建的虚拟变量,我们必须删除4个虚拟变量中的任何一个以避免多重共线性。
Suppose the dummy variable for categorical variable City are –city1, city2, city3, city4
假设类别变量City的虚拟变量为–city1,city2,city3,city4
DATASET:
数据集:
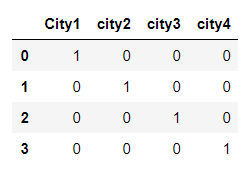
In the above data frame with 4 dummy variable, 1 indicates True and 0 indicate False.
在上述具有4个虚拟变量的数据帧中,1表示True,0表示False。
We can observe from the 1st row that the ‘City’ is city1,
从第一行我们可以看到“城市”是city1,
But if we check the correlation between city1, city2, city3 and city4.
但是,如果我们检查city1,city2,city3和city4之间的相关性。
Output:
输出:
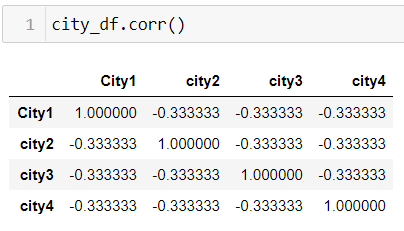
We can see that these features are equally correlated among themselves. This is because 1 feature among the 4 can be calculated without having to be a separate variable.
我们可以看到这些功能在它们之间是同等相关的。 这是因为可以计算4个特征中的1个特征,而不必将其作为单独的变量。
We can make use of drop_first parameter while creating dummy to avoid this correlation between the dummy variables.
我们可以在创建虚拟变量时使用drop_first参数,以避免虚拟变量之间的这种相关性。
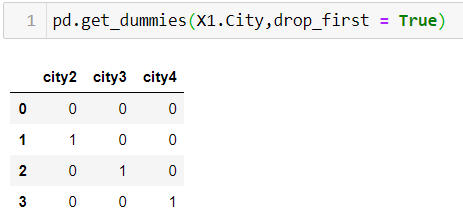
Since the values in the first row for the columns city2,city3 and city4 are 0, 0 and 0 respectively, it is a representation of city 1.
由于第一行中的city2,city3和city4列的值分别为0、0和0,因此它表示城市1。
city1 is a linear combination of city2, city3 and city4
city1是city2,city3和city4的线性组合
i.e. city1 = 1 - city2- city3- city4
即city1 = 1-city2- city3- city4
Wooldridge has a good discussion of multicollinearity in Chapter 3 of his book Introductory Econometrics.- https://economics.ut.ac.ir/documents/3030266/14100645/Jeffrey_M._Wooldridge_Introductory_Econometrics_A_Modern_Approach__2012.pdf
Wooldridge在他的《计量经济学概论》的第3章中对多重共线性进行了很好的讨论。- https://economics.ut.ac.ir/documents/3030266/14100645/Jeffrey_M._Wooldridge_Introductory_Econometrics_A_Modern_Approach__2012.pdf
结论 (Conclusion)
In this article, we had a detailed walkthrough on basics of Multicollinearity, how it affects our model, how to detect it and resolve the problem with some real-world examples.
在本文中,我们详细介绍了多重共线性的基础知识,它如何影响我们的模型,如何检测模型以及如何通过一些实际示例解决问题。
翻译自: https://medium.com/analytics-vidhya/multicollinearity-a-beginners-guide-fea13d01a171


 被折叠的 条评论
为什么被折叠?
被折叠的 条评论
为什么被折叠?
 到【灌水乐园】发言


