


回归分析检验
Regression analysis is a reliable method in statistics to determine whether a certain variable is influenced by certain other(s). The great thing about regression is also that there could be multiple variables influencing the variable of interest. Regression analysis can be used for prediction.
回归分析是统计中确定某个变量是否受某些其他变量影响的可靠方法。 回归的伟大之处还在于,可能会有多个变量影响目标变量。 回归分析可用于预测。
You have to understand the two types of variables to get started with regression analysis:
您必须了解两种类型的变量才能开始回归分析:
Dependent variable — the variable that you want to examine, understand or predict.
因变量-您要检查,理解或预测的变量。
Independent variable(s) — all the other variables that you hypothisize to influence the dependent variable.
自变量—您假设的所有其他变量都会影响因变量。
In order to start the regression analysis, the dependent variable should be chosen. Then the independent variable or variables should be chosen which you hypothesize to affect the dependent variable.
为了开始回归分析,应选择因变量。 然后应选择一个或多个您假设会影响因变量的自变量。
The next step is obtaining data for the regression analysis. This is usually a dataset that has the identified dependent and independent variables. As an instance, if there are separate datasets available for each of the variables, the variables of interest can be extracted and combined into a new dataset.
下一步是获取用于回归分析的数据。 这通常是具有已标识的因变量和自变量的数据集。 例如,如果每个变量都有单独的数据集,则可以提取感兴趣的变量并将其合并到新的数据集中。

After that, the data should be plotted. The dependent variable always goes on the x-axis and the independent variable on the y-axis.
之后,应绘制数据。 因变量始终在x轴上 ,而自变量始终在y轴上 。
From the plot, initial trends and correlation can be observed that suggest what kind of relationship the dependent and independent variables have. In the example to the left, the hypothetical data points have an increasing trend. As the independent variable increases the dependent increases as well.
从图中可以观察到初始趋势和相关性,它们表明因变量和自变量具有什么样的关系。 在左侧的示例中,假设的数据点呈上升趋势。 随着自变量的增加,因变量也随之增加。
A trend could be observed from the plot, but what is the precise degree to which the dependent variable is influenced by the independent? A regression line should be calculated. Usually, this can be done in software like STATA or Excel. The regression line is the best approximation of the data points on the plot.
从图中可以观察到趋势,但是因变量在多大程度上受到自变量的影响? 应该计算一条回归线。 通常,这可以在STATA或Excel之类的软件中完成。 回归线是图中数据点的最佳近似值。
In other words, explains Redman, “The red line is the best explanation of the relationship between the independent variable and dependent variable.”
换句话说,雷德曼解释说:“红线是对自变量和因变量之间关系的最好解释。”

计算回归线 (Calculating the regression line)
Calculating a regression line means finding a best-fit line for all the data points. For simple linear regression analysis, usually, the least-squares method is used.
计算回归线意味着找到所有数据点的最佳拟合线。 对于简单的线性回归分析,通常使用最小二乘法。
The linear regression line is a simple line of the form y=mx+b. In order to find the best-fit line for your data you need to first find the five summary statistics:
线性回归线是形式为y = mx + b的简单线。 为了找到最适合您的数据的行,您需要首先找到五个汇总统计信息:
Mean of the x values
x值的平均值

2. Mean of the y values
2. y值的平均值
3. The standard deviation of the x values (denoted sx)
3. x值的标准偏差(表示为sx )
4. The standard deviation of the y values (denoted sy)
4. y值的标准偏差(表示为sy )
5. The correlation between X and Y (denoted r)
5. X和Y之间的相关性(表示为r )
The formula for calculating the slope m of the regression line is the following:
回归线的斜率m的计算公式如下:

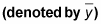
This formula calculates the slope for the regression line equation of the form y=mx+b. Now the last part to calculate is the y-intercept b. It can be calculated using the formula below:
该公式计算形式为y = mx + b的回归线方程的斜率。 现在要计算的最后一部分是y截距 b 。 可以使用以下公式计算:
are the means of the x values and y values respectively and m is the already calculated slope.
分别是x值和y值的均值, m是已经计算出的斜率。
The regression line that Excel will produce for example will look something like y=6x+70+error_term. This is different from the simple regression line that we calculated in that it has an error_term.
例如,Excel将产生的回归线将类似于y = 6x + 70 + error_term 。 这与我们计算的简单回归线不同,它具有error_term 。
Regression lines always consider an error term because in reality, independent variables are never precisely perfect predictors of dependent variables.
回归线总是考虑一个误差项,因为实际上,自变量从来都不是因变量的精确预测器。
In reality, the dependent term might be determined by a number of different factors. The regression line is only an estimate based on the data available to you and the larger the error term is the less definitely certain your regression line is.
实际上,从属项可能由许多不同的因素决定。 回归线只是基于您可用数据的估计值,误差项越大,确定线越不确定。
结论 (Conclusion)
Regression analysis helps determine effect of some variables on another. It is widely used in business analysis for determining different factors that influence the target variable and predict its future values.
回归分析有助于确定某些变量对另一个变量的影响。 它广泛用于业务分析中,以确定影响目标变量并预测其未来价值的不同因素。
We’ve discussed what regression analysis is and how to calculate the regression line.
我们已经讨论了什么是回归分析以及如何计算回归线。
翻译自: https://medium.com/swlh/regression-analysis-86e6a8bee0b7
回归分析检验


 6477
6477

 被折叠的 条评论
为什么被折叠?
被折叠的 条评论
为什么被折叠?
 到【灌水乐园】发言


