


帮助学生改善学习方法
There have been numerous studies looking into the relationship between sleep, exercise, leisure, studying and happiness. The results were often quite like how we expected, though there have been debates about the relationship between sleep and happiness. However, I was wondering if we could put it in the perspective of how we spend our time in general and seeing whether a balance of time spent in different aspects of our lives would influence our happiness levels.
有许多研究探讨睡眠,运动,休闲,学习和幸福之间的关系。 尽管对于睡眠与幸福之间的关系一直存在争论,但结果通常与我们的预期非常相似。 但是,我想知道我们是否可以从总体上如何度过时光的角度来看待,看看在生活的各个方面度过的时间平衡是否会影响我们的幸福感。
Rather than chasing after more sleep, or more exercise, how should we be spending our time across the board to increase our happiness?
与其追逐更多的睡眠或更多的运动,不如我们应该花很多时间来增加幸福感?
As a university student in Singapore, I decided to do a simple survey of my peers.
作为新加坡的一名大学生,我决定对同龄人进行简单调查。
资料说明: (Data description:)
Number of responses=45
回应数 = 45
Variables, keeping in mind that I am asking university students: — year of studies — gender — level of comfort around people (account for possible personality differences) — satisfaction (a good measure for happiness as it tends to be stable) — sleep hours (per day) — study hours (per day) — exercise hours (per week) — leisure hours (per week)
变量 ,请记住,我要问的是大学生:-学习年限-性别-人们周围的舒适度(考虑可能的人格差异)-满意度(幸福感的一种稳定的衡量标准,因为它趋于稳定)-睡眠时间每天)-学习时间(每天)-运动时间(每周)-闲暇时间(每周)
Next, I’ll be using Python through Jupyter Notebook to do some data cleaning. Starting with importing of the necessary packages and looking at the data.
接下来,我将通过Jupyter Notebook使用Python进行一些数据清理。 从导入必要的程序包开始,然后查看数据。
import pandas as pd
import matplotlib.pyplot as plt
import seaborn as sns
import statsmodels.api as sm
import numpy as np
import math#loading the data
data=pd.read_csv("Happiness and how we spend our time (Responses) - Form Responses 1.csv")
data.head()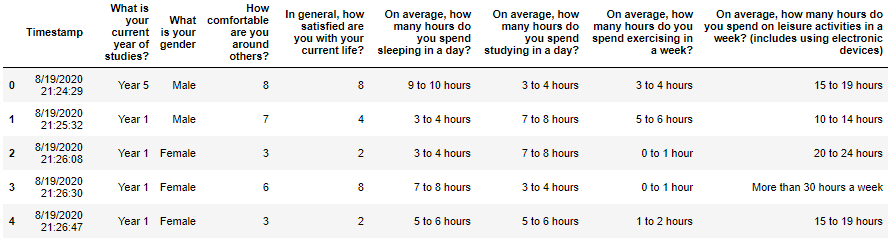
数据清理: (Data cleaning:)
1) Renaming the column header for simplicity
1)重命名列标题以简化操作
data.columns=['Year','Gender','Being around others','Happiness score','Sleep','Study','Exercise','Leisure']2) Converting from categorical to numerical by:
2)通过以下方式从分类转换为数值:
- taking the mean of the range of values, with a constant interval between each option (Note: get respondents to enter integers instead next time). 取值范围的平均值,每个选项之间的间隔是固定的(注意:下次让受访者输入整数)。
- replacing ‘Male’ and ‘Female’ with 1 and 0 and ‘year 1’ to ‘year 5’ to just ‘1’ to ‘5’. 用1和0替换“男”和“女”,将“ 1年”到“ 5年”替换为“ 1”到“ 5”。
data=data.replace({'Year 5':5, 'Year 4':4,'Year 3':3,'Year 2':2,'Year 1':1,'Male':0,'Female':1,'0 to 1 hour':0.5,'0 to 2 hours':1,'1 to 2 hours':1.5,'3 to 4 hours':3.5,'4 to 5 hours':4.5,'5 to 6 hours':5.5,'7 to 8 hours':7.5,'0 to 4 hours':2,'5 to 9 hours':7,'9 to 10 hours':9.5,'10 to 14 hours':12,'15 to 19 hours':17,'20 to 24 hours':22,'25 to 29 hours':27,'9 or more hours a week':9.5,'More than 30 hours a week':32})3) drop the ‘Timestamp’ column and dividing ‘exercise’ and ‘leisure’ values by 7 to get a daily value
3)删除“时间戳”列,并将“运动”和“休闲”值除以7,以获取每日值
data=data.drop('Timestamp',axis=1)#make weekly hours to daily
data['Exercise']=data['Exercise']/7
data['Leisure']=data['Leisure']/7
data.head()
4) Converting sleep, study, exercise and leisure to percentages.
4)将睡眠,学习,运动和休闲转化为百分比。
#get the hours variables
dv=data
dv=dv.drop(['Year','Gender','Being around others','Happiness score'],axis=1)#sum of rows
sumv=dv.sum(axis=1)#making it into percentages
dv['Sleep']=100*dv['Sleep']/sumv
dv['Study']=100*dv['Study']/sumv
dv['Exercise']=100*dv['Exercise']/sumv
dv['Leisure']=100*dv['Leisure']/sumv#replacing the values
data['Sleep']=dv['Sleep']
data['Study']=dv['Study']
data['Exercise']=dv['Exercise']
data['Leisure']=dv['Leisure']#looking at data
data.head()
Now that we have the data in the form that we’d like, we can start to create data visualizations. I’ve decided to focus on personality, % of hours (sleep, study, exercise and leisure) and the happiness score.
现在我们已经有了所需形式的数据,我们可以开始创建数据可视化了。 我决定专注于性格,工作时间百分比(睡眠,学习,锻炼和休闲)和幸福感分数。
分析: (Analysis:)
Personality and happiness:
个性与幸福:
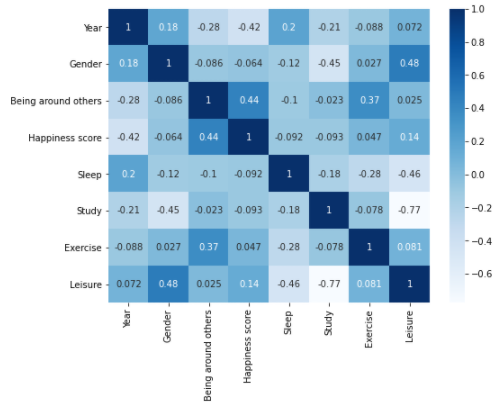
The following is the correlation heat map for those who rated themselves as being less comfortable around others (‘Being around others’<=5).
以下是针对那些自称在其他人周围不舒服(“在其他人周围” <= 5)的人的相关性热点图。
#set size
plt.rcParams['figure.figsize'] = (8, 6)#plot data desired
d = data.loc[lambda data: data['Being around others'] <= 5]
sns.heatmap(d.corr(), cmap = 'Blues', annot = True)
plt.show()
Mean for sleep=42.11%, mean for leisure=13.98%, mean happiness score=4.92. Notice that the correlation between happiness and sleep was the highest at 0.52, correlation between happiness and leisure was -0.37.
睡眠平均值= 42.11%,休闲平均值= 13.98%,幸福分数= 4.92。 注意,幸福与睡眠之间的相关性最高,为0.52 ,幸福与休闲之间的相关性为-0.37。
Compare this to those who rated themselves as being more comfortable around others (‘Being around others’>5).
将此与那些认为自己在他人周围更自在的人(“在他人周围”> 5)进行比较。

Mean for sleep=45.64%, mean for leisure=15.21%, mean happiness score=6.81. The correlation between happiness and sleep was the highest at 0.24, correlation between happiness and leisure was -0.0028.
睡眠平均值= 45.64%,休闲平均值= 15.21%,幸福分数= 6.81。 幸福与睡眠的相关性最高,为0.24,幸福与休闲的相关性为-0.0028 。
Every other correlation was surprisingly negative! Although I expected sleep to have a high correlation with happiness as people may prefer to be alone, activities like leisure having a negative correlation with happiness is quite unexpected. This seems to suggest that for people who are less comfortable around others are more likely to be influenced by the amount of time they spend sleeping, while the other factors do not seem to be an important factor that influences their happiness. At the same time, spending more time on leisure appears to have a negative correlation with their happiness, though this may not be as prominent in people who rated themselves as being more comfortable with others.
其他所有相关性都令人惊讶地为负! 尽管我期望人们可能更喜欢一个人,但睡眠与幸福具有高度相关性,但休闲等活动与幸福具有负相关性却是出乎意料的。 这似乎表明,对于那些与他人较不舒服的人,他们更可能会受到睡眠时间的影响,而其他因素似乎并不是影响他们幸福感的重要因素。 同时,花更多的时间在休闲上似乎与他们的幸福感呈负相关,尽管这在那些认为自己与他人更舒适的人中并不那么突出。
If we take a look at the mean value for exercise and leisure, it appears that more time spent on sleeping might be beneficial to those who are less comfortable around others. Perhaps a further dissection and examination on personality might grant further insights into what makes us happy. Nonetheless, it appears that perhaps happiness and personality seems to have some correlation.
如果我们看一下运动和休闲的平均值,那么似乎更多的时间在睡眠上可能对那些不太舒服的人有益。 也许对人格的进一步剖析和考察可能会给我们带来什么使我们快乐的更多见解。 然而,似乎幸福和个性似乎之间存在某种关联。
Sleep is a more important factor in those who are less comfortable around others compared to their counterparts.
对于那些与他人相比不那么舒服的人,睡眠是一个更重要的因素。
Balanced hours and happiness:
平衡的时间和幸福:
Next, let’s look at how spending different proportion of our time correlates with happiness scores.Balanced: all components <50%
接下来,让我们看看度过不同时间的时间与幸福感分数如何相关。 平衡:所有组件<50%
Happiness score: mean=6.80, sd=2.00. Correlation between being around others and happiness =0.44.
幸福评分: 平均值= 6.80,标准偏差= 2.00 。 周围人与幸福之间的相关性= 0.44 。
Unbalanced: any component ≥ 50%
不平衡:任何成分≥50%

Happiness score: mean=5.60, sd=2.80. Correlation between sleep and happiness=0.7, correlation between study and happiness=-0.4. *those who entered the unbalanced group were due to study or sleep ≥ 50%
幸福评分: 平均值= 5.60,标准偏差= 2.80。 睡眠与幸福之间的相关性= 0.7 ,学习与幸福之间的相关性= -0.4。 *进入失衡组的人是由于学习或睡眠≥50%
Looking at the mean, it appears that ensuring that we have a balanced distribution of hours across the 4 factors correlates with higher levels of happiness. However, let’s take a look at the regression line for happiness and sleep for unbalanced hours with correlation of 0.7!
从均值来看,似乎可以确保我们在这四个因素上的小时数均衡分配与更高水平的幸福感相关。 但是,让我们看一下相关系数为0.7的幸福感和不平衡时间睡眠的回归线!
#nbal is the data with only rows that are not balanced
x =  nbal['Sleep']
y =  nbal['Happiness score']
plt.plot(x, y, 'o')
m, b = np.polyfit(x, y, 1)
plt.plot(x, m*x + b)
If i look at only data of those with ‘Sleep’ ≥ 50% of hours:Happiness mean=7.17, sd=1.22Maybe we all just need a higher % of time for sleep. When I relaxed the criteria to ≥ 40%, the mean happiness score fell to 6.49. Furthermore, it appears that it’s spending >50% of our time on studying that brought down the mean (mean of those with ≥ 50% studying hours = 3.4285, sd=2.88).
如果我仅查看“睡眠”≥50%的那些人的数据:幸福平均= 7.17,sd = 1.22也许我们所有人都只需要更长的时间才能入睡。 当我将标准放宽到≥40%时,平均幸福感得分降至6.49。 此外,似乎花费了我们超过50%的时间在学习上降低了平均值(学习时间≥50%的人的平均值= 3.4285,sd = 2.88)。
Those with ≥50% of hours spent on sleep across ‘Sleep’, ‘Study’, ‘Exercise’, ‘Leisure’ had a happiness mean score of 7.17.
那些在“睡眠”,“学习”,“锻炼”,“休闲”中花费≥50%的睡眠时间的人的幸福平均得分为7.17。
结论: (Conclusion:)
If you read all of the above, thank you so much because I spent a lot of time trying to code and getting the values I needed for analysis! Otherwise, here’s a quick summary:Question that I wanted to answer: Does the proportion of time spent on different activities influence our happiness levels?
如果您阅读了以上所有内容,则非常感谢,因为我花了很多时间尝试编码并获取分析所需的值! 否则,这里是一个简短的摘要: 我想回答的问题:花在不同活动上的时间比例会影响我们的幸福感吗?
Yes, it does! Students with a more balanced proportion of hours spent across activities appear to have a positive correlation with happiness levels.
是的,它确实! 学生在各项活动中花费的时间比例更均衡的情况似乎与幸福感水平呈正相关。
Findings:
发现:
1) Positive correlation between sleep and happiness throughout 2) Personality has an influence on the types of activities that correlates with our happiness (e.g sleep and leisure) 3) Those who have a more balanced spread of hours seem to be happier than those who had unbalanced hours 4) Those with ≥50% of their time, across the variables, spent on sleeping had higher mean score for happiness 5) Those with ≥50% of their time, across the variables, spent on studying had lower mean score for happiness.
1)整个过程中睡眠与幸福之间呈正相关 2) 人格对与我们的幸福相关的活动类型有影响(例如睡眠和休闲)3)时间分布更均衡的人似乎比那些快乐的人更快乐时间不平衡4)在变量中≥50%的时间花费在睡眠上的人的平均幸福分数较高 5)在变量中≥50%的时间花费在学习上的人的幸福平均分数较低 。
Rather than chasing after more sleep, or more exercise, how should we be spending our time across the board to increase our happiness?
与其追逐更多的睡眠或更多的运动,不如我们应该花很多时间来增加幸福感?
- Spend more % of our time sleeping. Sounds simple yet difficult in a competitive/work-centric environment. 花更多的时间睡觉。 在竞争/以工作为中心的环境中听起来很简单却很困难。
- Alternatively, try to balance the number of hours we spent in different activities (do not spend too much time on a single activity!) 或者,尝试平衡我们在不同活动上花费的时间(不要在单个活动上花费太多时间!)
Nonetheless, glad to have learnt a lot of python and data visualization from this mini-project and trying to milk all the information that it’s trying to tell me! Do let me know if there are other areas I could look at or your thoughts on the results! Would try to get a larger data set the next time.
但是,很高兴从这个小型项目中学到了很多python和数据可视化,并尝试提取所有试图告诉我的信息! 请让我知道我是否还有其他需要关注的方面或您对结果的看法! 下次将尝试获取更大的数据集。
帮助学生改善学习方法


 814
814

 被折叠的 条评论
为什么被折叠?
被折叠的 条评论
为什么被折叠?
 到【灌水乐园】发言


