


各类软件马斯洛需求层次分析
When I joined Square, I was embedded on a product that had been in-market for a year but didn’t have dedicated analytics support.
当我加入Square时,我被嵌入了已经上市一年但没有专门的分析支持的产品。
As you might expect, the team had a large backlog of curiosities:
如您所料,该团队积压了很多好奇心:
What metrics should we be tracking?
我们应该跟踪哪些指标?
Why is this metric lower than I’d expect?
为什么这个指标低于我的预期?
Do we have data on XYZ?
我们有关于XYZ的数据吗?
I have this idea for an A/B test! Can you help me implement it?
我对A / B测试有这个想法! 你能帮我实现吗?
What % of users use XYZ feature?
百分之几的用户使用XYZ功能?
Can we use machine learning? I heard clustering is a great way to understand our user base!
我们可以使用机器学习吗? 我听说集群是了解我们的用户群的好方法!
Candidly, I was overwhelmed. Where should I start? What’s the most important thing to do right now? What should I be doing in three months, a year?
坦率地说,我不知所措。 我应该从哪里开始? 现在最重要的事情是什么? 一年三个月后我应该做什么?
Yearning for a framework to guide me, I came upon the AI hierarchy of needs, modeled after Maslow’s hierarchy of needs. While the specifics didn’t directly map to product analytics, I realized the overarching of a hierarchy did.
渴望有一个指导我的框架,我以马斯洛的需求层次为模型,建立了AI需求 层次 。 尽管具体细节并没有直接映射到产品分析,但我意识到层次结构的概述确实可以实现。
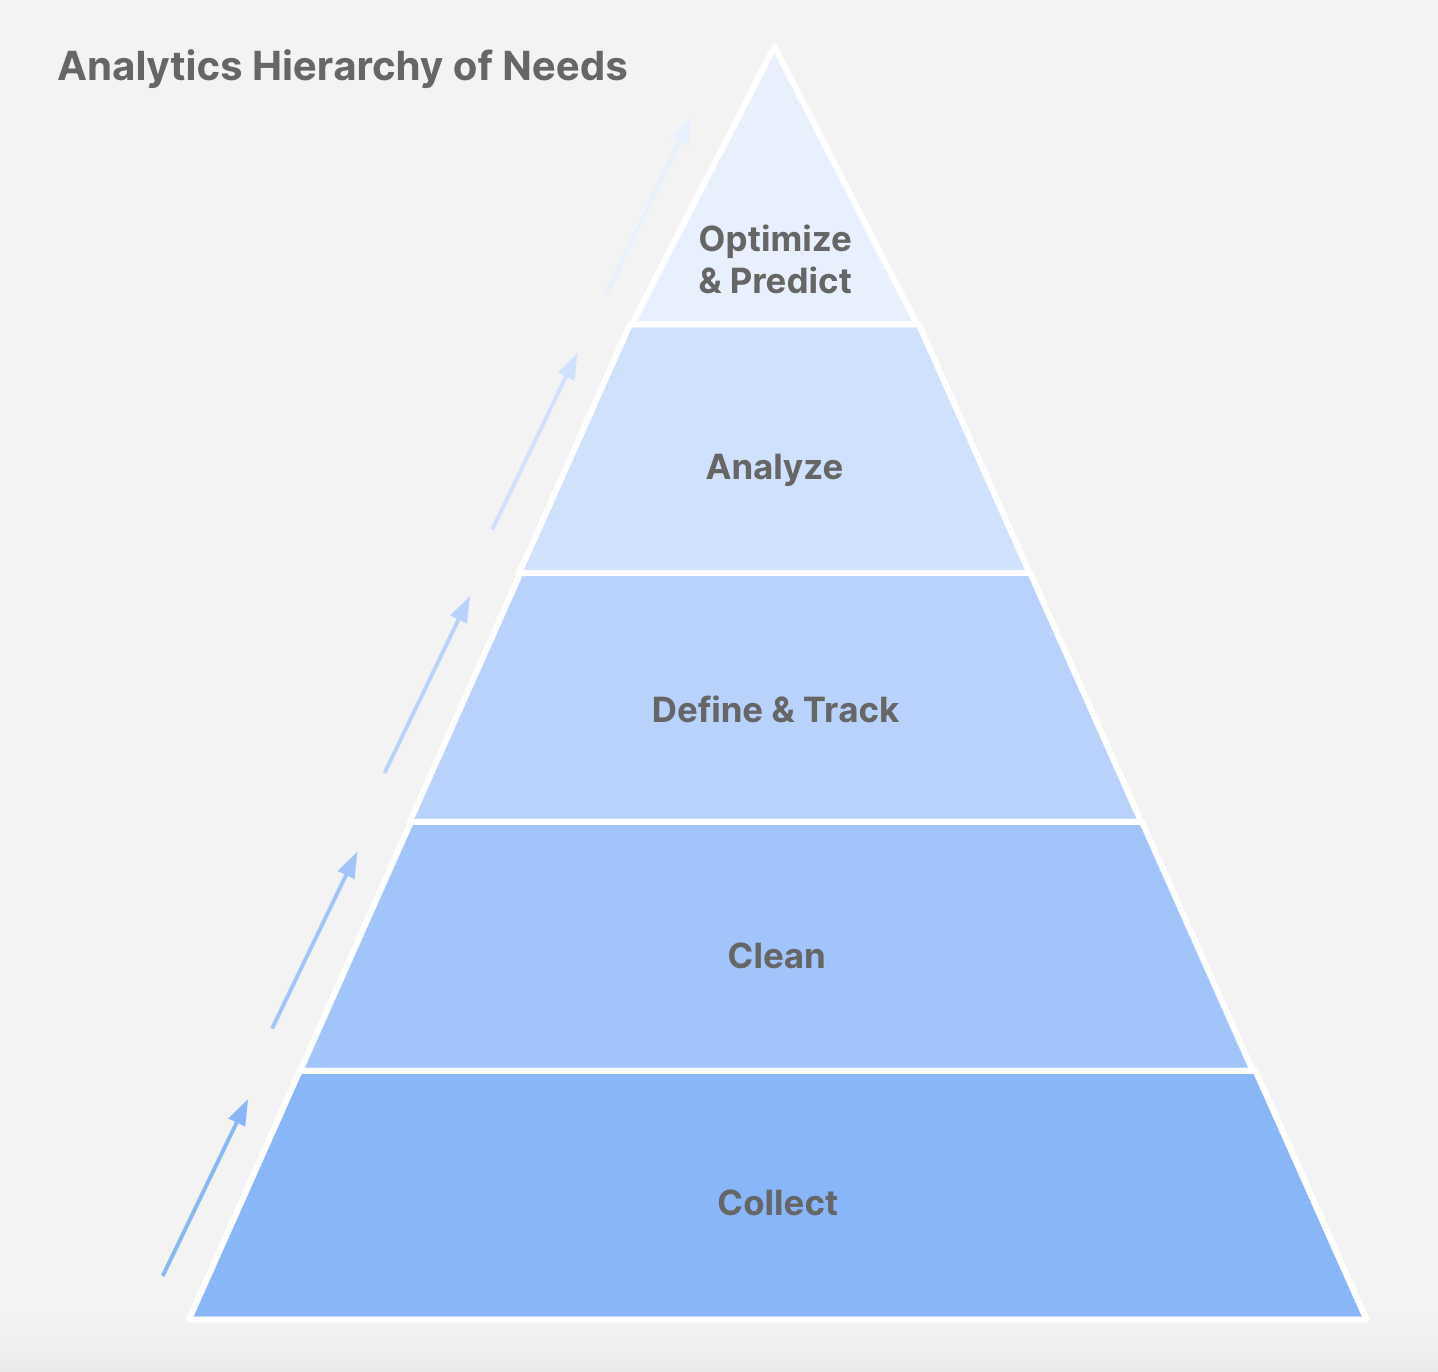
需求的分析层次结构 (The Analytics Hierarchy of Needs)
The general idea of the analytics hierarchy of needs is that you should not move up the hierarchy until you’ve done the basics in the prior step (i.e. no deep analysis before metrics are defined & tracked, no dashboards built before you’ve started collecting & cleaning your data, etc).
需求分析层次结构的总体思想是,在上一步完成基础知识之前,您不应该上移层次结构(即,在定义和跟踪指标之前不进行深入分析,在开始收集之前不构建仪表板)并清理您的数据等)。

1.收集 (1. Collect)
Wait, how are we not tracking usage of our flagship feature?!
等等,我们如何不跟踪旗舰功能的使用?
This isn’t fun to hear. You can’t manufacture data that you wish existed in hindsight!
听到这不好玩。 您无法制造出事后希望存在的数据!
Before doing anything else, an analyst’s first priority should be to ensure basic event logging & data modeling for key entities. This can be informed by your own product intuition and key questions stakeholders have of your data.
在执行其他任何操作之前,分析师的首要任务应该是确保关键实体的基本事件记录和数据建模。 这可以通过您自己的产品直觉和利益相关者对您的数据的关键问题来了解。
Determining what to log and how to log it can be intimidating. Consider mapping out an Entity Relationship Diagram (ERD) for your key entities, and giving engineering the basic event logging guidance of LATAM (Log All Taps And [Relevant] Metadata).
确定要记录什么以及如何记录它可能会令人生畏。 考虑映射出一个实体关系图(ERD)为您的实体按键,并给予工程LATAM的基本事件日志记录的指导(L OG 者A 牛逼 APS 钕 [相关] 中号 etadata)。
2.清洁 (2. Clean)
Hey Ryan, can you quickly pull this for me?
嘿,瑞安,你能帮我拉一下吗?
Sure, let me just SELECT * FROM some_pristine_table_that_does_not_exist;
当然,让我选择SELECT * FROM some_pristine_table_that_does_not_exist;
Your engineering team will likely emit data in disparate, narrow tables. Before dashboarding & diving into analysis, you should ETL your data into wider, standardized tables. This will make your analyses and dashboards far more scalable & easier to build.
您的工程团队可能会在不同的狭窄表格中发出数据。 在进行仪表板分析和深入分析之前,您应该将数据ETL到更大的标准化表中。 这将使您的分析和仪表板更具可扩展性,并且更易于构建。
Consider a per-user-per-day summary table as a place to start. Your stakeholders can inform the columns: ask them what common questions they wish they knew but are unable to answer.
考虑将“每用户每天”摘要表作为开始的地方。 您的利益相关者可以告知各列:询问他们希望他们知道但无法回答的常见问题。
3.定义和跟踪 (3. Define & Track)
Why is revenue lower than I expected this month?
为什么收入低于我本月的预期?
Now that your data is organized, it’s time to break down your funnel.
现在,您的数据已经组织好了,是时候分解渠道了。
Usually people care most about active users and $$. In order to understand what’s driving these, you need to map your product funnel to a flow chart. Consider this basic SaaS product as an example:
通常,人们最关心活跃用户和$$。 为了了解驱动这些因素的原因,您需要将产品渠道映射到流程图。 以这个基本的SaaS产品为例:
> Revenue = (active users) * (average subscription cost per user)
>收入=(活跃用户)*(每位用户的平均订阅费用)
>> Active users = (new conversions) + (retained users)
>>有效用户=(新转化)+(保留用户)
>>> New conversions = (free trials) * (average conversion %)
>>>新转化=(免费试用)*(平均转化百分比)
And so on. Once you’ve mapped out this flow chart and built dashboards tracking each metric, you’re ready to analyze your funnel.
等等。 绘制完该流程图并构建了跟踪每个指标的仪表板之后,就可以分析渠道了。
4.分析 (4. Analyze)
Interesting churn analysis, Ryan, but our retention is best in class. Conversion is top of mind for me right now.
有趣的客户流失分析,Ryan,但我们的保留率是同类中最好的。 现在,转换是我的首要任务。
Once my team had each of our funnel metrics defined and tracked, we assigned a Red/Amber/Green status to each. We did this by comparing each metric to internal benchmarks, external benchmarks, and our gut; this helped us determine our biggest areas of opportunity.
一旦我的团队定义并跟踪了每个渠道指标,我们便为每个渠道分配了红色/琥珀色/绿色状态 。 为此,我们将每个指标与内部基准,外部基准和我们的直觉进行了比较; 这有助于我们确定最大的机会领域。
For example: why do a deep dive into retention if it’s beating benchmarks?
例如:如果要超越基准率,为什么还要深入研究保留率?
Once you have your top area(s) of opportunity, you can do some basic heuristic analysis on each. There’s often a noteworthy trend when visualizing a metric by cohort, acquisition channel, and basic user demographics.
一旦有了最重要的机会领域,就可以对每个机会进行一些基本的启发式分析。 通过同类群组,获取渠道和基本用户人口统计数据可视化指标时,通常会有一个值得注意的趋势。
5.优化和预测 (5. Optimize & Predict)
So, you’re finally going to do that clustering analysis I heard about?
那么,您最终将要进行我听说过的聚类分析?
You’re collecting data and you’ve cleaned it. You’ve defined your metrics and you’re tracking them. You’ve analyzed your metrics and outlined key areas for improvement.
您正在收集数据,并且已清理数据。 您已经定义了指标并正在跟踪它们。 您已经分析了指标并概述了需要改进的关键领域。
Congratulations: you can now do the ‘sexy’ stuff. 😎
恭喜:您现在可以做“性感”的事情。 😎
A/B testing can give you confidence that one user experience is more optimal than another. If you’ve been following the analytics hierarchy of needs, this is well-timed: as the more users you have, the higher statistical confidence your experiments will yield.
A / B测试可以使您确信一种用户体验比另一种用户体验更为理想。 如果您一直遵循需求的分析层次结构,那么时机就很好:随着用户的增多,实验将产生更高的统计信心。
Supervised machine learning can help you understand what is predictive of user behavior — for example, what actions or demographics lead to conversion or sustained usage.
有监督的机器学习可以帮助您了解什么可以预测用户的行为,例如,哪些操作或人口统计信息会导致转化或持续使用。
Unsupervised machine learning can help you understand patterns among your users you weren’t aware of (hello, clustering!).
无监督机器学习可以帮助您了解您不了解的用户中的模式( 您好,集群! )。
However, a word of caution: just because you’ve reached the top of the hierarchy does not mean that machine learning is the best solution to all your questions. Simple heuristics can often yield a better outcome, as they’re quicker to implement and usually more digestible.
但是,请注意:仅仅因为您已达到层次结构的最高层, 并不意味着机器学习是所有问题的最佳解决方案。 简单的启发式方法通常可以产生更好的结果,因为它们实施起来更快,并且通常更易于消化。
综上所述 (In summary)
Don’t be the analyst explaining the SHAP values of your XGBoost model while your new flagship feature isn’t being tracked.
当您的新旗舰功能没有被追踪时,不要当分析师来解释您的XGBoost模型的SHAP值。
翻译自: https://towardsdatascience.com/the-analytics-hierarchy-of-needs-6d57d0e205e2
各类软件马斯洛需求层次分析


 1万+
1万+


 被折叠的 条评论
为什么被折叠?
被折叠的 条评论
为什么被折叠?
 到【灌水乐园】发言


