


伊丽莎白·卡雷托 ( Elizabeth Carretto)
Everyone loves Unsolved Mysteries. There’s always someone who seems like the surefire culprit. There’s a clear motive, the perfect opportunity, and an incriminating footprint left behind. Yet, this is Unsolved Mysteries! It’s never that simple. Whether it’s a cryptic note behind the TV or a mysterious phone call from an unknown number at a critical moment, the pieces rarely fit together perfectly. As mystery lovers, we want to answer the age-old question of whodunit; we want to understand what really happened.
每个人都喜欢未解之谜。 总是有人看起来像是犯规的罪魁祸首。 有一个明确的动机,完美的机会和难以捉摸的足迹。 然而,这是未解之谜! 从来没有那么简单。 无论是电视后面的神秘音符,还是关键时刻来自未知号码的神秘电话,这些片段都很难完美地融合在一起。 作为神秘的爱好者,我们想回答wodunit这个古老的问题。 我们想了解真正发生了什么。
For engineers, instead of whodunit, the question is often “what failed and why?” When a problem occurs, we put on our detective hats and start our mystery-solving process by gathering evidence. The more complex a system, the more places to look for clues. An engineer can find herself digging through logs, poring over traces, and staring at dozens of dashboards.
对于工程师而言,问题通常是“什么失败以及为什么?”,而不是工程师。 发生问题时,我们戴上侦探帽,并通过收集证据开始解决神秘的过程。 系统越复杂,寻找线索的地方就越多。 工程师可以发现自己正在挖掘日志,仔细研究痕迹并盯着数十个仪表板。
All of these sources make it challenging to know where to begin and add to the time spent figuring out what went wrong. While this abundance of dashboards and information is by no means unique to Netflix, it certainly holds true within our microservices architecture. Each microservice may be easy to understand and debug individually, but what about when combined into a request that hits tens or hundreds of microservices? Searching for key evidence becomes like digging for a needle in a group of haystacks.
所有这些来源使得知道从哪里开始并增加花费在找出问题出处的时间上具有挑战性。 尽管丰富的仪表板和信息绝不是Netflix独有的,但在我们的微服务体系结构中确实如此。 每个微服务可能很容易分别理解和调试,但是将其组合成一个命中数十个或数百个微服务的请求又如何呢? 搜索关键证据变得像在大海捞针中挖针。

In some cases, the question we’re answering is, “What’s happening right now??” and every second without resolution can carry a heavy cost. We want to resolve the problem as quickly as possible so our members can resume enjoying their favorite movies and shows. For teams building observability tools, the question is: how do we make understanding a system’s behavior fast and digestible? Quick to parse, and easy to pinpoint where something went wrong even if you aren’t deeply familiar with the inner workings and intricacies of that system? At Netflix, we’ve answered that question with a suite of observability tools. In an earlier blog post, we discussed Telltale, our health monitoring system. Telltale tells us when an application is unhealthy, but sometimes we need more fine-grained insight. We need to know why a specific request is failing and where. We built Edgar to ease this burden, by empowering our users to troubleshoot distributed systems efficiently with the help of a summarized presentation of request tracing, logs, analysis, and metadata.
在某些情况下,我们要回答的问题是“现在正在发生什么??” 没有解决方案的每一秒钟都会带来沉重的成本。 我们希望尽快解决问题,以便我们的成员可以继续欣赏自己喜欢的电影和节目。 对于构建可观察性工具的团队而言,问题是:如何使我们快速而易懂地理解系统的行为? 即使您对系统的内部工作原理和复杂性不甚了解,也可以快速解析并轻松查明出问题的地方? 在Netflix,我们已经通过一套可观察性工具回答了这个问题。 在较早的博客文章中,我们讨论了我们的健康监控系统Telltale 。 Telltale告诉我们应用程序何时不正常,但有时我们需要更详尽的了解。 我们需要知道为什么特定请求失败以及在哪里。 我们构建了Edgar来减轻这种负担,方法是使用户能够借助对请求跟踪,日志,分析和元数据的摘要表示,有效地对分布式系统进行故障排除。
什么是埃德加? (What is Edgar?)
Edgar is a self-service tool for troubleshooting distributed systems, built on a foundation of request tracing, with additional context layered on top. With request tracing and additional data from logs, events, metadata, and analysis, Edgar is able to show the flow of a request through our distributed system — what services were hit by a call, what information was passed from one service to the next, what happened inside that service, how long did it take, and what status was emitted — and highlight where an issue may have occurred. If you’re familiar with platforms like Zipkin or OpenTelemetry, this likely sounds familiar. But, there are a few substantial differences in how Edgar approaches its data and its users.
Edgar是一种用于对分布式系统进行故障排除的自助服务工具,它建立在请求跟踪的基础上,顶部还附加了其他上下文。 借助请求跟踪以及来自日志,事件,元数据和分析的其他数据,Edgar可以显示通过我们的分布式系统的请求流-呼叫击中了哪些服务,从一个服务传递到下一个服务的信息,该服务内部发生了什么,花费了多长时间以及发出了什么状态-并突出显示了可能发生问题的位置。 如果您熟悉Zipkin或OpenTelemetry之类的平台,则听起来很熟悉。 但是,Edgar处理数据和用户的方式存在一些实质性差异。
While Edgar is built on top of request tracing, it also uses the traces as the thread to tie additional context together. Deriving meaningful value from trace data alone can be challenging, as Cindy Sridharan articulated in this blog post. In addition to trace data, Edgar pulls in additional context from logs, events, and metadata, sifting through them to determine valuable and relevant information, so that Edgar can visually highlight where an error occurred and provide detailed context.
尽管Edgar是建立在请求跟踪之上的,但它也使用跟踪作为线程将其他上下文绑定在一起。 正如Cindy Sridharan在此博客文章中所阐明的那样,仅从跟踪数据中获取有意义的价值可能是具有挑战性的 。 除了跟踪数据之外,Edgar 还从日志,事件和元数据中提取其他上下文 ,筛选它们以确定有价值的相关信息,以便Edgar可以直观地突出显示错误发生的位置并提供详细的上下文。
Edgar captures 100% of interesting traces, as opposed to sampling a small fixed percentage of traffic. This difference has substantial technological implications, from the classification of what’s interesting to transport to cost-effective storage (keep an eye out for later Netflix Tech Blog posts addressing these topics).
Edgar 捕获了100%有趣的跟踪 ,而不是对固定流量的一小部分进行采样。 这种差异具有实质性的技术含义,从有趣的事物的分类到具有成本效益的存储(请留意以后针对这些主题的Netflix Tech Blog帖子)。
Edgar provides a powerful and consumable user experience to both engineers and non-engineers alike. If you embrace the cost and complexity of storing vast amounts of traces, you want to get the most value out of that cost. With Edgar, we’ve found that we can leverage that value by curating an experience for additional teams such as customer service operations, and we have embraced the challenge of building a product that makes trace data easy to access, easy to grok, and easy to gain insight by several user personas.
Edgar为工程师和非工程师都提供了强大而 易用的用户体验 。 如果您接受存储大量痕迹的成本和复杂性,则希望从该成本中获得最大的价值。 借助Edgar,我们发现我们可以通过为其他团队(如客户服务运营)策划经验来利用这一价值,并且我们已经接受了构建使跟踪数据易于访问,易于获取和轻松的产品的挑战。获得一些用户角色的见解。
追踪为基础 (Tracing as a foundation)
Logs, metrics, and traces are the three pillars of observability. Metrics communicate what’s happening on a macro scale, traces illustrate the ecosystem of an isolated request, and the logs provide a detail-rich snapshot into what happened within a service. These pillars have immense value and it is no surprise that the industry has invested heavily in building impressive dashboards and tooling around each. The downside is that we have so many dashboards. In one request hitting just ten services, there might be ten different analytics dashboards and ten different log stores. However, a request has its own unique trace identifier, which is a common thread tying all the pieces of this request together. The trace ID is typically generated at the first service that receives the request and then passed along from service to service as a header value. This makes the trace a great starting point to unify this data in a centralized location.
日志,指标和跟踪是可观察性的三大Struts。 度量标准可以宏观地交流正在发生的事情,跟踪可以说明隔离请求的生态系统,日志可以提供详细细节的快照,以了解服务中发生的事情。 这些Struts具有巨大的价值,因此,该行业投入大量资金来构建令人印象深刻的仪表板和围绕它们的工具也就不足为奇了。 缺点是我们有很多仪表板。 在一个仅涉及10个服务的请求中,可能有10个不同的分析仪表板和10个不同的日志存储。 但是,请求具有其自己的唯一跟踪标识符,这是将请求的所有部分捆绑在一起的通用线程。 跟踪ID通常在接收请求的第一个服务处生成,然后在服务之间传递,作为标头值。 这使跟踪成为在集中位置统一此数据的良好起点。
A trace is a set of segments representing each step of a single request throughout a system. Distributed tracing is the process of generating, transporting, storing, and retrieving traces in a distributed system. As a request flows between services, each distinct unit of work is documented as a span. A trace is made up of many spans, which are grouped together using a trace ID to form a single, end-to-end umbrella. A span:
跟踪是一组段,代表整个系统中单个请求的每个步骤。 分布式跟踪是在分布式系统中生成,传输,存储和检索跟踪的过程。 当请求在服务之间流动时,每个不同的工作单元都记录为span 。 跟踪由许多跨度组成,这些跨度使用跟踪ID组合在一起以形成单个的端到端伞。 跨度:
- Represents a unit of work, such as a network call from one service to another (a client/server relationship) or a purely internal action (e.g., starting and finishing a method). 表示一个工作单元,例如从一项服务到另一项服务的网络调用(客户/服务器关系)或纯粹的内部操作(例如,开始和完成一种方法)。
- Relates to other spans through a parent/child relationship. 通过父/子关系与其他跨度相关。
- Contains a set of key value pairs called tags, where service owners can attach helpful values such as urls, version numbers, regions, corresponding IDs, and errors. Tags can be associated with errors or warnings, which Edgar can display visually on a graph representation of the request. 包含一组称为标签的键值对,服务所有者可以在其中附加有用的值,例如url,版本号,区域,对应的ID和错误。 标签可以与错误或警告相关联,Edgar可以在请求的图形表示中直观地显示这些错误或警告。
- Has a start time and an end time. Thanks to these timestamps, a user can quickly see how long the operation took. 有开始时间和结束时间。 由于有了这些时间戳,用户可以快速查看该操作花费了多长时间。
The trace (along with its underlying spans) allows us to graphically represent the request chronologically.
跟踪(及其基础跨度)使我们能够按时间顺序以图形方式表示请求 。

向跟踪添加上下文 (Adding context to traces)
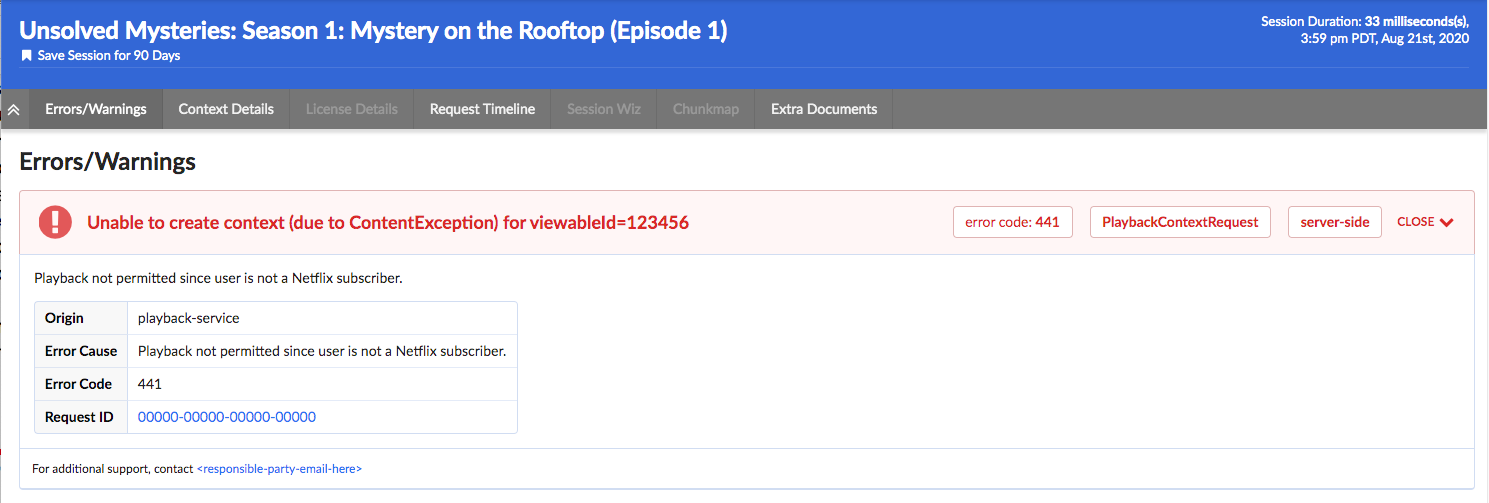
With distributed tracing alone, Edgar is able to draw the path of a request as it flows through various systems. This centralized view is extremely helpful to determine which services were hit and when, but it lacks nuance. A tag might indicate there was an error but doesn’t fully answer the question of what happened. Adding logs to the picture can help a great deal. With logs, a user can see what the service itself had to say about what went wrong. If a data fetcher fails, the log can tell you what query it was running and what exact IDs or fields led to the failure. That alone might give an engineer the knowledge she needs to reproduce the issue. In Edgar, we parse the logs looking for error or warning values. We add these errors and warnings to our UI, highlighting them in our call graph and clearly associating them with a given service, to make it easy for users to view any errors we uncovered.
单独使用分布式跟踪,Edgar能够在流经各种系统的情况下绘制请求的路径。 这种集中式视图对于确定命中哪些服务以及何时运行非常有帮助,但是缺乏细微差别。 标签可能表明存在错误,但不能完全回答发生了什么问题。 将日志添加到图片可以有很大帮助。 使用日志,用户可以看到服务本身必须对发生问题的内容说些什么。 如果数据获取程序失败,则日志可以告诉您它正在运行哪个查询以及导致失败的确切ID或字段。 仅此一项就可以为工程师提供重现问题所需的知识。 在Edgar中,我们解析日志以查找错误或警告值。 我们将这些错误和警告添加到我们的UI中,在我们的调用图中突出显示它们,并将它们与给定服务明确关联,以使用户可以轻松查看我们发现的任何错误。

With the trace and additional context from logs illustrating the issue, one of the next questions may be how does this individual trace fit into the overall health and behavior of each service. Is this an anomaly or are we dealing with a pattern? To help answer this question, Edgar pulls in anomaly detection from a partner application, Telltale. Telltale provides Edgar with latency benchmarks that indicate if the individual trace’s latency is abnormal for this given service. A trace alone could tell you that a service took 500ms to respond, but it takes in-depth knowledge of a particular service’s typical behavior to make a determination if this response time is an outlier. Telltale’s anomaly analysis looks at historic behavior and can evaluate whether the latency experienced by this trace is anomalous. With this knowledge, Edgar can then visually warn that something happened in a service that caused its latency to fall outside of normal bounds.
借助跟踪和日志中的其他上下文来说明问题,接下来的问题之一可能是该单个跟踪如何适应每个服务的总体运行状况和行为。 这是异常情况还是我们正在处理模式? 为了帮助回答这个问题,Edgar从伙伴应用程序Telltale中引入了异常检测。 Telltale为Edgar提供了等待时间基准,该基准表明该给定服务的单个跟踪的等待时间是否异常。 仅凭一条跟踪就可以告诉您服务需要500毫秒的响应时间,但是需要深入了解特定服务的典型行为才能确定此响应时间是否异常。 Telltale的异常分析着眼于历史行为,并可以评估此跟踪所经历的延迟是否异常。 有了这些知识,Edgar可以在视觉上警告服务中发生了某些事情,从而导致其延迟超出正常范围。

埃德加应该减轻负担,而不是增加负担 (Edgar should reduce burden, not add to it)
Presenting all of this data in one interface reduces the footwork of an engineer to uncover each source. However, discovery is only part of the path to resolution. With all the evidence presented and summarized by Edgar, an engineer may know what went wrong and where it went wrong. This is a huge step towards resolution, but not yet cause for celebration. The root cause may have been identified, but who owns the service in question? Many times, finding the right point of contact would require a jump into Slack or a company directory, which costs more time. In Edgar, we have integrated with our services to provide that information in-app alongside the details of a trace. For any service configured with an owner and support channel, Edgar provides a link to a service’s contact email and their Slack channel, smoothing the hand-off from one party to the next. If an engineer does need to pass an issue along to another team or person, Edgar’s request detail page contains all the context — the trace, logs, analysis — and is easily shareable, eliminating the need to write a detailed description or provide a cascade of links to communicate the issue.
在一个界面中显示所有这些数据,减少了工程师发现每个来源的工作量。 但是,发现只是解决之道的一部分。 有了Edgar提供和总结的所有证据,工程师可能会知道哪里出了问题以及哪里出了问题。 这是朝着解决迈出的重要一步,但尚未值得庆祝。 可能已找到根本原因,但是谁拥有相关服务? 很多时候,找到正确的联系点将需要跳转到Slack或公司目录,这会花费更多时间。 在埃德加(Edgar),我们已与服务集成在一起,以在应用程序中提供信息以及跟踪详细信息。 对于配置了所有者和支持渠道的任何服务,Edgar都提供了指向该服务的联系电子邮件及其Slack渠道的链接,从而使从一方到另一方的交接更加顺畅。 如果工程师确实需要将问题传递给另一个团队或个人,Edgar的请求详细信息页面将包含 所有上下文(跟踪,日志,分析),并且易于共享 ,从而无需编写详细的描述或提供一系列的信息。用于传达问题的链接。

A key aspect of Edgar’s mission is to minimize the burden on both users and service owners. With all of its data sources, the sheer quantity of data could become overwhelming. It is essential for Edgar to maintain a prioritized interface, built to highlight errors and abnormalities to the user and assist users in taking the next step towards resolution. As our UI grows, it’s important to be discerning and judicious in how we handle new data sources, weaving them into our existing errors and warnings models to minimize disruption and to facilitate speedy understanding. We lean heavily on focus groups and user feedback to ensure a tight feedback loop so that Edgar can continue to meet our users’ needs as their services and use cases evolve.
Edgar任务的关键方面是最大程度地减轻用户和服务所有者的负担。 使用其所有数据源,庞大的数据量可能变得不堪重负。 对于Edgar来说,保持优先级的界面至关重要, 该界面旨在向用户突出显示错误和异常,并帮助用户朝着解决的方向迈进。 随着UI的增长,在处理新数据源时要有敏锐和明智,将它们编织到我们现有的错误和警告模型中以最小化中断并促进快速理解非常重要。 我们将重点放在焦点小组和用户反馈上,以确保紧密的反馈循环,以便随着用户服务和用例的发展,Edgar可以继续满足用户的需求。
As services evolve, they might change their log format or use new tags to indicate errors. We built an admin page to give our service owners that configurability and to decouple our product from in-depth service knowledge. Service owners can configure the essential details of their log stores, such as where their logs are located and what fields they use for trace IDs and span IDs. Knowing their trace and span IDs is what enables Edgar to correlate the traces and logs. Beyond that though, what are the idiosyncrasies of their logs? Some fields may be irrelevant or deprecated, and teams would like to hide them by default. Alternatively, some fields contain the most important information, and by promoting them in the Edgar UI, they are able to view these fields more quickly. This self-service configuration helps reduce the burden on service owners.
随着服务的发展,他们可能会更改其日志格式或使用新的标记来指示错误。 我们建立了一个管理页面,为我们的服务所有者提供可配置性,并使我们的产品与深入的服务知识脱钩。 服务所有者可以配置其日志存储的基本详细信息,例如其日志位于何处以及它们用于跟踪ID和跨度ID的字段。 知道它们的跟踪和跨度ID就是使Edgar关联跟踪和日志的原因。 除此之外,他们的日志的特质是什么? 某些字段可能不相关或已弃用,并且团队希望默认隐藏它们。 另外,某些字段包含最重要的信息,通过在Edgar UI中进行促销,他们可以更快地查看这些字段。 这种自助服务配置有助于减轻服务所有者的负担。

利用埃德加 (Leveraging Edgar)
In order for users to turn to Edgar in a situation when time is of the essence, users need to be able to trust Edgar. In particular, they need to be able to count on Edgar having data about their issue. Many approaches to distributed tracing involve setting a sample rate, such as 5%, and then only tracing that percentage of request traffic. Instead of sampling a fixed percentage, Edgar’s mission is to capture 100% of interesting requests. As a result, when an error happens, Edgar’s users can be confident they will be able to find it. That’s key to positioning Edgar as a reliable source. Edgar’s approach makes a commitment to have data about a given issue.
为了使用户在时间紧迫的情况下求助于Edgar,用户需要能够信任Edgar。 特别是,他们需要能够依靠Edgar拥有有关其问题的数据。 分布式跟踪的许多方法涉及设置采样率(例如5%),然后仅跟踪请求流量的该百分比。 Edgar的任务不是捕获固定百分比,而是捕获100%有趣的请求。 结果,当发生错误时,Edgar的用户可以确信他们将能够找到它。 这是将Edgar定位为可靠来源的关键。 Edgar的方法承诺拥有有关特定问题的数据。
In addition to storing trace data for all requests, Edgar implemented a feature to collect additional details on-demand at a user’s discretion for a given criteria. With this fine-grained level of tracing turned on, Edgar captures request and response payloads as well as headers for requests matching the user’s criteria. This adds clarity to exactly what data is being passed from service to service through a request’s path. While this level of granularity is unsustainable for all request traffic, it is a robust tool in targeted use cases, especially for errors that prove challenging to reproduce.
除了存储所有请求的跟踪数据之外,Edgar还实现了一项功能,可以根据用户的给定条件按需收集其他详细信息。 启用此细粒度的跟踪之后,Edgar会捕获请求和响应有效负载以及与用户标准匹配的请求标头。 这可以使您更清楚地了解通过请求路径从服务到服务之间传递的数据 。 尽管对于所有请求流量来说,这种粒度级别都是不可持续的,但它是有针对性的用例的强大工具,尤其是对于证明难以再现的错误而言。
As you can imagine, this comes with very real storage costs. While the Edgar team has done its best to manage these costs effectively and to optimize our storage, the cost is not insignificant. One way to strengthen our return on investment is by being a key tool throughout the software development lifecycle. Edgar is a crucial tool for operating and maintaining a production service, where reducing the time to recovery has direct customer impact. Engineers also rely on our tool throughout development and testing, and they use the Edgar request page to communicate issues across teams.
您可以想象,这带来了非常实际的存储成本。 尽管Edgar团队已尽最大努力有效地管理这些成本并优化了我们的存储,但成本并不微不足道。 增强我们的投资回报率的一种方法是成为整个软件开发生命周期中的关键工具。 Edgar是用于运营和维护生产服务的重要工具,减少恢复时间会对客户产生直接影响。 工程师在整个开发和测试过程中也依赖我们的工具,他们使用Edgar请求页面在团队之间交流问题。
By providing our tool to multiple sets of users, we are able to leverage our cost more efficiently. Edgar has become not just a tool for engineers, but rather a tool for anyone who needs to troubleshoot a service at Netflix. In Edgar’s early days, as we strove to build valuable abstractions on top of trace data, the Edgar team first targeted streaming video use cases. We built a curated experience for streaming video, grouping requests into playback sessions, marked by starting and stopping playback for a given asset. We found this experience was powerful for customer service operations as well as engineering teams. Our team listened to customer service operations to understand which common issues caused an undue amount of support pain so that we could summarize these issues in our UI. This empowers customer service operations, as well as engineers, to quickly understand member issues with minimal digging. By logically grouping traces and summarizing the behavior at a higher level, trace data becomes extremely useful in answering questions like why a member didn’t receive 4k video for a certain title or why a member couldn’t watch certain content.
通过为多组用户提供工具,我们可以更有效地利用成本。 Edgar不仅已成为工程师的工具,而且已成为需要对Netflix服务进行故障排除的任何人的工具 。 在Edgar成立之初,我们努力在跟踪数据的基础上构建有价值的抽象,因此Edgar团队首先针对流视频用例。 我们建立了流媒体视频的策划体验,将请求分组到回放会话中,以给定资产开始和停止回放为标志。 我们发现,这种经验对于客户服务运营和工程团队而言非常有效。 我们的团队听取了客户服务部门的操作,以了解哪些常见问题导致了过多的支持痛苦,以便我们可以在UI中总结这些问题。 这使客户服务运营以及工程师能够以最少的挖掘量快速了解会员问题。 通过对跟踪进行逻辑分组并在更高级别上汇总行为,跟踪数据在回答以下问题变得极为有用:例如,为什么某个成员没有收到某个标题的4k视频,或者为什么成员无法观看某些内容。
为工作室扩展Edgar (Extending Edgar for Studio)
As the studio side of Netflix grew, we realized that our movie and show production support would benefit from a similar aggregation of user activity. Our movie and show production support might need to answer why someone from the production crew can’t log in or access their materials for a particular project. As we worked to serve this new user group, we sought to understand what issues our production support needed to answer most frequently and then tied together various data sources to answer those questions in Edgar.
随着Netflix工作室的发展壮大,我们意识到我们的电影和节目制作支持将受益于类似的用户活动汇总。 我们的电影和表演制作支持可能需要回答为什么制作团队中的某人无法登录或访问其特定项目的资料。 在为这个新用户群提供服务的过程中,我们试图了解生产支持最需要回答哪些问题,然后将各种数据源捆绑在一起以在Edgar中回答这些问题。
The Edgar team built out an experience to meet this need, building another abstraction with trace data; this time, the focus was on troubleshooting production-related use cases and applications, rather than a streaming video session. Edgar provides our production support the ability to search for a given contractor, vendor, or member of production staff by their name or email. After finding the individual, Edgar reaches into numerous log stores for their user ID, and then pulls together their login history, role access change log, and recent traces emitted from production-related applications. Edgar scans through this data for errors and warnings and then presents those errors right at the front. Perhaps a vendor tried to login with the wrong password too many times, or they were assigned an incorrect role on a production. In this new domain, Edgar is solving the same multi-dashboarded problem by tying together information and pointing its users to the next step of resolution.
Edgar团队积累了满足这种需求的经验,并使用跟踪数据构建了另一个抽象。 这次,重点是对与生产相关的用例和应用程序进行故障排除,而不是流视频会话。 Edgar为我们的生产支持提供了通过其名称或电子邮件来搜索给定承包商,供应商或生产人员的功能。 找到个人之后,Edgar进入众多日志存储区获取其用户ID,然后将其登录历史记录,角色访问更改日志以及与生产相关的应用程序发出的最新跟踪汇总在一起。 Edgar会扫描这些数据以查找错误和警告,然后将这些错误显示在最前面。 供应商可能尝试使用错误的密码多次登录,或者他们在生产中被分配了错误的角色。 在这个新领域中,埃德加(Edgar) 通过将信息绑在一起并将其用户指向下一步解决方案来解决相同的多仪表板问题 。

埃德加是什么,不是 (What Edgar is and is not)
Edgar’s goal is not to be the be-all, end-all of tools or to be the One Tool to Rule Them All. Rather, our goal is to act as a concierge of troubleshooting — Edgar should quickly be able to guide users to an understanding of an issue, as well usher them to the next location, where they can remedy the problem. Let’s say a production vendor is unable to access materials for their production due to an incorrect role/permissions assignment, and this production vendor reaches out to support for assistance troubleshooting. When a support user searches for this vendor, Edgar should be able to indicate that this vendor recently had a role change and summarize what this role change is. Instead of being assigned to Dead To Me Season 2, they were assigned to Season 1! In this case, Edgar’s goal is to help a support user come to this conclusion and direct them quickly to the role management tool where this can be rectified, not to own the full circle of resolution.
埃德加(Edgar)的目标不是成为一切的工具,也不是成为一切工具的万能工具。 相反, 我们的目标是充当故障排除的门生-Edgar应该能够Swift引导用户了解问题,并将他们带到可以解决问题的下一个位置。 假设某生产供应商由于角色/权限分配不正确而无法访问其生产资料,并且该生产供应商伸出援手来协助解决故障。 当支持用户搜索该供应商时,Edgar应该能够表明该供应商最近发生了角色更改,并总结了此角色更改是什么。 他们没有被分配到Dead To Me Season 2,而是被分配到Season 1! 在这种情况下,Edgar的目标是帮助支持用户得出这个结论,并将他们Swift引导到可以纠正该问题的角色管理工具,而不是拥有全部解决方案。
Netflix的用法 (Usage at Netflix)
While Edgar was created around Netflix’s core streaming video use-case, it has since evolved to cover a wide array of applications. While Netflix streaming video is used by millions of members, some applications using Edgar may measure their volume in requests per minute, rather than requests per second, and may only have tens or hundreds of users rather than millions. While we started with a curated approach to solve a pain point for engineers and support working on streaming video, we found that this pain point is scale agnostic. Getting to the bottom of a problem is costly for all engineers, whether they are building a budget forecasting application used heavily by 30 people or a SVOD application used by millions.
尽管Edgar是围绕Netflix的核心流视频用例创建的,但从那以后它已经发展为涵盖了广泛的应用程序。 尽管Netflix流媒体视频被数百万成员使用,但某些使用Edgar的应用程序可能会按每分钟的请求而不是每秒的请求来衡量其音量,并且可能只有数十或数百个用户,而不是数百万。 当我们从一种精心设计的方法开始解决工程师的痛点并支持流视频工作时,我们发现该痛点与规模无关。 对于所有工程师来说,要想解决问题,就要付出高昂的代价,无论他们是在构建预算预测应用程序(由30个人大量使用)还是在SVOD应用程序(数百万人使用)中。
Today, many applications and services at Netflix, covering a wide array of type and scale, publish trace data that is accessible in Edgar, and teams ranging from service owners to customer service operations rely on Edgar’s insights. From streaming to studio, Edgar leverages its wealth of knowledge to speed up troubleshooting across applications with the same fundamental approach of summarizing request tracing, logs, analysis, and metadata.
如今,Netflix上的许多应用程序和服务涵盖了各种类型和规模,发布了可在Edgar中访问的跟踪数据,从服务所有者到客户服务运营的团队都依赖Edgar的见解。 从流媒体到工作室, Edgar都利用其丰富的知识,以汇总请求跟踪,日志,分析和元数据的基本方法来加快应用程序的故障排除速度 。
As you settle into your couch to watch a new episode of Unsolved Mysteries, you may still find yourself with more questions than answers. Why did the victim leave his house so abruptly? How did the suspect disappear into thin air? Hang on, how many people saw that UFO?? Unfortunately, Edgar can’t help you there (trust me, we’re disappointed too). But, if your relaxing evening is interrupted by a production outage, Edgar will be behind the scenes, helping Netflix engineers solve the mystery at hand.
当您坐在沙发上观看新的未解之谜时,您可能仍然会发现自己的问题多于答案。 受害者为什么如此突然离开家? 犯罪嫌疑人如何消失在空中? 等等,有多少人看到那只不明飞行物? 不幸的是,埃德加(Edgar)无法在这里为您提供帮助(相信我,我们也很失望)。 但是,如果因生产中断而中断了轻松的夜晚,Edgar将在幕后,帮助Netflix工程师解决眼前的谜团。
Keeping services up and running allows Netflix to share stories with our members around the globe. Underneath every outage and failure, there is a story to tell, and powerful observability tooling is needed to tell it. If you are passionate about observability then come talk to us.
保持服务的正常运行可以使Netflix与我们的全球成员分享故事。 在每次中断和故障下,都有一个故事要讲述,需要强大的可观察性工具来讲述它。 如果您对可观察性充满热情,请 与我们联系 。
翻译自: https://netflixtechblog.com/edgar-solving-mysteries-faster-with-observability-e1a76302c71f


 1651
1651

 被折叠的 条评论
为什么被折叠?
被折叠的 条评论
为什么被折叠?
 到【灌水乐园】发言


