


相似邻里算法
IBM Data Science Capstone Project
IBM Data Science Capstone项目
分析和可视化与服装店投资者的要求有关的纽约市结构 (Analyzing and visualizing the structure of New York City in relation to the requirements of a Clothing Store Investor)
介绍 (Introduction)
I have taken the time in my semester break to acquire more skills related to data science by completing the IBM Data Science Professional Certificate course on Coursera. The last module is a capstone project and the highlight of the course, it includes the greatest learning effect by applying the learned skills on an individual real life problem. As you will see from the business problem part, I decided to add some more complexity to the standard course assignment .
我在学期中花了时间通过完成Coursera上的IBM数据科学专业证书课程来学习与数据科学相关的更多技能。 最后一个模块是一个顶峰项目,也是课程的重点,它通过将学到的技能应用到单个现实生活问题上,包括最大的学习效果。 从业务问题部分您将看到,我决定为标准课程分配增加一些复杂性。
I present here the summery of my project and explain different methods briefly. If you are interested in the extended code check out my jupyter notebook.
我在这里介绍我的项目概述,并简要说明不同的方法。 如果您对扩展代码感兴趣,请查看我的jupyter 笔记本 。
业务问题 (Business Problem)
The project is based on a hypothetical business case. A Canadian Investor who recently made a fortune with an investment in a Clothing Store in Toronto wants to repeat his idea in New York City.
该项目基于一个假设的业务案例。 一位最近在多伦多的一家服装店投资赚钱的加拿大投资者想在纽约市重复他的想法。
- As his brand is exclusive and expensive the location should be one of the most crowded districts with high employment rate and above average income. He prefers not only tourists to buy in the store he would also like to gain many regular customers. 由于他的品牌专有且价格昂贵,因此该地区应该是就业率最高且收入高于平均水平的最拥挤的地区之一。 他不仅喜欢游客在商店购物,而且还希望吸引许多固定顾客。
- Due to the origin of his brand has a touch of Italian design he prefers a location close to Italian restaurants on the basis of window shopping and the chance that people who go for Italian food also have a sympathy for Italian fashion is pretty high. 由于他的品牌的起源具有意大利风格,因此他更喜欢在橱窗购物的基础上靠近意大利餐厅,而且去意大利美食的人也很喜欢意大利时尚。
- Tourists and business traveler are well known for spending money generously, therefore the criteria to be as close as possible to hotels is highly important, because guests of the city hotels are more likely to buy clothes nearby and guarantee for more walk-in customers. 游客和商务旅行者以大笔消费而闻名,因此,尽可能接近酒店的标准非常重要,因为城市酒店的客人更有可能在附近买衣服,并保证有更多的客源顾客。
- As close to the city Center or other touristic hotspots to benefit from walk-in customers. Approximately 20 Minutes walking distance to the Center of the district. If possible far away from other clothing stores. 距市中心或其他旅游热点不远,因此可从步行游客中受益。 到市区中心约20分钟步行路程。 如果可能,请远离其他服装店。
- The Investor wishes to invest in a flat in New York City to be nearby the store. By the reason to live close to the store he has the following criteria to his place of residence: low crime rate, high community trust, close to parks, theatres and art galleries. 投资者希望在商店附近的纽约市投资一个公寓。 由于居住在商店附近的原因,他对居住地有以下标准:犯罪率低,社区信任度高,靠近公园,剧院和美术馆。
The Investor first wants a macro overview of New York City. So we are exploring the community districts.
投资者首先要对纽约市进行宏观概览。 因此,我们正在探索社区区。
1.业务问题理解 (1. Business Problem Understanding)
The Project seems very clear, find the perfect district for an Italian brand clothing store, taking into account the location should be suitable to his imaginations of the perfect place of residence, where you feel safe at the same time.
该项目看起来非常清晰,为意大利品牌服装店找到理想的地区,同时考虑到该位置应适合他对理想住所的想象,同时又让您感到安全。
2.分析方法 (2. Analytical Approach)
The core of the project will be the socio-economic data frame. Complementary we build a venues data frame fetched from foursquare and explore these venues. The final venues frame will contain the most common venues of each district, which we will get through one hot encoding. This data frame is the basis for the k-means algorithm to cluster the districts by their features to compare similarity between these districts.
该项目的核心将是社会经济数据框架。 作为补充,我们构建了一个从foursquare获取的场所数据框架,并探索了这些场所。 最终的场所框架将包含每个地区最常见的场所,我们将通过一种热门编码进行了解。 该数据帧是k-means算法根据区域特征对区域进行聚类以比较这些区域之间相似度的基础。
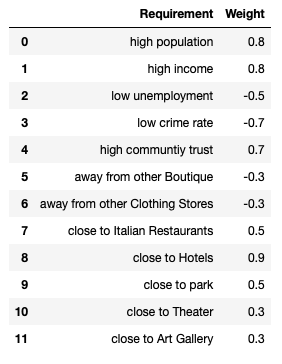
For the best result the analytical solution to the business problem is to quantify and evaluate the thoughts of the client to full fill his requirements completely. For evaluating his criteria, we will create a features weighted matrix to express the investors desires in a scientific way, which we will multiply with the normalized final data frame to add the extra column with the weighted results, which gives us an indication of the best districts.
为了获得最佳结果,业务问题的分析解决方案是量化和评估客户的想法,以完全满足其需求。 为了评估他的标准,我们将创建一个特征加权矩阵 ,以科学的方式表达投资者的需求,然后将其与标准化的最终数据框相乘,以添加带有加权结果的额外列,从而为我们指明最佳地区。
3.数据要求和收集 (3. Data requirements and collection)
To ensure the best location for the store I decided to add some more complexity to the standard course problem. As you can see from the criteria given by the investor we need some more data.
为了确保商店的最佳位置,我决定为标准课程问题增加一些复杂性。 从投资者给出的标准可以看出,我们需要更多数据。
In the beginning of the Project I found data from many different data sources, but decided to get the data mainly from cccnewyork.org by the reason that the source of their Data is the U.S. Census Bureau and the data was fetched by the American Community Survey https://data.census.gov/. So we can be sure the data is up to date, consistent and reliable.
在项目开始时,我从许多不同的数据源中找到了数据,但决定主要从cccnewyork.org获取数据,原因是其数据源是美国人口普查局,并且该数据是由美国社区调查局获取的。 https://data.census.gov/ 。 因此,我们可以确保数据是最新的,一致且可靠的。
the socio-economic data will be obtained from various csv files from cccnewyork.org
社会经济数据将从cccnewyork.org的各种csv文件中获得
the venues will be fetched from Foursquare through an API
场地将通过API从Foursquare获取
the Geo-coordinates will be obtained with nominatim and geopy
地理坐标将通过nominatim和geopy获得
4.数据理解与准备 (4. Data understanding and preparing)
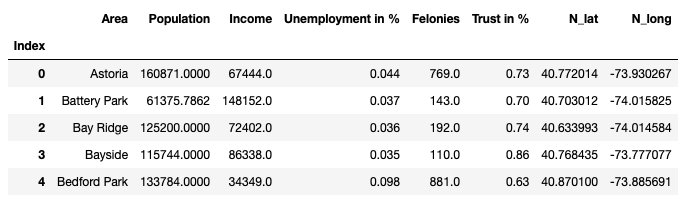
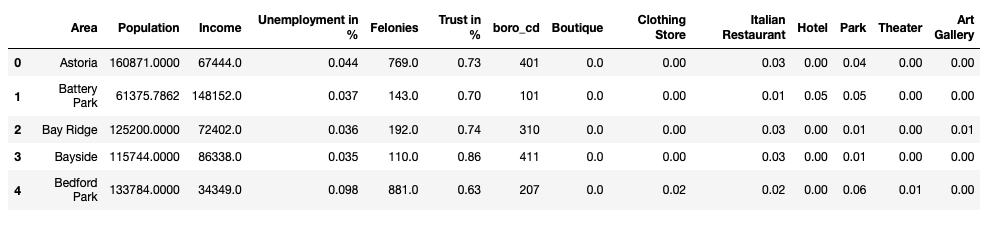
First of all, we will build a clean socio-economic data frame with all the necessary information which are related to the business problem. Therefore, we need to load all the files and drop all unnecessary columns and rows.
首先,我们将建立一个干净的社会经济数据框架,其中包含与业务问题相关的所有必要信息。 因此,我们需要加载所有文件并删除所有不必要的列和行。
使用Geocoder获取经度和纬度 (Getting latitudes and longitudes with geocoder)
As mentioned before geocoder is a great tool to get the latitude and longitude. If you query is too large you can use the rate limiter for fetching larger amounts of queries successful:
如前所述,Geocoder是获取纬度和经度的好工具。 如果查询太大,则可以使用速率限制器成功获取大量查询:
from geopy.extra.rate_limiter import RateLimiter
geocode = RateLimiter(geolocator.geocode, min_delay_seconds=1)D_lat = []
D_long = []for district in socio_test["Area"]:

    location = geolocator.geocode(district)
    if location:
        d_latitude = location.latitude
        d_longitude = location.longitude
        D_lat.append(d_latitude)
        D_long.append(d_longitude)
    else:
        print(district)#Append to df
socio["D_lat"] = D_lat
socio["D_long"] = D_long
用叶映射 (Mapping with Folium)
Folium is a great package to make beautiful maps. We will use it for a general overview of the districts of New York City to get familiar with the structure of the City and for interactive choropleth maps.
Folium是制作精美地图的理想选择。 我们将使用它来大致了解纽约市各区,以熟悉纽约市的结构以及交互式的十字形图。
map_NY_Nsimple = folium.Map(location=[40.730610, -73.935242], zoom_start=10)# for each Community District add a marker to map
for lat, long, district in zip(socio[‘D_lat’], socio[‘D_long’], socio[‘Area’]):
 label = ‘{}’.format(district)
 label = folium.Popup(label, parse_html=True)
 folium.CircleMarker(
 [lat, long],
 radius=15,
 popup=label,
 color=’#3186cc’,
 fill=True,
 fill_color=’#3186cc’,
 fill_opacity=0.7,
 parse_html=False).add_to(map_NY_Nsimple)

map_NY_Nsimple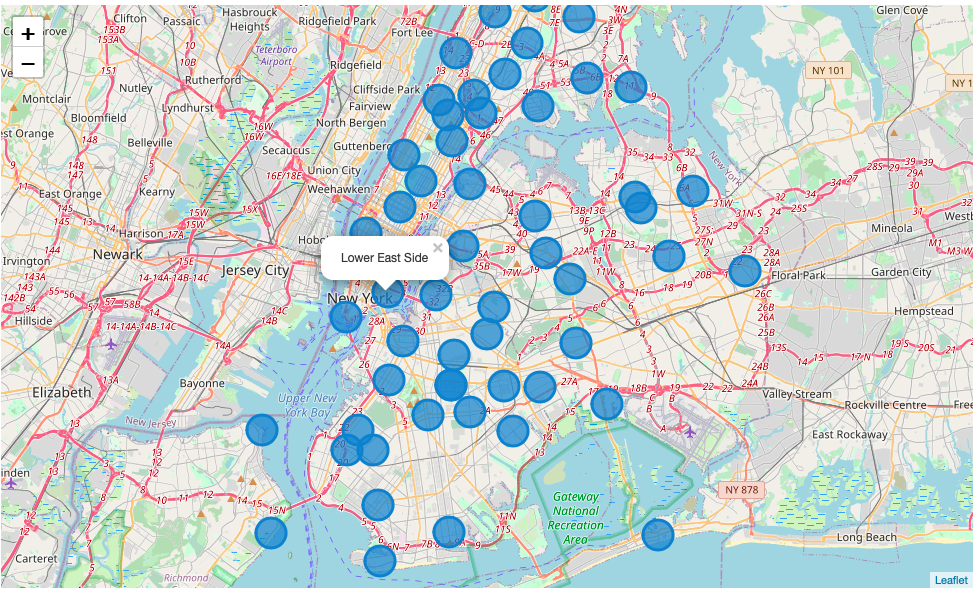
By adding chloropleth layers for each columnm, the map gets more interactive and informative. Simply add a layer for each column similar to the code below.
通过为每个columnm添加chloropleth层,地图将变得更具交互性和信息量。 只需为每列添加一层,类似于下面的代码。
income = map_NY_N.choropleth(
    geo_data=nyc_geo,
    data=socio,
    columns=['boro_cd', 'Income'],
    key_on='feature.properties.boro_cd',
    fill_color='OrRd',
    fill_opacity=0.7,
    line_opacity=0.2,
    legend_name='income',
    smooth_factor=0,
    name = "income",
    highlight = True)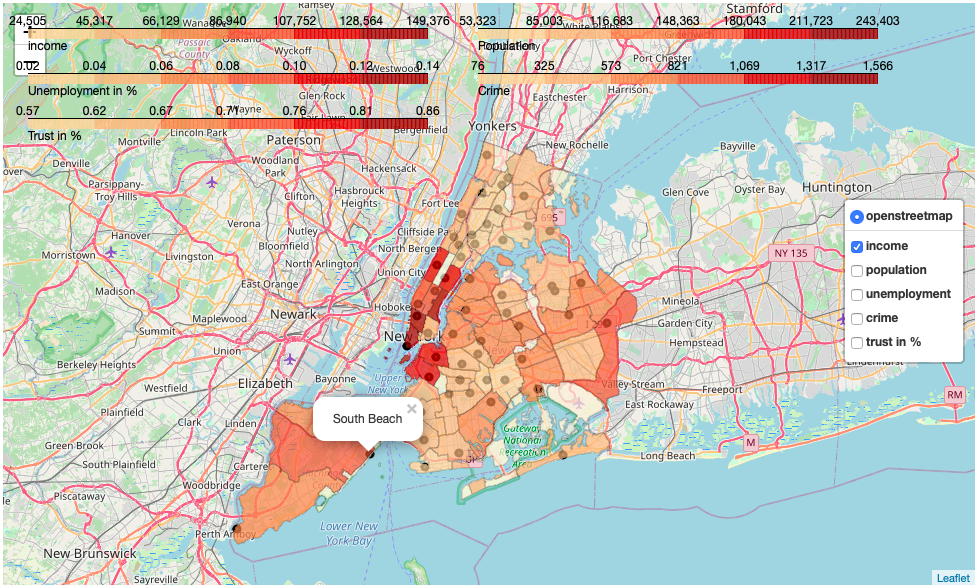
With the Layer Control you get the checkbox for selecting the different data.
使用“ 图层控件”,您将获得用于选择其他数据的复选框。
folium.LayerControl(collapsed=False).add_to(map_NY_N)使用Foursquare获取场地数据 (Getting the venue data with Foursquare)
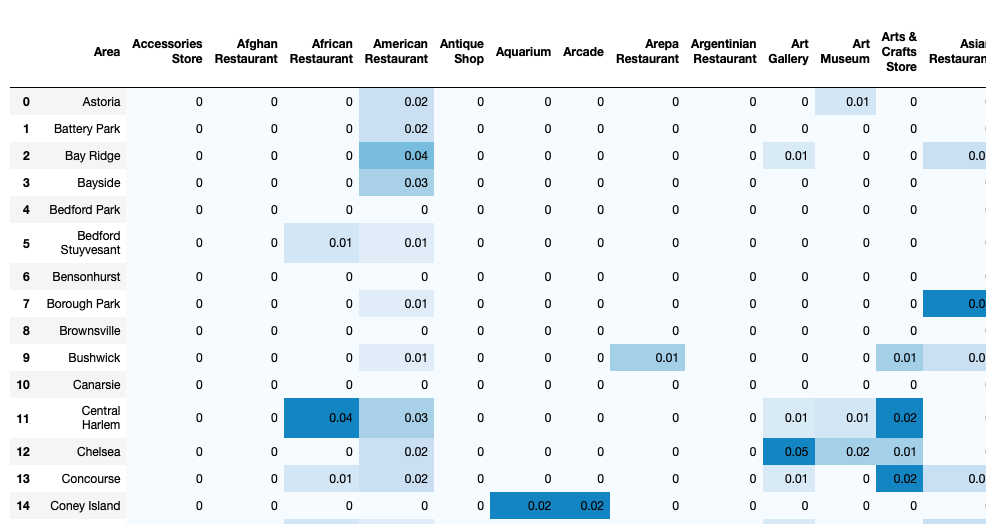
With Foursquare we can get up to 100 venues for each district, which is great for a free service. We will fetch the data and create a venues data frame, the pandas build in method .get_dummies lets us easily use the one hot encoding process to quantify the venues. After grouping the frame by the districts and calculating the mean value we can compare the different districts perfectly. In the jupyter Notebook you can comprehend the venue exploring detailed. But what is one hot encoding again?
使用Foursquare,我们可以为每个地区提供多达100个场所,这是免费服务的绝佳选择。 我们将获取数据并创建一个场所数据框架,熊猫内置方法.get_dummies使我们可以轻松地使用一个热编码过程来量化场所。 在按区域对框架进行分组并计算平均值之后,我们可以完美地比较不同的区域。 在jupyter Notebook中,您可以详细了解场地。 但是又是什么一种热编码?
One Hot Encoding is a process in the data processing that is applied to categorical data, to convert it into a binary vector representation for use in machine learning algorithms
一种热编码是数据处理中的一种过程,用于分类数据,将其转换为二进制矢量表示形式,供机器学习算法使用
One-Hot Encoding simply creates one column for every possible value and put a 1 or 0 in the appropriate column.
一键编码仅为每个可能的值创建一列,然后在适当的列中放入1或0。
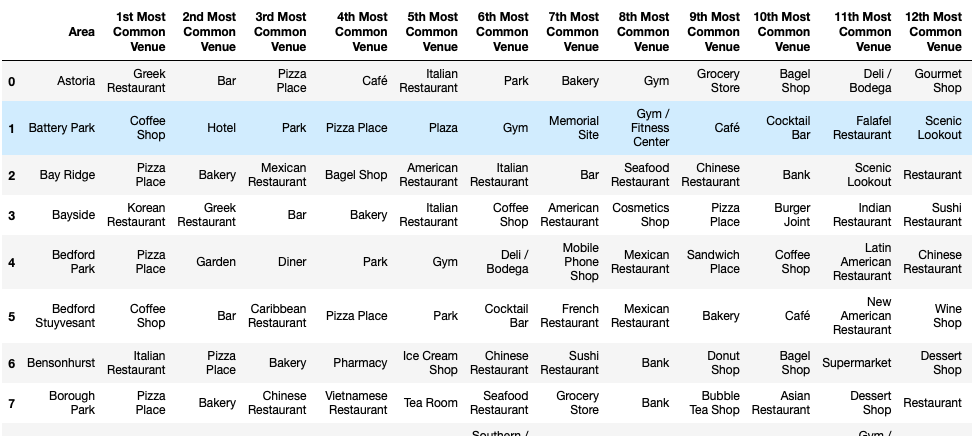
最常见的场所 (The most common venues)
For the comparison of the districts we would like to create a table with a function which gives us the most common venues of each district. We can use this function later to explore the different cluster by their venues.
为了比较各区,我们希望创建一个带有功能的表格,该功能为我们提供了每个区最常见的场所。 稍后我们可以使用此功能,根据其场所探索不同的集群。
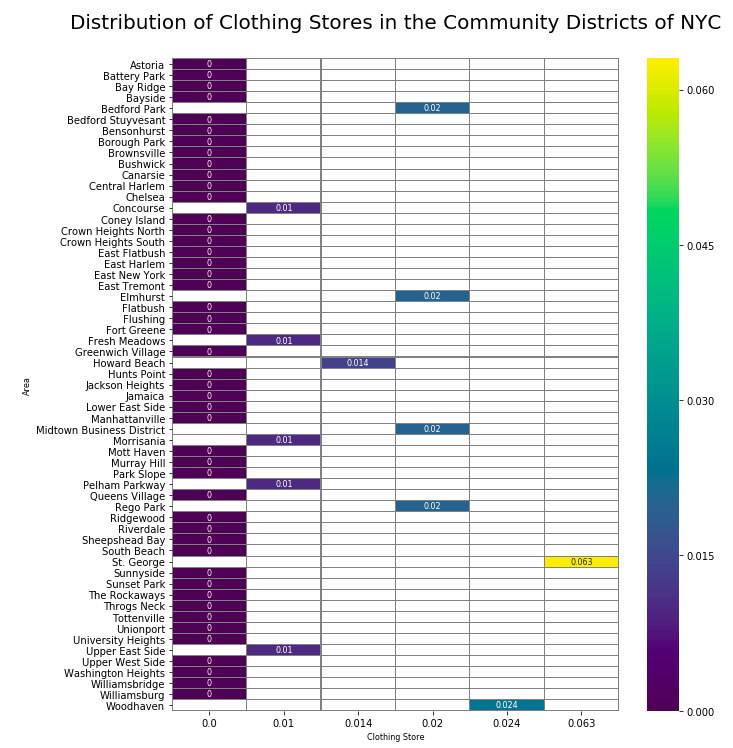
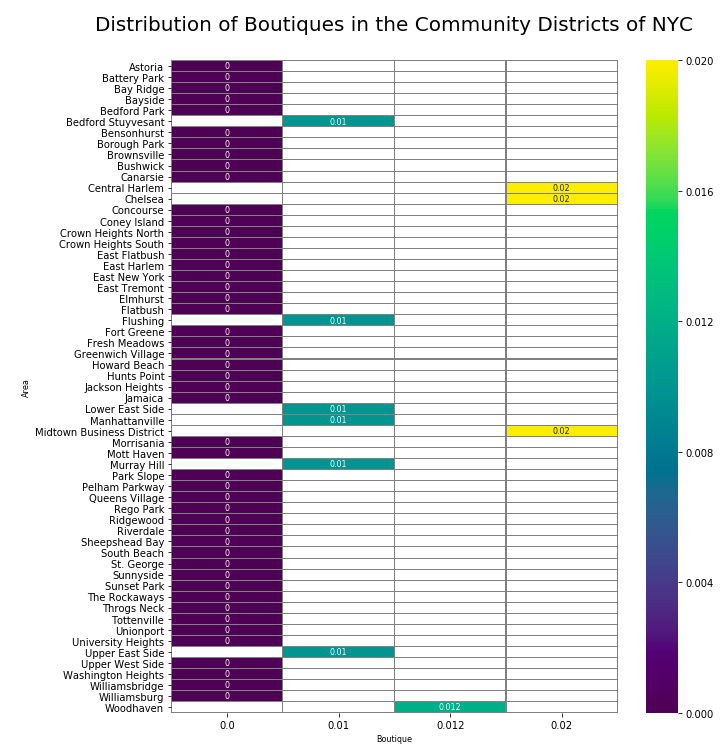
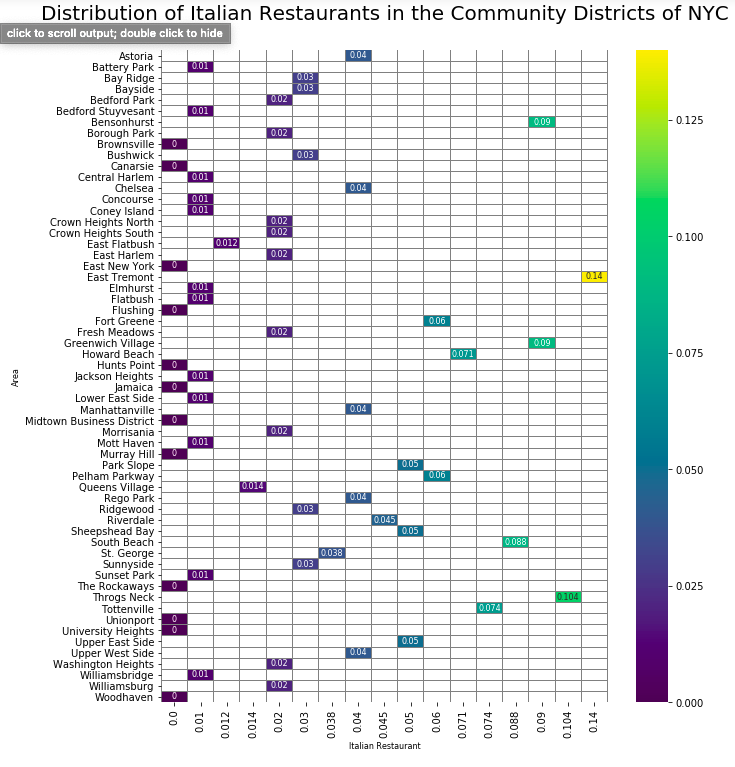
目标场地的热图 (Heat-map of the target venues)
Related to the requirements of the customer we will have a closer look at the distribution of the Clothing Stores, Boutiques and Italien Restaurants in the City.
根据客户的需求,我们将更详细地了解城市中服装店,精品店和意大利餐厅的分布。
5.分析与建模 (5. Analysing and Modelling)
You can find the detailed code here
您可以找到详细的代码 这里
This project has a need for data analysing through data exploring we will only use a simple classification algorithm but the main part is not about a machine learning model. We will use the k-means clustering followed by more data exploring and visualisation to expand our feeling for the data and understanding of the city.
这个项目需要通过数据探索进行数据分析,我们将仅使用简单的分类算法,但主要部分不涉及机器学习模型。 我们将使用k-means聚类,然后进行更多数据探索和可视化,以扩大我们对城市数据和理解的感觉。
K-means is a method that aims to partition n data points into k clusters where each data point is assigned to the cluster with the nearest mean. The goal is to minimize the sum of all squared distances within a cluster.
K均值是一种旨在将n个数据点划分为k个簇的方法,其中每个数据点均以最接近的均值分配给该簇。 目的是最小化群集内所有平方距离的总和。
To find the perfect number of cluster the most common approach is the elbow method. Therefore we run the algorithm multiple times and then plotting the related score.
要找到理想的簇数,最常用的方法是弯头方法。 因此,我们多次运行该算法,然后绘制相关分数。
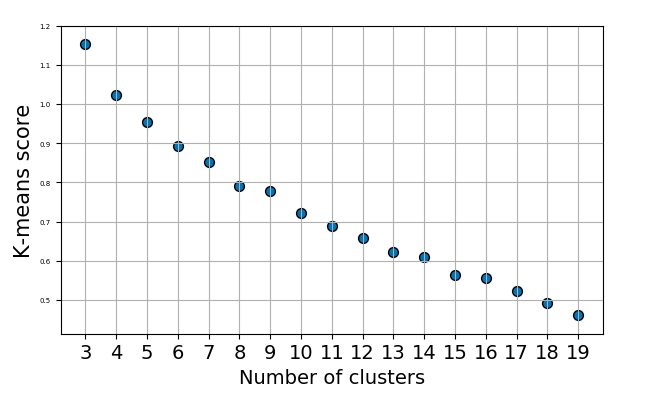
As you can see the elbow method is sometimes not very conclusive. But there are numerous different methods to determine the best number of clusters. The second method I used ist the Silhouette coefficient.
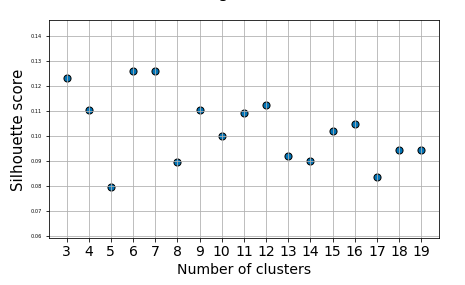
如您所见,肘部方法有时不是很确定。 但是,有许多不同的方法可以确定最佳群集数。 我使用的第二种方法是Silhouette系数。
The Silhouette coefficient is calculated using the mean intra-cluster distance and the mean nearest-cluster distance for each sample. For each point p, first find the average distance between p and all other points in the same cluster this is a measure of cohesion (A). Then find the average distance between p and all points in the nearest cluster, this is a measure of separation from the closest other cluster (B). The silhouette coefficient for p is defined as the difference between B and A (B-A) divided by the greater of the two (max(A,B))
使用每个样本的平均集群内距离和平均最近集群距离来计算Silhouette系数。 对于每个点p,首先找到p和同一簇中所有其他点之间的平均距离,这是内聚力(A)的量度。 然后找到p与最近的群集中所有点之间的平均距离,这是与最近的其他群集(B)分离的量度。 p的轮廓系数定义为B和A之间的差(BA)除以两者中的最大值(max(A,B))
There are numerous quantitative methods of evaluating clustering results, you will see by using them as tools with the full understanding of the limitations the combination of contrasting methods rises the quality of your choice, if you be aware of actually examine the results, kind of a human inspection and making a determination based on an understanding of what the data represents, what a cluster represents, and what the clustering is intended to achieve, you will find the perfect number of clusters.
评估聚类结果的定量方法很多,如果您将其用作工具并充分了解其局限性,那么如果您知道实际检查结果的话,对比方法的组合可以提高选择的质量。通过对数据代表什么,集群代表什么以及将要实现的集群的理解进行人工检查和确定,您将找到理想数量的集群。
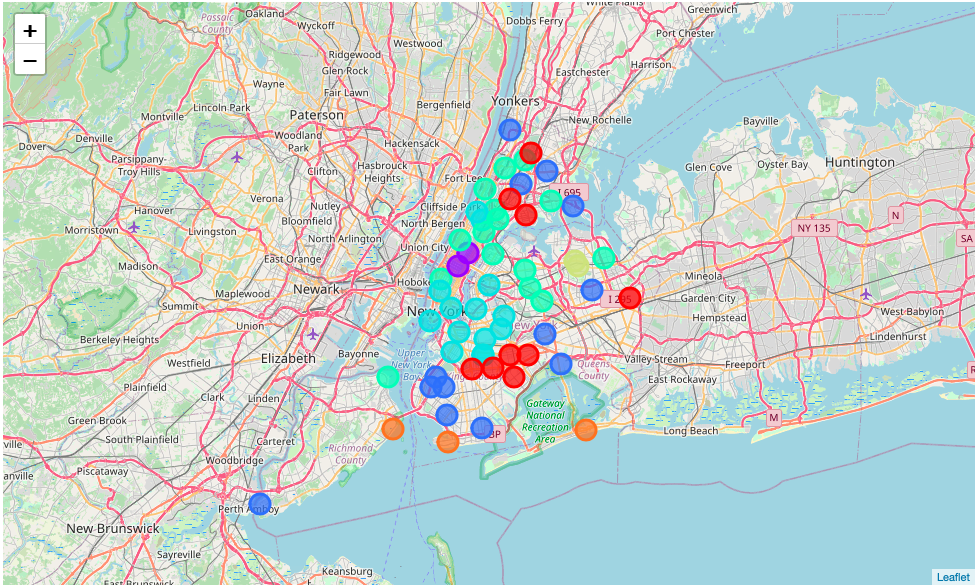
This is the clustered map of each Community District by the venue structure and similarity.
这是根据会场结构和相似性划分的每个社区区的聚类地图。
分析投资者要求 (Analyzing the Investor requirements)
where solving the Business Problem begins
解决业务问题的起点
The clustered map above includes all venues we have fetched from Foursquare including the irrelevant venues, except the socio economic data. For the quality of the result it is important to deal only with relevant features, which have an impact on the decision of the Investor. Beginning from this part we will deploy the recently mentioned features weight matrix.
上面的群集地图包括我们从Foursquare获取的所有场所,包括不相关的场所,但社会经济数据除外。 对于结果的质量,重要的是仅处理相关特征,这些特征会影响投资者的决策。 从这一部分开始,我们将部署最近提到的功能权重矩阵。
Initially we prepare and merge the data frames to include only the necessary columns.
最初,我们准备并合并数据帧以仅包括必要的列。
For the next part Feature Scaling is very important.
对于下一部分, 功能缩放非常重要。
Feature scaling is a technique to change the values of columns in the dataset to use a common scale, without losing information or distorting the differences in the ranges of the values. This can be achieved through Normalization and Standardization
特征缩放是一种将数据集中的列的值更改为使用公共比例的技术,而不会丢失信息或扭曲值范围内的差异。 这可以通过标准化和标准化来实现
Normalization is a scaling technique which rescales the features so that the data will fall in the range of [0,1] to bring them to a comparable grade.
规范化是一种缩放技术,可以对特征进行重新缩放,以使数据落入[0,1]的范围内,以使它们达到可比的等级。
Standardization is a scaling technique which rescales the features the way they range between [-1,1] by the properties of a standard normal distribution with the mean μ=0 and the standard deviation, σ=1, where μ is the average and σ is the standard deviation from the average.
标准化是一种缩放技术,通过标准均值μ= 0和 标准偏差σ= 1,其中μ是平均值,而σ是与平均值的标准偏差。
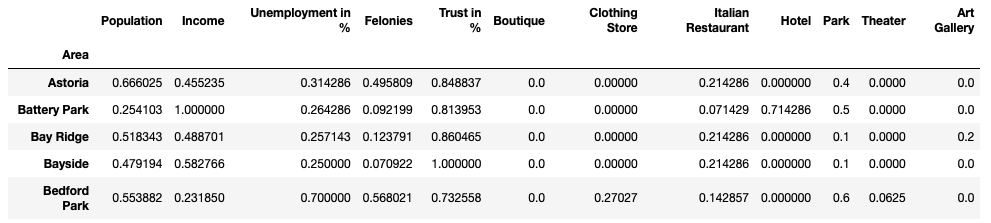
So after the normalization and setting the index on the Area our data frame looks like the following:
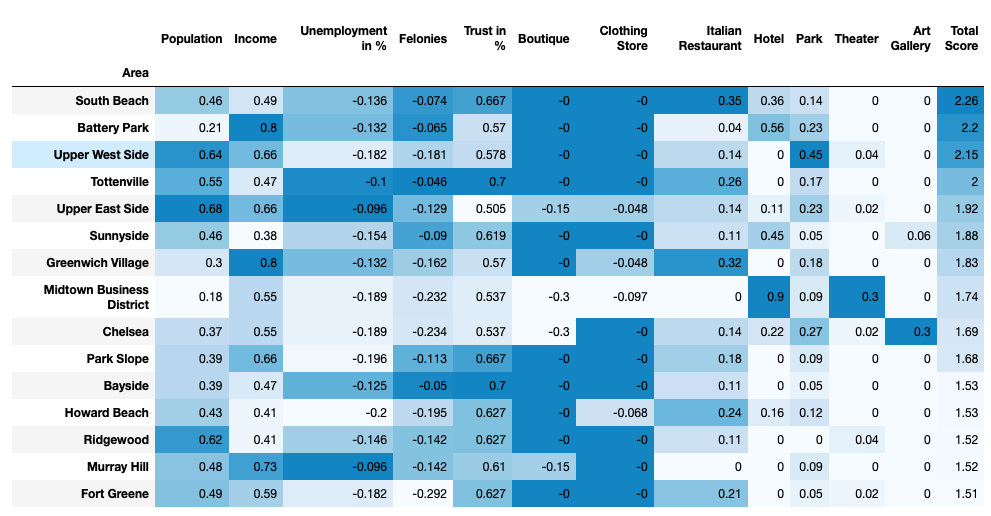
因此,在标准化并在Area上设置索引后,我们的数据框如下所示:
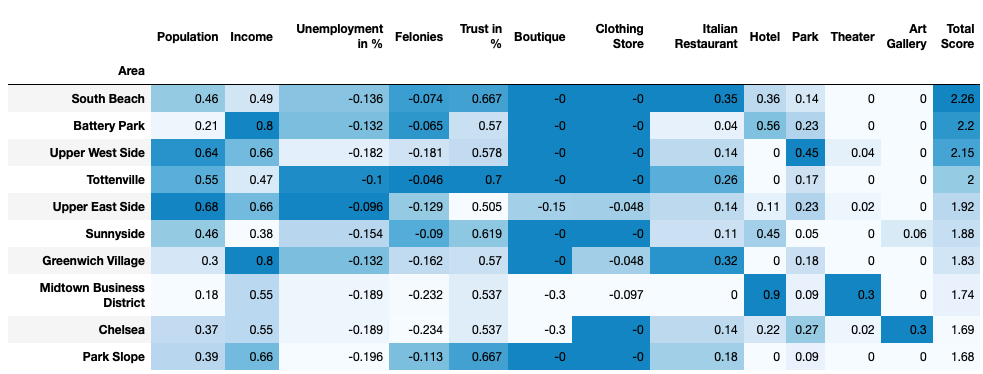
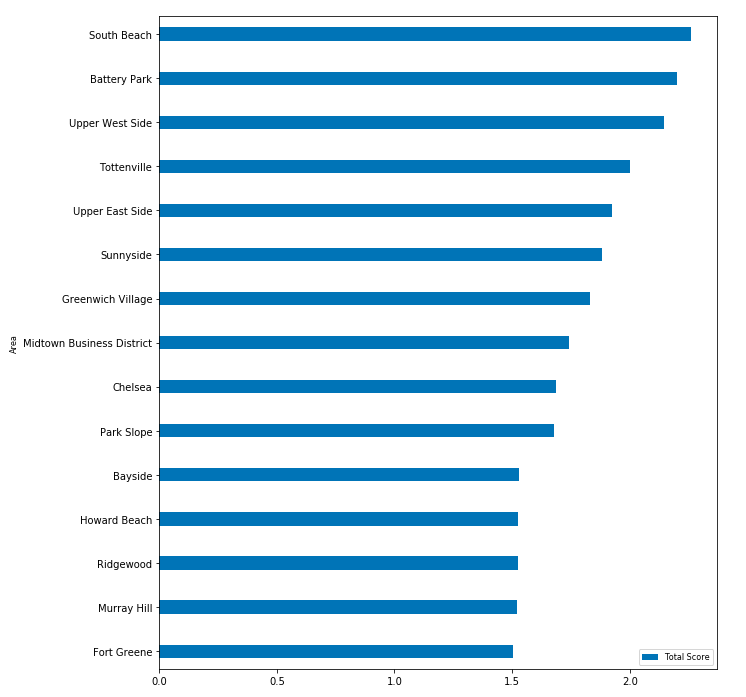
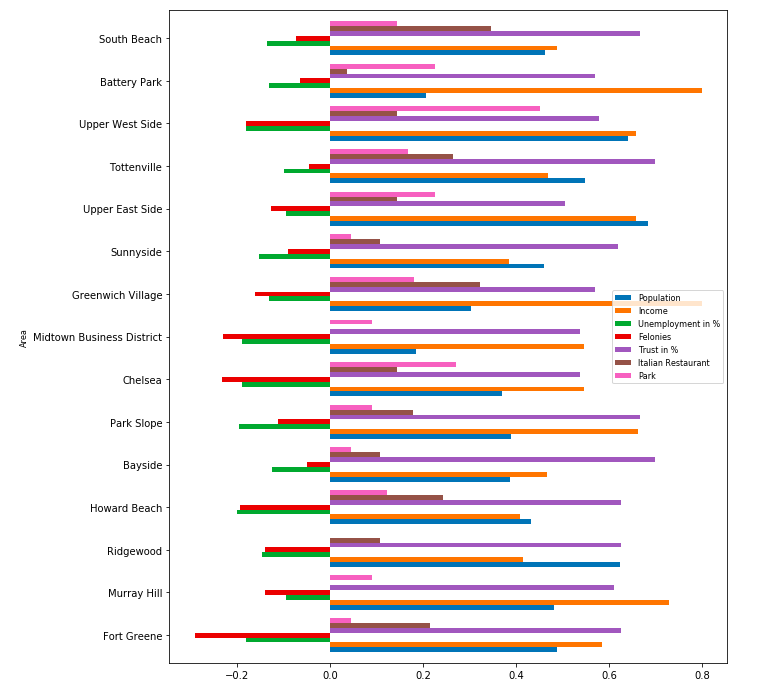
Now we can multiply the features weight matrix and calculate the total score column, with some simple visualisation the data frame looks pretty informative.
现在,我们可以将特征权重矩阵相乘并计算总分列,通过一些简单的可视化,数据框看起来很有用。
After applying the k-means method featuring this data frame (dropping the total score column) won’t get a visualization of the best districts numerically, but it shows us which districts are similar in accordance to the investor requirements. We will repeat the same process as mentioned before, finding the perfect number of clusters with the two method previously explained.
在应用了具有该数据框的k-means方法(删除总分列)后,将无法从数字上直观地看到最佳地区,但可以根据投资者的需求向我们显示哪些地区相似。 我们将重复前面提到的相同过程,并使用前面介绍的两种方法找到理想的簇数。
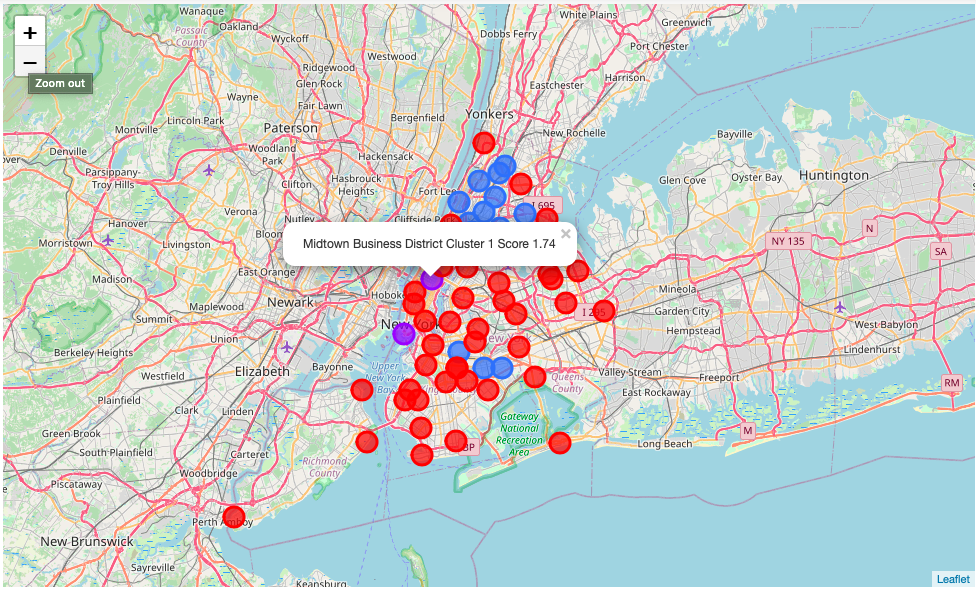
Red cluster 0 ist the medium level cluster the total mean of the features is mediocre. The mean total score is 1.39, but it’s notable that it includes 5 of the top scored districts, especially South Beach and Tottenville, which are located in Staten Island. There are also 3 high ranked districts from Manhatten included. The rest of the cluster is moderate.
红色簇0和中等水平簇的特征总平均值中等。 平均总分是1.39,但值得注意的是,它包括5个得分最高的地区,尤其是位于史坦顿岛的南海滩和托特维尔。 曼哈顿还包括3个排名较高的地区。 集群的其余部分为中等。
The purple Cluster 1 is the high ranked Cluster it consists of only 2 districts with an median total score of 1.97. The districts of this cluster Battery Park and Midtown Business District scoring with a high occurrence of hotels but low population.
紫色的聚类1是排名最高的聚类,它仅由2个区域组成,中位数总分为1.97。 这个集群的炮台公园和中城商业区的地区得分很高,旅馆的发生率很高,但人口很少。
The blue Cluster 2 is the substandard faction, with a median total score of 0.67 and except of the population, trust and parks the mean values are very low.
蓝色的簇2是不合标准的派系,平均总得分为0.67,除了人口,信任和公园之外,平均值非常低。
6.评估 (6. Evaluation)
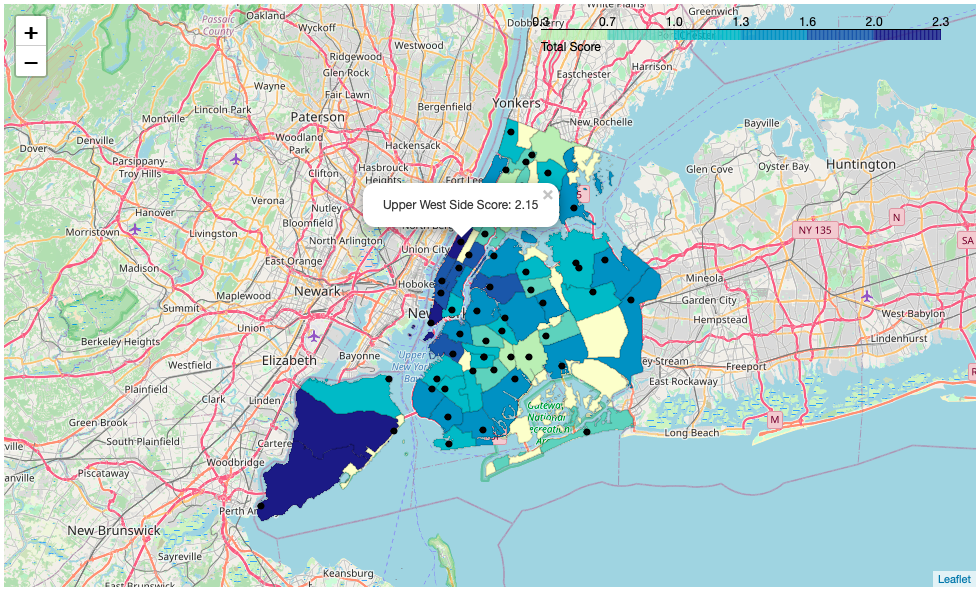
As you may see presenting the customer a clustered map is not a result, which is a good foundation for finding the perfect location of the Store. But the weighted heatmap is great to work with. We are going to explore this data frame further. Presenting a map with the total scores has much more information for the decision of the customer, combining this map with the choropleth map of the socio economic data is superb to visualize the data frames interactive.
您可能会看到,向客户展示集群地图并不是结果,这是找到商店理想位置的良好基础。 但是加权热图非常有用。 我们将进一步探索该数据框架。 呈现具有总分的地图可为客户决策提供更多信息,将该地图与社会经济数据的choropleth地图相结合可以很好地可视化交互式数据框架。
可视化总成绩 (Visualize the total score)
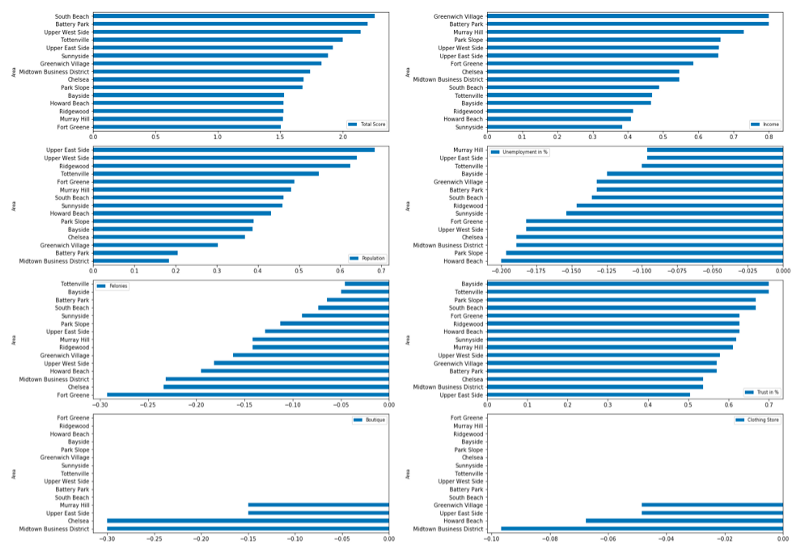
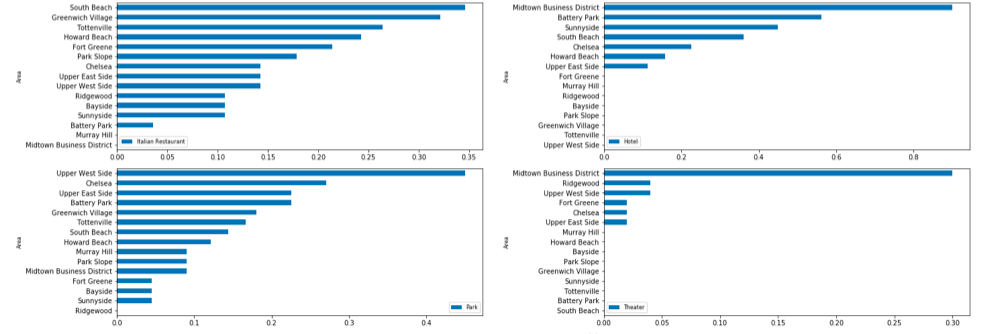
Bar plots of the top 15 districts
前15个区的条形图
Supportive to the maps are the following bar plots of the sorted top 15 results, to get a contrasting view of the data.
下面的条形图对地图的前15个结果进行了排序,以支持这些地图,以形成对比的数据视图。
7.结果讨论 (7. Discussion of the Result)
Our analysis shows that there are several promising districts for the store. Especially South Beach, Upper West Side and Battery Park are high rated. The Distribution of Clothing Stores was the highest in St.George and of Boutiques in Midtown Business District.
我们的分析表明,这家商店有几个很有希望的地区。 尤其是南海滩 , 上西区和炮台公园很高。 在圣乔治和中城商业区的精品店中,服装店的分布最高。
As you can see from the map the Cluster 0 (red) is the medium cluster for the requirements of the Customer, it is a pretty big cluster and includes some of the best scored districts. The purple Cluster is mostly located in Manhatten and consist of only 2 high ranked districts. The blue cluster should be ignored.
从地图上可以看到,集群0( 红色 )是满足客户需求的中型集群,它是一个很大的集群,其中包括一些得分最高的地区。 紫色星团大部分位于曼哈顿,仅由2个排名较高的地区组成。 的 蓝色簇应忽略。
South Beach located in Staten Island gained the highest score. There is a high frequency of Italian restaurants and the factor that it is a good place to live with a low Crime Rate compensates the medium socio economic data. Choosing this location could mean that the Store will profit from regular customers but there won’t be as many tourists and walk in customers as in Manhatten.
位于史泰登岛的南海滩获得最高分。 意大利餐馆的出现频率很高,并且这是一个犯罪率低的好地方,这弥补了中等社会经济数据的不足。 选择这个位置可能意味着该商店将从常规客户那里获利,但是不会有像曼哈顿那样多的游客和步行者。
Upper Westside scores with high income, population and parks but there are no hotels directly in the district, which could lead to less touristic customers. On the oter hand the Central Park is close by, which is a touristic hotspot. But probably more touristic than South Beach. On the other hand this is a place where a lot of wealthy people live and the store could benefit from regular customers. It could be a great place to live if the customer prefers to live right in the city Center. The proximity to the Central Park a touristic hot spot could maybe compensate the lack of hotels in the relation of touristic customers.
上西区的收入,人口和公园都很高,但该地区没有直接的酒店,这可能会减少游客人数。 另一方面,中央公园就在附近,这是一个旅游热点。 但可能比南滩更具旅游意义。 另一方面,这里是许多有钱人居住的地方,商店可以从普通顾客中受益。 如果客户更喜欢住在市中心,那将是一个理想的居住地。 靠近中央公园的旅游热点也许可以弥补旅游客户关系方面缺乏酒店的问题。
The Battery Park is a touristic hotspot in New York even though the low population it is in the top 3 districts and got the highest income score. The few People who can afford to live in the top of Manhatten have a high income furthermore there are lots of hotels located in and around the area which guarantees for a great mix of tourists and regular customers.
炮台公园是纽约的旅游热点,尽管人口稀少,是前三名地区,并且收入最高。 少数有能力在曼哈顿上山生活的人收入较高,此外,该地区及周边地区还有许多酒店,这些酒店保证了游客和固定客户的大量融合。
Tottenville the 4. place is in Staten Island too and has the lowest crime and the lowest unemployment rate of the top 15. The trust score is also one of the highest. Furthermore it has a high overall score and is pretty similar to South Beach.
排名第四的托特维尔也在史坦顿岛,犯罪率最低,前15名的失业率最低。信任度也是最高的之一。 此外,它的总体得分很高,与南海滩非常相似。
要做出一个主要决定: (There is one main decision to make:)
Manhatten or Staten Island
曼哈顿或史泰登岛
8.结论 (8. Conclusion)
Purpose of this project was to identify districts which fits best to the diverse requirements of the customer. By evaluating and quantifying his imaginations with the weighted matrix it was possible to identify several districts which combines his requirements for the location of the store and personal living wishes.
该项目的目的是确定最适合客户多样化需求的地区。 通过使用加权矩阵评估和量化他的想象力,可以确定几个区域,这些区域结合了他对商店位置和个人生活愿望的要求。
For finding the perfect location we now have to go deeper and analyse the top 10 to 15 districts more detailed. We could compare specific neighbourhoods and add more detailed data like tourism frequency to finally find the perfect neighbourhood or even the best street for the store.
为了找到理想的位置,我们现在必须更深入地分析更详细的前10至15个地区。 我们可以比较特定的社区,并添加更多详细数据(例如旅游频率),以最终找到商店的理想社区甚至最佳街道。
翻译自: https://medium.com/@patrich94/new-york-city-the-battle-of-the-neighbourhoods-73d10987cb
相似邻里算法


 被折叠的 条评论
为什么被折叠?
被折叠的 条评论
为什么被折叠?
 到【灌水乐园】发言


