


 这篇博客探讨了如何运用Python和机器学习算法来预测足球比赛的结果,详细阐述了预测过程和技术细节。
足球预测
By Aditya Pethe
通过阿蒂亚·皮特(Aditya Pethe)
From September to January every year, football takes over America. Games dominate TV Sunday and Monday nights, and my brother tears his hair out each week over his consistently underperforming fantasy teams. The hype seems to reach an unbearable level by the time the playoffs roll around.
每年的9月至1月,足球席卷美国。 游戏在星期日和星期一晚上占据着电视台的主导地位,而我的兄弟每周都在表现不佳的幻想队中大放异彩。 季后赛到来之时,炒作似乎已经到了难以忍受的地步。
But is there a way to measure and forecast that hype? I decided to use one of my favorite NFL players, Peyton Manning, in order to explore seasonality in Deephaven’s Jupyter Notebooks. Using a dataset of Manning’s Wikipedia search frequencies taken over an 8 year period from 2008 to 2016, my goal was to break down how football hype evolved throughout the season.
但是,有没有一种方法可以衡量和预测这种炒作? 我决定使用我最喜欢的NFL球员之一Peyton Manning来探索Deephaven的Jupyter笔记本的季节性。 使用从2008年到2016年的8年期间内Manning的Wikipedia搜索频率的数据集 ,我的目标是弄清整个赛季足球宣传的演变。
To do this, I decided to take two approaches to analyzing seasonality. The first was the traditional ARIMA model, and the second was the newer Fbprophet library. I would use both these methods to fit, predict, and validate models to see which was better at understanding NFL hype.
为此,我决定采用两种方法来分析季节性。 第一个是传统的ARIMA模型,第二个是较新的Fbprophet库。 我将使用这两种方法来拟合,预测和验证模型,以查看哪种方法更适合理解NFL宣传。
我们的数据 (OUR DATA)
We can plot our data in Deephaven with the following code:
我们可以使用以下代码在Deephaven中绘制数据:
At a top-level glance, our data is log-transformed Wikipedia page views for Peyton Manning taken each day for about 8 years. The data appears to exhibit some strong seasonal trends that we can look into.
从最高层次看,我们的数据是对Peyton Manning进行日志转换的Wikipedia页面视图,大约每天进行8年。 数据似乎显示出一些我们可以研究的强烈季节性趋势。

Additionally, before we begin breaking down our data, we want a consistent way to visualize our forecasts. We can produce a function that takes our training, testing, and any forecast data and plots it with Deephaven. This allows us to combine analysis from multiple libraries and methods with Deephaven’s powerful and interactive plotting.
此外,在开始分解数据之前,我们需要一种一致的方式来可视化我们的预测。 我们可以产生一个函数,将我们的训练,测试和所有预测数据都用Deephaven进行绘制。 这使我们能够将来自多个库和方法的分析与Deephaven强大而交互式的绘图相结合。
有马 (ARIMA)
The ARIMA model stands for autoregressive, integrated moving average model.
ARIMA模型代表自回归,集成移动平均模型。
The Autoregressive, or AR component of the model, is a linear combination of the previous N seasonal lags. For our Peyton Manning model, this means some linear combination of the previous N weeks, months, or years.
模型的自回归或AR分量是前N个季节滞后的线性组合。 对于我们的Peyton Manning模型,这意味着前N周,几个月或几年的线性组合。

The moving average component of the model is a linear combination of the error terms for the previous N seasonal lags, like so:
模型的移动平均成分是前N个季节滞后的误差项的线性组合,如下所示:

The ARIMA model will estimate the coefficients for both these linear combinations, given three parameters as input:
给定三个参数作为输入,ARIMA模型将估算这两个线性组合的系数:
p: The order of the autoregressive model (the number of lagged terms), described in the AR equation above.
p:自回归模型的顺序(滞后项的数量),在上面的AR方程中描述。
q: The order of the moving average model (the number of lagged terms), described in the MA equation above.
q:移动平均模型的阶数(滞后项的数量),如上面的MA方程所述。
d: The number of differences required to make the time series stationary. A stationary time series is essentially a time series without a time-dependent trend, excluding the seasonality.
d:使时间序列固定所需的差数。 固定时间序列本质上是没有季节性相关趋势的时间序列,不包括季节性。
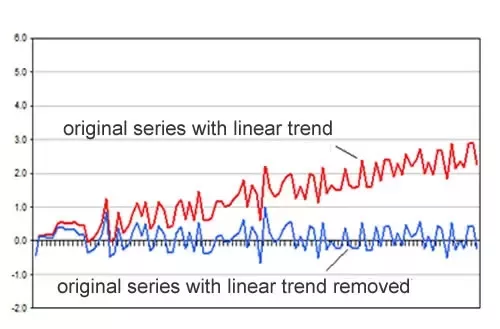
In the example below, the blue time series would be considered stationary, while the red would be nonstationary, even though both may exhibit seasonal patterns.
在下面的示例中,蓝色时间序列将被认为是平稳的,而红色时间序列将被视为非平稳的,即使这两个时间序列都可能呈现季节性变化。
Now that we know what parameters we need to find, we can analyze our Peyton Manning data. At first glance, our data seems stationary. There doesn’t appear to be a time-dependent trend outside seasonal fluctuations, but we can test for this using the Augmented Dickey-Fuller Test.
既然我们知道需要找到什么参数,就可以分析Peyton Manning数据。 乍一看,我们的数据似乎稳定。 除季节性波动外,似乎没有随时间变化的趋势,但是我们可以使用增强Dickey-Fuller检验进行检验。
Our test returns a p-value well below the significance level, so we can confirm that our model is indeed stationary. Our parameter value for d is zero.
我们的测试返回的p值远低于显着性水平,因此我们可以确认我们的模型确实是平稳的。 d的参数值为零。
Now we need to find the parameter values of P and Q. In order to do this, I used autocorrelation plots. Autocorrelation and partial autocorrelation plots can tell how strongly lagged terms correlated with a given observation. While partial autocorrelation plots tell the correlation with the lag term independent of other lags, autocorrelation plots factor in the “inertia” from other lags. Because of this, we can use partial autocorrelation to estimate our parameter for P, and autocorrelation to estimate our parameter for Q.
现在我们需要找到P和Q的参数值。为此,我使用了自相关图。 自相关图和局部自相关图可以说明滞后项与给定观察值的相关程度。 尽管部分自相关图告诉了与滞后项的相关性,而与其他滞后无关,但自相关图将其他滞后的“惯性”作为因素。 因此,我们可以使用偏自相关来估计P的参数,并使用自相关来估计Q的参数。

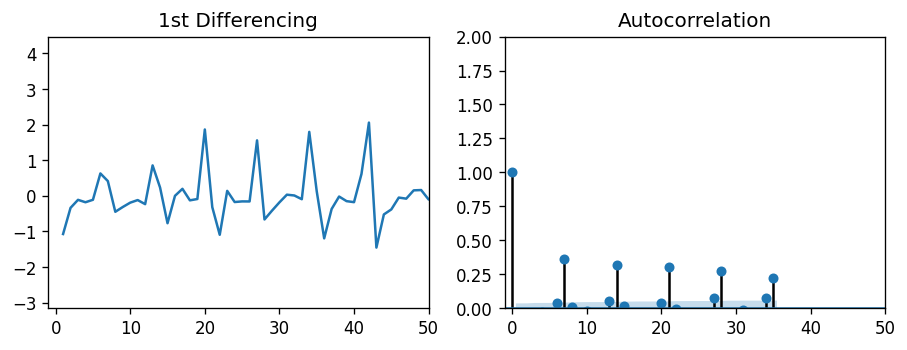
Both plots show a periodic behavior in the lags, each around 7 days in length. This makes sense — Peyton Manning search frequency probably increases on game nights, when football is being played. In fact, these autocorrelation plots even show a slight 6-day correlation, which is likely due to Sunday night football. But since the lags of 7 days have the highest correlation with the observed value, we can estimate both P and Q to be 7.
这两个图都显示了滞后的周期性行为,每个周期的长度约为7天。 这是有道理的-在踢足球的比赛之夜,佩顿·曼宁的搜索频率可能会增加。 实际上,这些自相关图甚至显示了轻微的6天相关性,这很可能是由于周日晚上的足球比赛所致。 但是由于7天的滞后与观测值具有最高的相关性,因此我们可以估计P和Q均为7。
I should note that these autocorrelation plots presented a problem. The ARIMA parameters did not allow for lag inputs of over ~10, which meant that looking at annual (365) or monthly (30) seasonality would be very difficult.
我应该注意,这些自相关图存在问题。 ARIMA参数不允许滞后输入超过〜10,这意味着查看年度(365)或每月(30)的季节性非常困难。
Now that we have our parameters, we can produce our ARIMA model.
现在我们有了参数,我们可以生成ARIMA模型。
Before we make our forecasts, we can check our model assumptions for variance and normality with a residual plot and density plot.
在进行预测之前,我们可以使用残差图和密度图检查模型假设的方差和正态性。
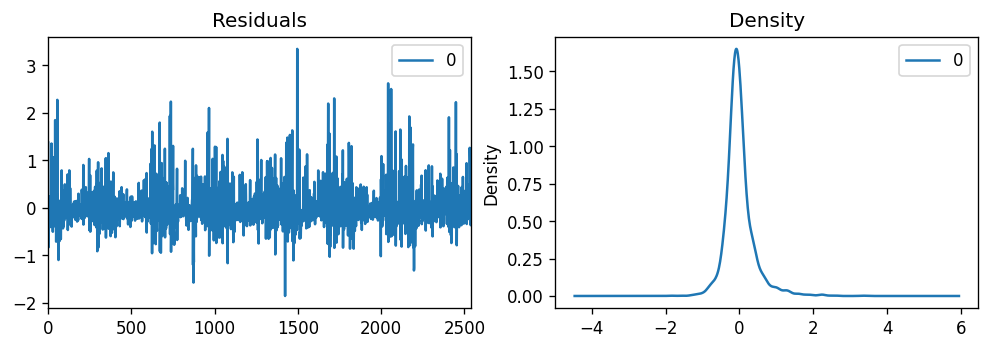
Since the residuals appear to be randomly distributed, and the kernel probability density plot appears normal, our model assumptions check out.
由于残差似乎是随机分布的,并且核概率密度图似乎是正态的,因此我们的模型假设得到了检验。
Plotting our model yields the following:
绘制模型将得出以下结果:
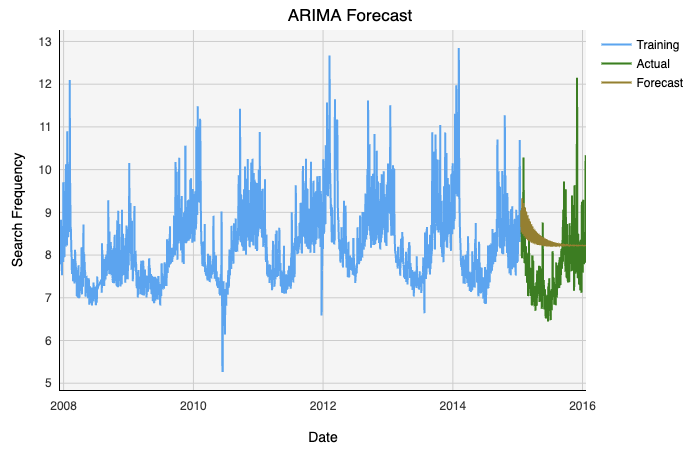
As we can see, not having access to the other scales of seasonality hurts this model’s viability. Not being able to capture multiple seasonal trends means that ARIMA is limited by one seasonality at a time. Regardless, we can return some error estimators to validate our model.
如我们所见,无法使用其他季节性尺度会损害该模型的生存能力。 无法捕获多个季节趋势意味着ARIMA一次只能受到一个季节的限制。 无论如何,我们可以返回一些误差估计量来验证我们的模型。
MSE (mean squared error): 0.8916776825661407
MSE (均方误差):0.8916776825661407
MAPE (mean absolute percentage error): 0.10230290573107942
MAPE (平均绝对百分比误差):0.10230290573107942
萨里玛 (SARIMA)
We can actually validate our ARIMA model using the auto-SARIMA model from pmdarima. The auto-SARIMA model estimates the parameter values for p, q, and d for us so there is no need for the prelude above. In addition, SARIMA takes m, the period of seasonality, as a parameter. Unfortunately, the model parameter limitations again constrain us to m < 10, so we may only look at weekly seasonality.
实际上,我们可以使用pmdarima的auto-SARIMA模型验证ARIMA模型。 auto-SARIMA模型为我们估计p , q和d的参数值,因此不需要上面的前奏。 另外,SARIMA将季节周期m用作参数。 不幸的是,模型参数限制再次将我们限制为m <10 ,因此我们可能只查看每周的季节性。
Fitting and plotting our model gives us the following:
拟合和绘制模型可以得到以下结果:
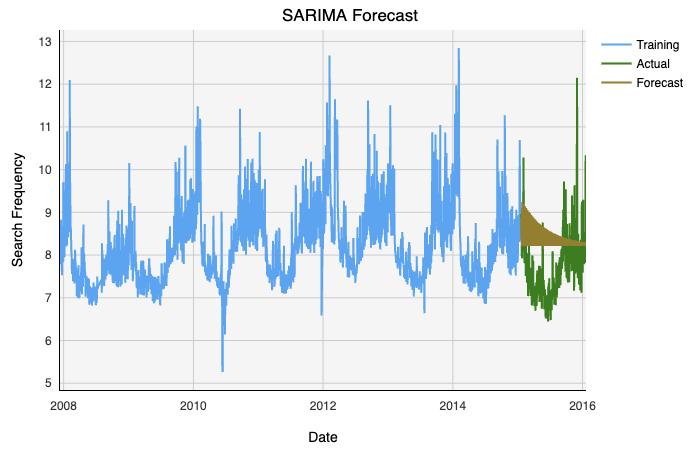
Lastly, we can validate our model with error metrics:
最后,我们可以使用错误指标来验证我们的模型:
MSE (mean squared error): 0.8916776825661407
MSE (均方误差):0.8916776825661407
MAPE (mean absolute percentage error): 0.10789283997956421
MAPE (平均绝对百分比误差):0.10789283997956421
We see that our SARIMA model performed nearly identically to our ARIMA model, and in fact our ARIMA model gave a slightly lower mean absolute percentage error than SARIMA. We can be happy that we picked optimal parameters to fit our ARIMA model with.
我们看到,SARIMA模型的性能几乎与ARIMA模型相同,并且实际上,ARIMA模型的平均绝对百分比误差略低于SARIMA。 我们很高兴选择了适合ARIMA模型的最佳参数。
预言家 (PROPHET)
For our final model, we will be using Fbprophet.
对于我们的最终模型,我们将使用Fbprophet。
Fbprophet is a library from Facebook intended to handle seasonal time-series datasets. Prophet implements a procedure for forecasting time series data based on an additive model where non-linear trends are fit with yearly, weekly, and daily seasonality, plus holiday effects. In general, using Prophet requires much less hands-on work than our ARIMA model, and for the most part, we can feed our data directly into prophet like so:
Fbprophet是Facebook的一个库,用于处理季节性时间序列数据集。 先知实现了一种基于加性模型的时间序列数据预测程序,其中非线性趋势与年,周和日的季节性以及假期效应相吻合。 通常,与我们的ARIMA模型相比,使用Prophet所需的动手工作少得多,并且在大多数情况下,我们可以像这样将数据直接输入到先知中:
This allows us to forecast one year ahead, and compare actual data with expected values and their boundaries.
这使我们可以预测一年,并将实际数据与期望值及其界限进行比较。
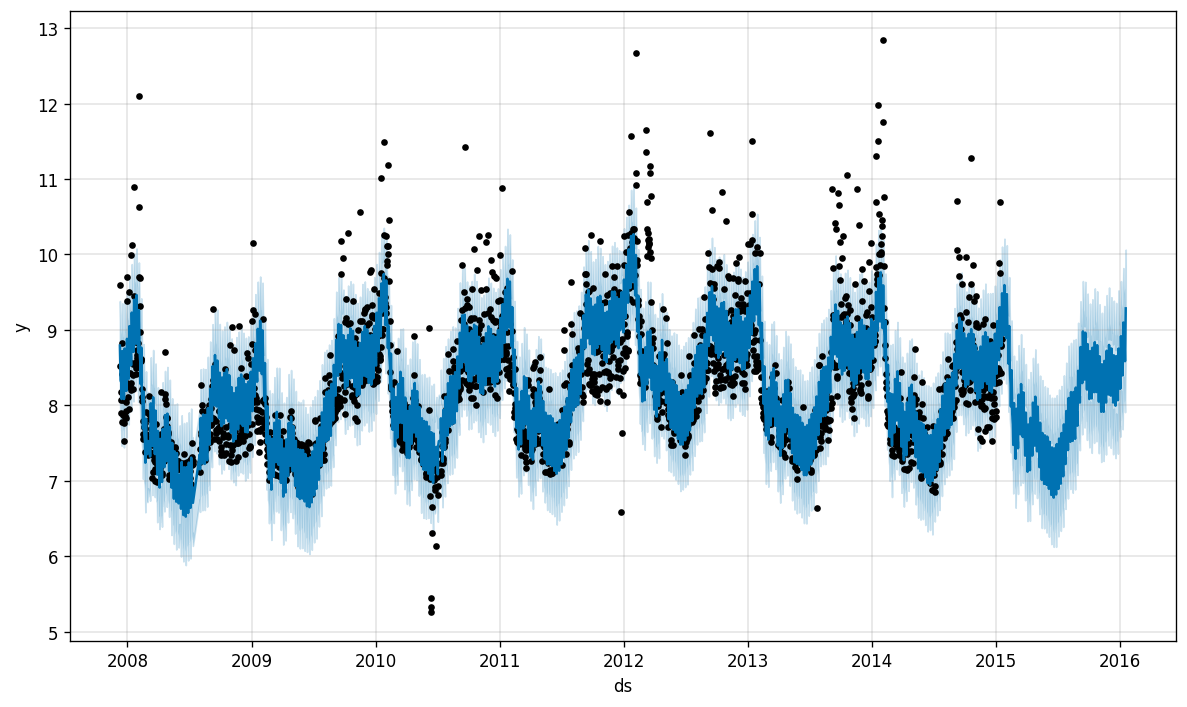
In addition, Prophet allows us to break down this data into seasonal components:
此外,先知使我们可以将这些数据分解为季节性成分:

Manning’s page views peaked in 2012–2013, his MVP year. Unsurprisingly, Monday night football is when most fans look Manning up, and the monthly seasonal breakdown shows the crazy highs of December and March in stark contrast to the great drought of the summer.
曼宁的网页浏览量在他的MVP年度(2012-2013)达到顶峰。 毫不奇怪,周一晚上的足球比赛是大多数球迷抬头看曼宁的时候,每月的季节性故障显示出12月和3月的疯狂高点,与夏季的干旱形成鲜明对比。
Prophet can do even more, and add changepoints to the data, where the trend is most likely to shift.
先知可以做更多的事情,并且可以向数据添加变化点,而趋势最有可能在此变化。
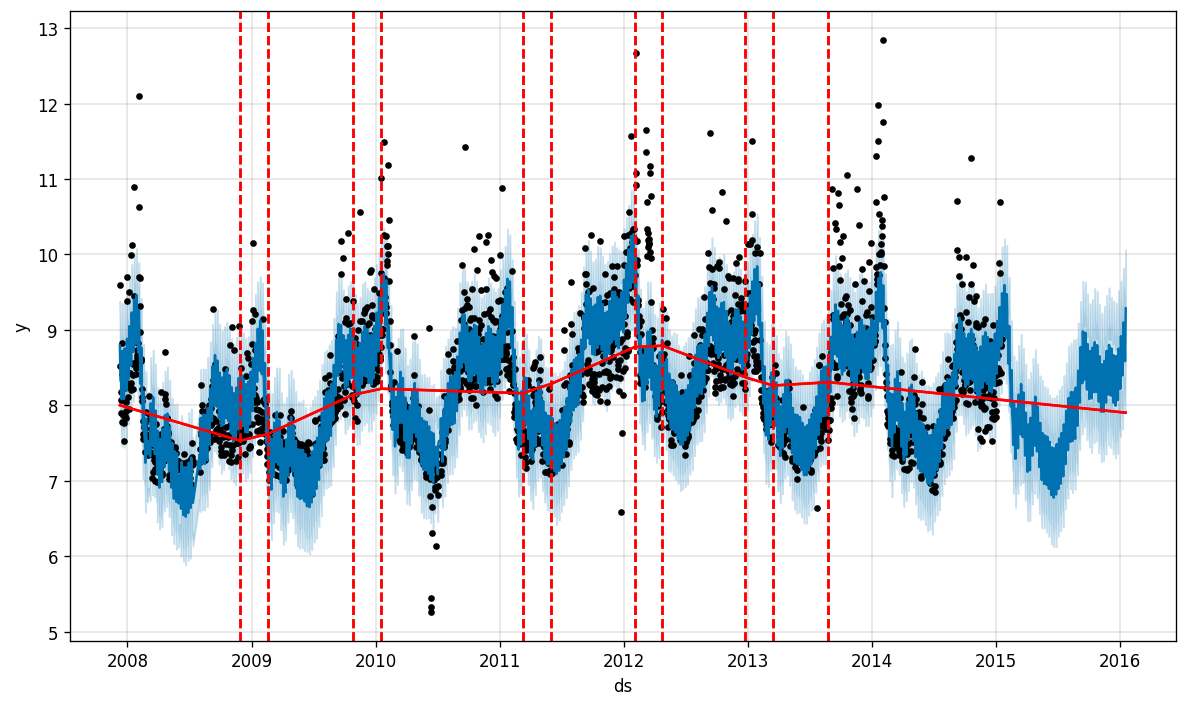
With this feature, Prophet roughly estimates the start and end of the season, especially capturing the window of the playoffs.
通过此功能,先知大致估计了赛季的开始和结束,尤其是捕获了季后赛的窗口。
By the eye test alone, our prophet models look much better and coherent than ARIMA. But we can again validate the model predictions using MSE and MAPE.
仅凭眼睛测试,我们的先知模型看上去比ARIMA更好,更连贯。 但是我们可以再次使用MSE和MAPE验证模型预测。
MSE (mean squared error): 0.35800021765342394
MSE (均方误差):0.35800021765342394
MAPE (mean absolute percentage error): 0.059460265364126956
MAPE (平均绝对百分比误差):0.059460265364126956
结论 (CONCLUSION)
Both error estimators clearly point to Prophet as the more accurate model. For large time-series data with multiple seasonalities, ARIMA has many shortcomings. Simply using regression on previous lags to estimate future values won’t cut it in predicting more complex time-series datasets. ARIMA may be useful for more limited datasets with simpler seasonal effects, but particularly for things like sensor data, page views, or energy consumption, complex nonlinear models like Prophet are required to make predictions.
两种误差估计器都明确指出先知是更准确的模型。 对于具有多个季节性的大型时间序列数据,ARIMA有许多缺点。 只需对先前的滞后使用回归来估计未来值,就无法预测更复杂的时间序列数据集。 ARIMA可能对于季节效应较为简单的有限数据集很有用,但是对于传感器数据,页面浏览量或能源消耗之类的东西尤其如此,需要使用诸如Prophet之类的复杂非线性模型进行预测。
Deephaven’s integration with Jupyter Notebooks allows for users to have unique, library-specific plotting methods and operations side by side with Deephaven features. Deephaven’s plotting in particular provides user-friendly visualization options in interactive plots when used in conjunction with new, cutting edge libraries like fbprophet.
Deephaven与Jupyter Notebooks的集成使用户可以与Deephaven功能并排使用独特的,特定于库的绘图方法和操作。 当与新的尖端库(例如fbprophet)结合使用时,Deephaven的绘图在交互式绘图中尤其提供了用户友好的可视化选项。
翻译自: https://medium.com/dev-genius/forecasting-football-fever-fe46fa779b69
足球预测


 1475
1475

 被折叠的 条评论
为什么被折叠?
被折叠的 条评论
为什么被折叠?
 到【灌水乐园】发言


