


python交互式和文件式
In this tutorial, I will be creating an automated, interactive dashboard of Texas COVID-19 case count by county using python with the help of selenium, pandas, dash, and plotly. I am assuming the reader has some familiarity with python, pandas, and selenium. That’s all you’ll need to create amazing interactive dashboards after reading this tutorial!
在本教程中,我将在Selenium,熊猫,破折号和密谋的帮助下,使用python创建一个按州自动计数的德克萨斯州COVID-19案例的交互式仪表板。 我假设读者对python,pandas和selenium有所了解。 阅读本教程后,您仅需创建出色的交互式仪表板!
A general overview of the steps and what you will learn is as follows:
这些步骤的概述以及您将学到的内容如下:
- Downloading daily updated data from the web using selenium 使用Selenium从Web下载每日更新的数据
- Updating data directories using shutil, glob, and os python libraries 使用shutil,glob和os python库更新数据目录
- Simple cleaning of excel files with pandas 使用熊猫轻松清理Excel文件
- Formatting time series data frames to be input into plotly graphs 格式化时间序列数据帧以输入到绘图图中
- Creating a local web page for your dashboard using dash 使用破折号为仪表板创建本地网页
Before we get started, you will need to download the python libraries that will be used in this tutorial. This can be done with the following command on your terminal:
在开始之前,您需要下载将在本教程中使用的python库。 可以在终端上使用以下命令来完成此操作:
pip install <package name># package names: selenium, pandas, webdriver_manager, shutil, glob, plotly,and dashOne thing to note is that I used Jupyter Notebooks for steps 1–4 and then Spyder for step 5. When I am explaining what a code block does it is usually the one right above the text. All of my code for this tutorial can be found on my GitHub under the Automate collecting of data notebooks file.
需要注意的一件事是,我在步骤1-4中使用了Jupyter Notebooks,然后在步骤5中使用了Spyder。当我解释什么代码块时,通常是在文本上方。 在本教程的所有代码都可以在GitHub上的“自动收集数据笔记本”文件中找到。
Ok, lets get started!
好的,让我们开始吧!
Step 1: Downloading daily updated data from the web using selenium
步骤1:使用Selenium从网上下载每日更新的数据
# import packages
from selenium import webdriver
from webdriver_manager.chrome import ChromeDriverManager
from selenium.webdriver.chrome.options import Options
import shutil
import glob
import os
from unicodedata import *
import time# open a chrome browser using selenium
driver = webdriver.Chrome(ChromeDriverManager().install())# got to web page where excel file links are located
driver.get("https://www.dshs.texas.gov/coronavirus/additionaldata/")# these options allow selenium to download files
options = Options()
options.add_experimental_option("browser.download.folderList",2)
options.add_experimental_option("browser.download.manager.showWhenStarting", False)
options.add_experimental_option("browser.helperApps.neverAsk.saveToDisk", "application/octet-stream,application/vnd.ms-excel")
So this first code block is pretty self explanatory but some things to note. I am installing a selenium chrome web driver, so I don’t have to always re-download the new chrome driver when it gets updated. This driver is used to download the excel file I want online. It will open up a new google chrome window on your computer and go to the web page that provides the daily updated Texas COVID-19 case counts for each county. The standard options of selenium do not allow for downloading files from the web so these options need to be changed to allow that.
因此,这第一个代码块很容易说明,但需要注意一些事项。 我正在安装Selenium chrome网络驱动程序,因此更新时无需总是重新下载新的chrome驱动程序。 该驱动程序用于下载我要在线的Excel文件。 它将在您的计算机上打开一个新的Google Chrome浏览器窗口,然后转到该网页 ,其中提供了每个县的每日更新的德克萨斯州COVID-19案件计数。 Selenium的标准选项不允许从Web下载文件,因此需要更改这些选项以允许这样做。
# initialize an object to the location on the web page and click on it to download
link = driver.find_element_by_xpath('/html/body/form/div[4]/div/div[3]/div[2]/div/div/ul[1]/li[1]/a')
link.click()# Wait for 15 seconds to allow chrome to download file
time.sleep(15)
This block of code clicks on the link to the excel file using a full Xpath. This can be found by right clicking on a page, inspecting it, and right clicking on the link you want to click on, and copying the full Xpath. Then the driver clicks on the link and waits 15 seconds for it to be downloaded which is crucial for the next code block to not give you an error.
此代码块使用完整的Xpath单击指向excel文件的链接。 可以通过以下方法找到:右键单击页面,检查页面,然后右键单击要单击的链接,然后复制完整的Xpath。 然后,驱动程序单击链接,等待15秒钟下载链接,这对于下一个代码块不给您错误是至关重要的。
2. Updating data directories using shutil, glob, and os python libraries
2.使用shutil,glob和os python库更新数据目录
Before reading onward: If you are following at home, you will need to change the paths that I use for both the download directory from ‘/Users/tsbloxsom/Downloads/*.xlsx’ to ‘/Users/<your_username>/Downloads/*.xlsx’
在继续阅读之前 :如果您在家中,则需要将我用于下载目录的路径从'/Users/tsbloxsom/Downloads/*.xlsx'更改为'/ Users / <您的用户名> / Downloads / * .xlsx'
You will also need to change the directory where you want to store your data and python notebooks in from what I use: ‘/Users/tsbloxsom/Documents/GitHub/Texas-census-county-data-project/Automate collecting of data notebooks/*.xlsx’ to ‘/Users/<your_username>/bla/bla/*.xlsx’
您还需要从我使用的位置更改要用于存储数据和python笔记本的目录:'/ Users / tsbloxsom / Documents / GitHub / Texas-census-county-data-project /自动收集数据笔记本/ * .xlsx'到'/ Users / <您的用户名> / bla / bla / *。xlsx'
# locating most recent .xlsx downloaded file
list_of_files = glob.glob('/Users/tsbloxsom/Downloads/*.xlsx')
latest_file = max(list_of_files, key=os.path.getmtime)# replace "\" with "/" so file path can be located by python
latest_file = latest_file.replace("\\", "/")
latest_file# we need to locate the old .xlsx file(s) in the dir we want to store the new xlsx file in
list_of_files = glob.glob('/Users/tsbloxsom/Documents/GitHub/Texas-census-county-data-project/Automate collecting of data notebooks/*.xlsx') # need to delete old xlsx file(s) so if we download new xlsx file with same name we do not get an error while moving it
for file in list_of_files:
    print("deleting old xlsx file:", file)
    os.remove(file)# Move the new file from the download dir to the github dir
shutil.move(latest_file,'/Users/tsbloxsom/Documents/GitHub/Texas-census-county-data-project/Automate collecting of data notebooks/')
This code block is where a lot of the automation happens. It finds the excel file I just downloaded using the glob and os.path.getmtime functions, deletes any old excel file(s) (maybe from the previous day) in the directory I want to store the new excel file in, then moves the new excel file into the GitHub directory. The os.path.getmtime() function returns the time of last modification of the path, so with the max() function, you can find the most recently downloaded excel file.
此代码块是许多自动化发生的地方。 它会使用glob和os.path.getmtime函数找到我刚刚下载的excel文件,并删除我想在其中存储新excel文件的目录中的所有旧excel文件(也许是前一天)。新的excel文件进入GitHub目录。 os.path.getmtime()函数返回路径的最后修改时间,因此使用max()函数,您可以找到最近下载的excel文件。
Step 3: Simple cleaning of excel files with pandas
步骤3:使用熊猫轻松清理excel文件
Now that we have the up-to-date COVID-19 data in the directory we want, there is some cleaning we need to do before it can be plotted.
现在,我们在所需的目录中拥有最新的COVID-19数据,我们需要进行一些清理才能绘制它们。
import pandas as pd
import repd.set_option('display.max_rows', 500)
pd.options.display.max_colwidth = 150# again we need to locate the .xlsx file
list_of_files = glob.glob('/Users/tsbloxsom/Documents/GitHub/Texas-census-county-data-project/Automate collecting of data notebooks/*.xlsx')
latest_file = max(list_of_files, key=os.path.getctime)
print(latest_file.split("\\")[-1])df = pd.read_excel("{}".format(latest_file),header=None)df.head()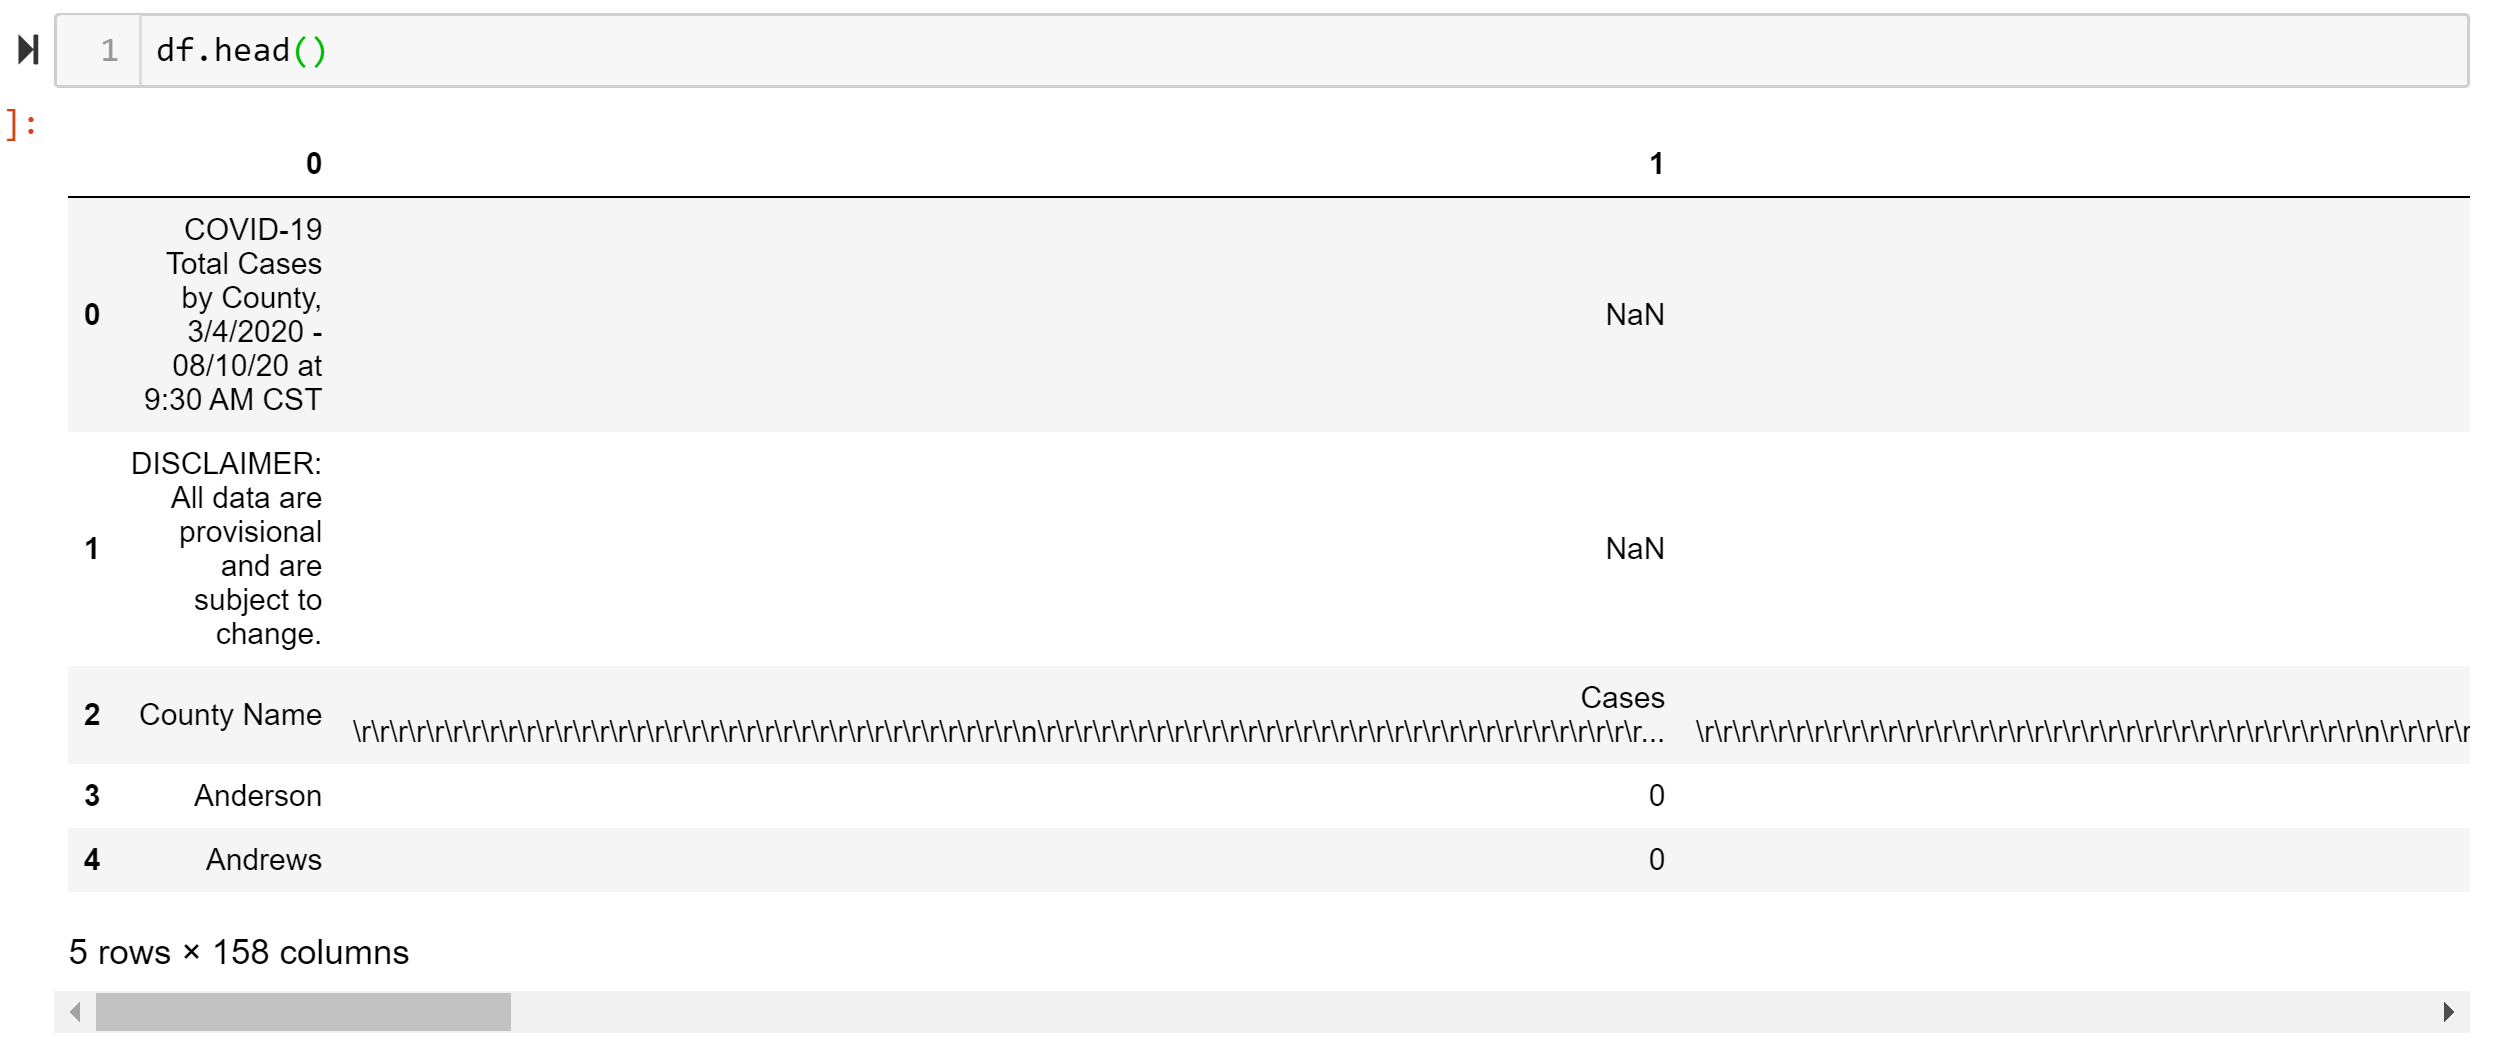
So we read the excel file and convert it to a pandas data frame (df)… and we got some cleaning to do. Lets deal with the first and last few rows of the file.
因此,我们读取了excel文件并将其转换为熊猫数据框(df)…,然后进行了一些清洁工作。 让我们处理文件的前几行和最后几行。
# print out latest COVID data datetime and notes
date = re.findall("- [0-9]+/[0-9]+/[0-9]+ .+", df.iloc[0, 0])
print("COVID cases latest update:", date[0][2:])
print(df.iloc[1, 0])
print(str(df.iloc[262:266, 0]).lstrip().rstrip())#drop non-data rows
df2 = df.drop([0, 1, 258, 260, 261, 262, 263, 264, 265, 266, 267])
First, I want to print out relevant information about the data which is in the first two rows and last few rows, then I want to drop these rows from the df.
首先,我想打印出前两行和最后几行中有关数据的相关信息,然后我要从df中删除这些行。
# clean column names
df2.iloc[0,:] = df2.iloc[0,:].apply(lambda x: x.replace("\r", ""))
df2.iloc[0,:] = df2.iloc[0,:].apply(lambda x: x.replace("\n", ""))
df2.columns = df2.iloc[0]
clean_df = df2.drop(df2.index[0])
clean_df = clean_df.set_index("County Name")# convert clean_df to a .csv file
clean_df.to_csv("Texas county COVID cases data clean.csv")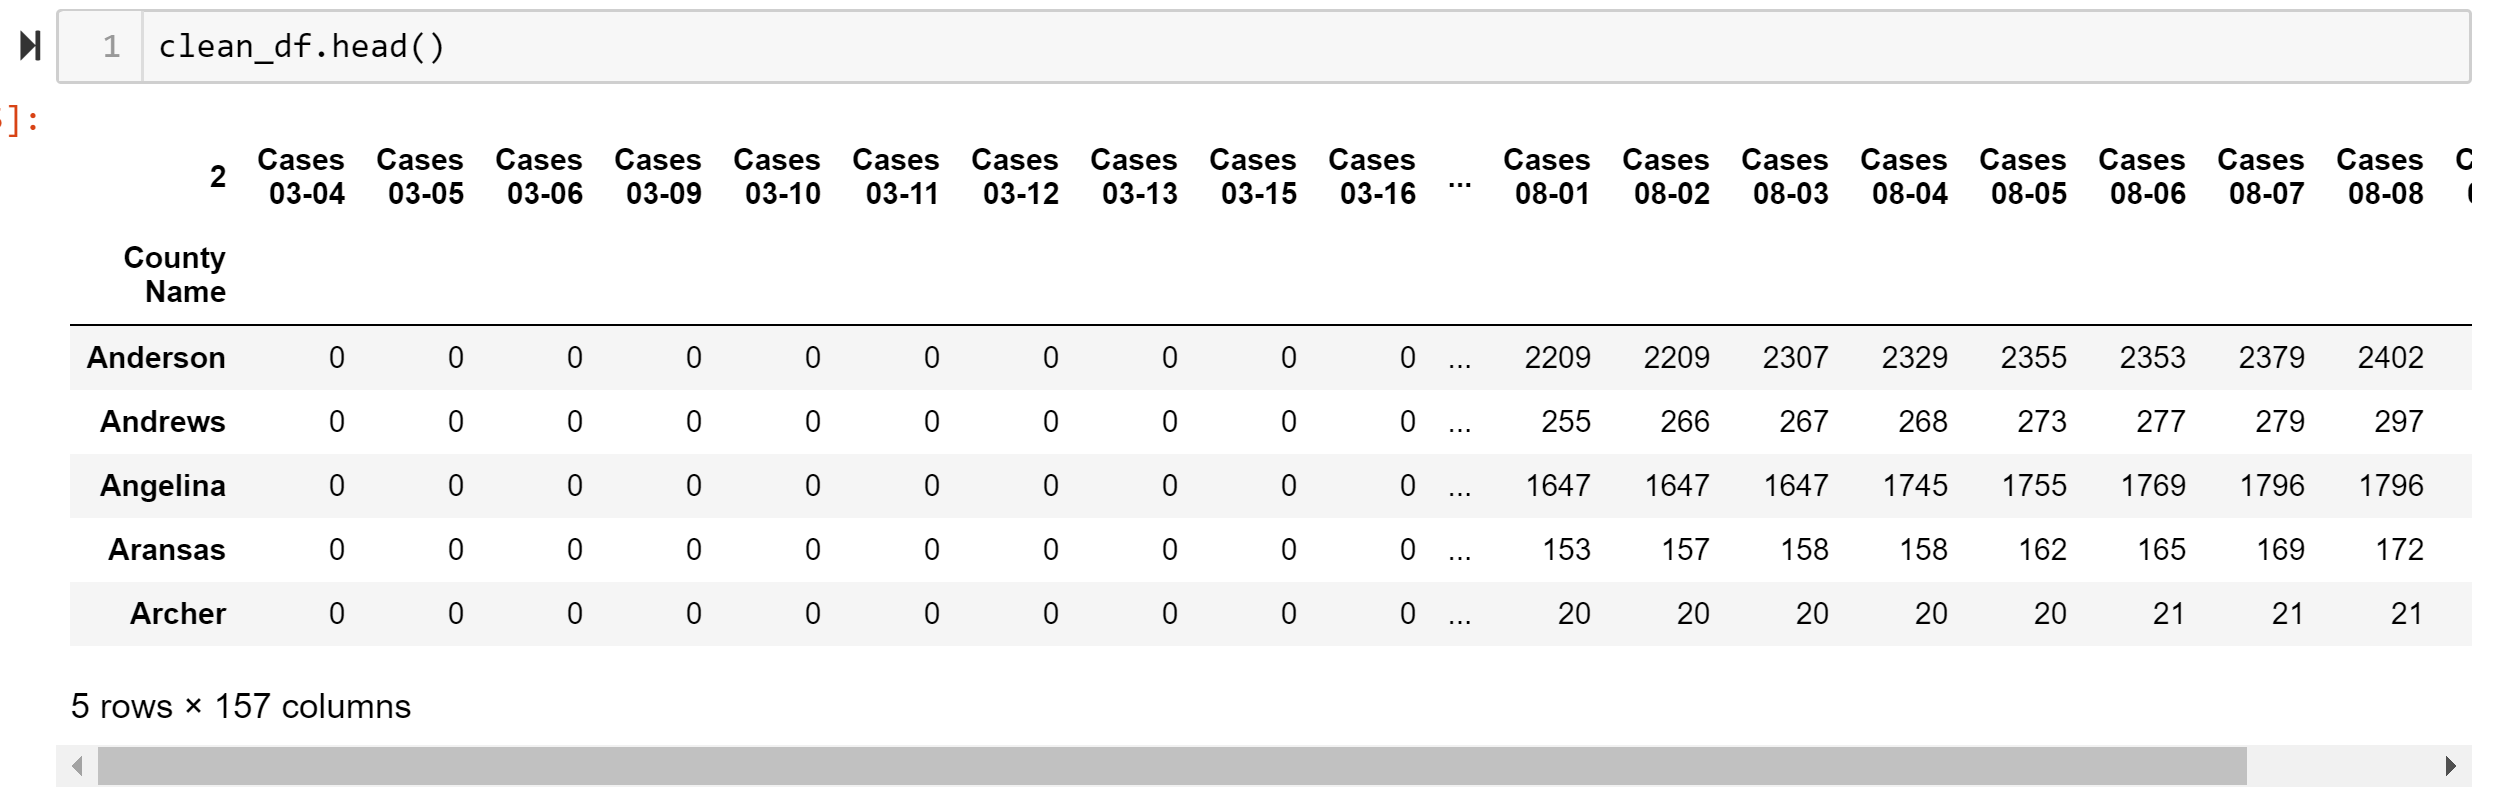
In the above code block, I clean the row for each date where many of these dates had new line, <\n>, and carriage return, <\r>, characters inside the cells. I then make the date row the column names and drop the original date row. We finally have a clean df where the rows are each county in Texas and each column represents number of cases for each date. Finally, I want to convert the df to a .csv file for the next step.
在上面的代码块中,我为每个日期清除了行,其中许多日期在单元格内都有换行符<\ n>和回车符<\ r>。 然后,使日期行成为列名,并删除原始日期行。 我们终于有了一个干净的df,其中的行是德克萨斯州的每个县,每列代表每个日期的案件数。 最后,我想将df转换为.csv文件,以进行下一步。
Step 4: Formatting time series data frames to be input into plotly graphs
步骤4:格式化要输入到绘图图中的时间序列数据帧
import plotly.express as pxlist_of_files = glob.glob('/Users/tsbloxsom/Documents/GitHub/Texas-census-county-data-project/Automate collecting of data notebooks/*.csv')
latest_file = max(list_of_files, key=os.path.getmtime)
latest_file.split("\\")[-1]df = pd.read_csv(latest_file.split("\\")[-1])
Again we are using the glob and os.path.getmtime functions to find the most recent .csv file which is our “Texas county COVID cases data clean.csv”.
再次,我们使用glob和os.path.getmtime函数来查找最新的.csv文件,这就是我们的“德克萨斯州COVID病例数据clean.csv”。
# convert df into time series where rows are each date and clean up
df_t = df.T
df_t.columns = df_t.iloc[0]
df_t = df_t.iloc[1:]
df_t = df_t.iloc[:,:-2]# next lets convert the index to a date time, must clean up dates first
def clean_index(s):
    s = s.replace("*","")
    s = s[-5:]
    s = s + "-2020"
    #print(s)
    return sdf_t.index = df_t.index.map(clean_index)df_t.index = pd.to_datetime(df_t.index)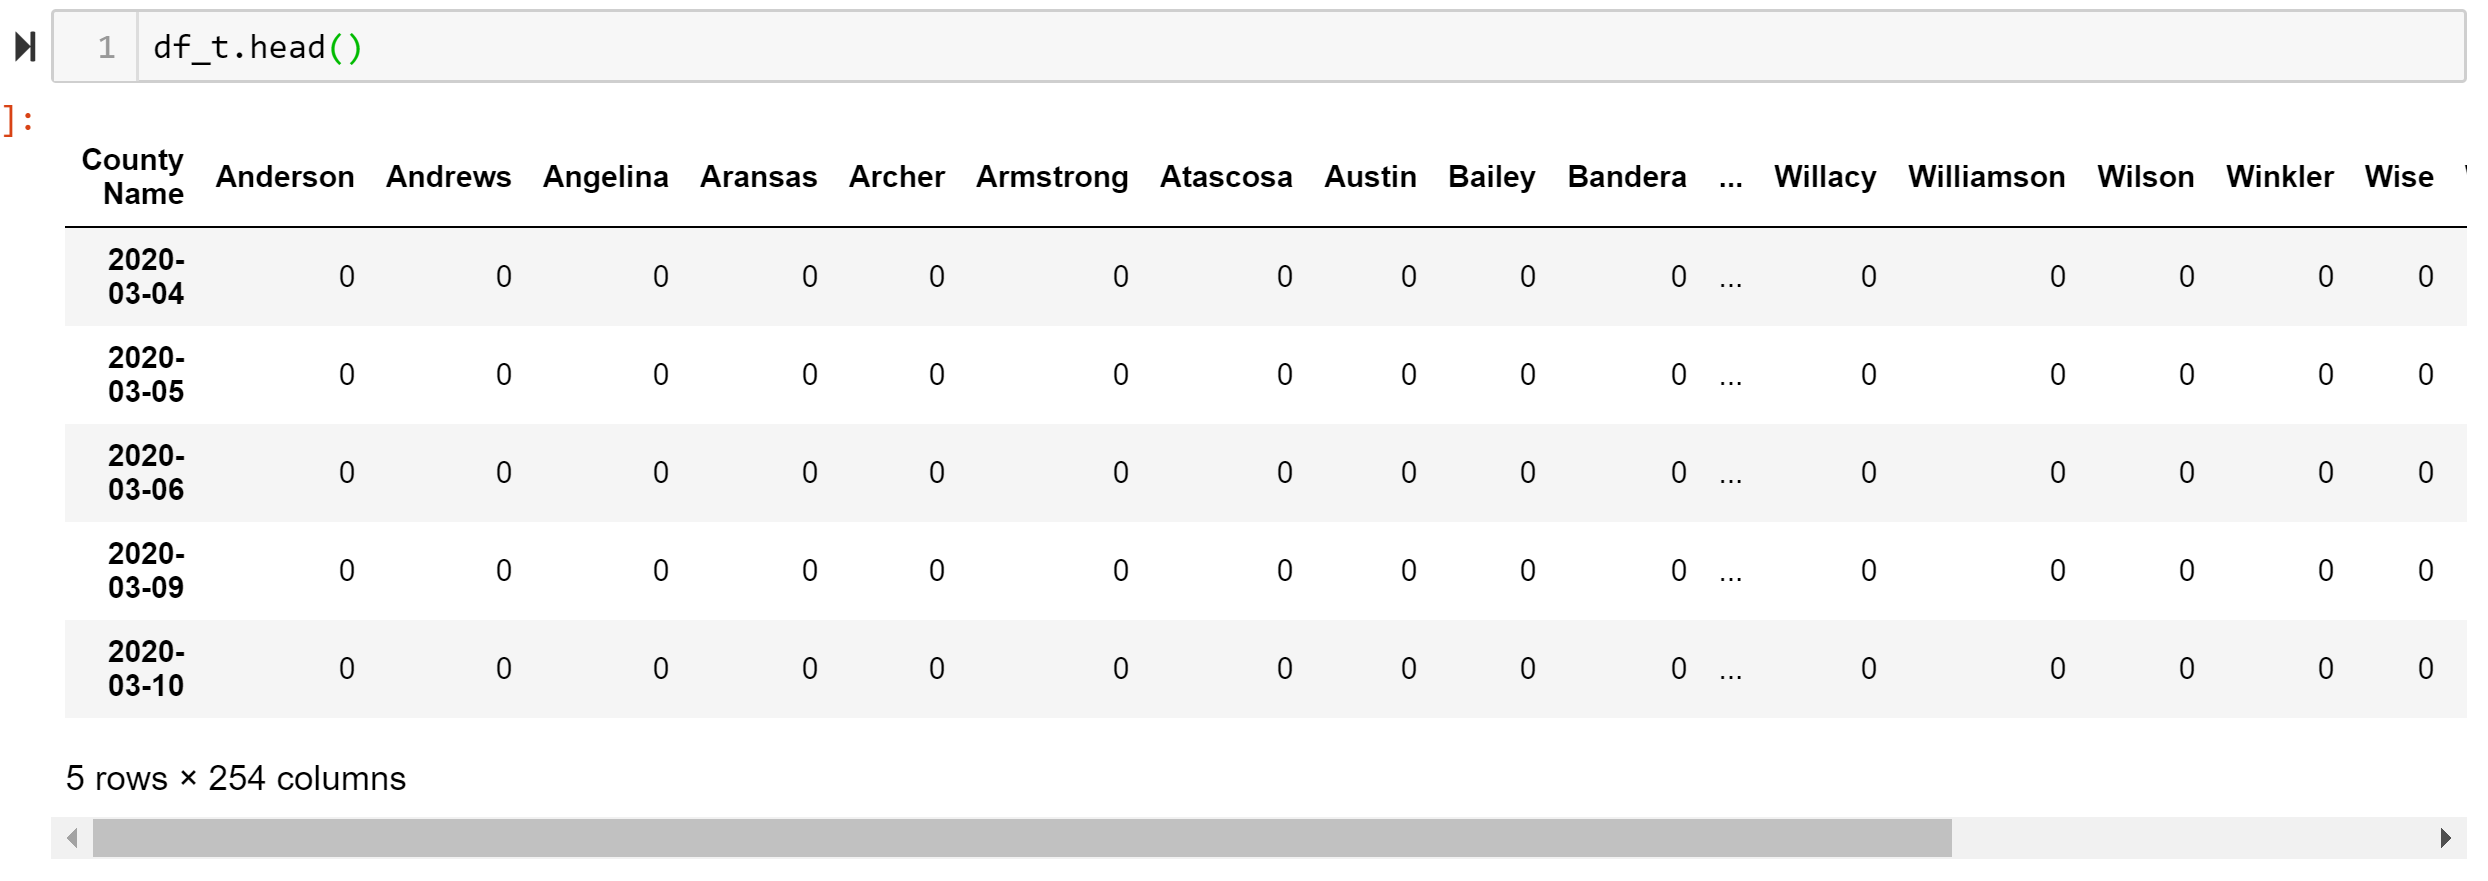
In the above code block, I am converting the data frame into a time series df where the rows are now the dates and the columns are counties. I am also dropping a couple columns that have total cases and number of counties reporting cases. Finally, I am converting the date column into a usable format that can be converted to pandas date_time object which I use the function clean_index for. But we are not done yet.
在上面的代码块中,我将数据帧转换为时间序列df,其中行现在是日期,而列是县。 我还要删除几列,其中包含总病例数和报告病例数的县。 最后,我将date列转换为可用格式,该格式可以转换为使用函数clean_index的pandas date_time对象。 但是我们还没有完成。
# initalize df with three columns: Date, Case Count, and County
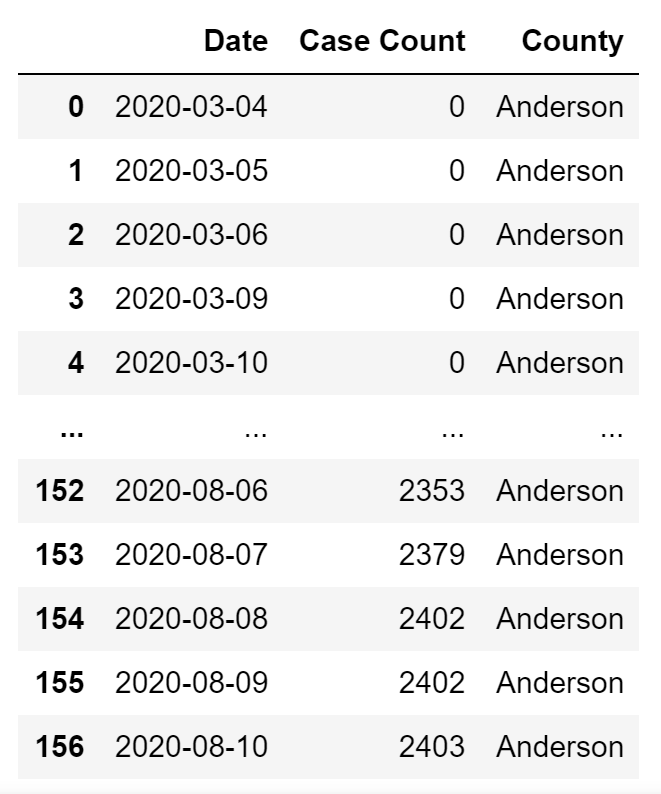
anderson = df_t.T.iloc[0,:]ts = anderson.to_frame().reset_index()ts["County"] = "Anderson"
ts = ts.rename(columns = {"Anderson": "Case Count", "index": "Date"})Our plotly function will take 3 columns as input: Date, Case Count, and County. So we need to convert our wide df into a long df essentially. To do this I first initialize a long df with three columns: a date column, the case count for Anderson County, and a county column with the name of the county in it. Which looks like this:
我们的plotly函数将以3列作为输入:日期,病例数和县。 因此,我们实际上需要将宽df转换为长df。 为此,我首先用三列初始化一个长df:日期列,安德森县的案子计数以及其中包含县名的县列。 看起来像这样:
# This while loop adds all counties to the above ts so we can input it into plotly
x = 1
while x < 254:
    new_ts = df_t.T.iloc[x,:]
    new_ts = new_ts.to_frame().reset_index()
    new_ts["County"] = new_ts.columns[1]
    new_ts = new_ts.rename(columns = {new_ts.columns[1]: "Case Count", "index": "Date"})
    ts = pd.concat([ts, new_ts])
    x += 1#save long form df for dash app
ts.to_csv("time_series_plotly.csv")
The comment of the above code block says it all but we now just loop through the entire wide df and create new_ts long df’s for each county that look like the one for Anderson. Then we concat each long df together and wallah we have ourselves the long df that can be input into plotly and later our dash app show below!
上面的代码块的注释说明了所有内容,但是我们现在仅遍历整个宽df,并为每个县创建new_ts长df,看起来像安德森的那个。 然后,我们将每个长df连接在一起,而Wallah则拥有可以输入到绘图中的长df,随后在下面的破折号应用程序中显示!
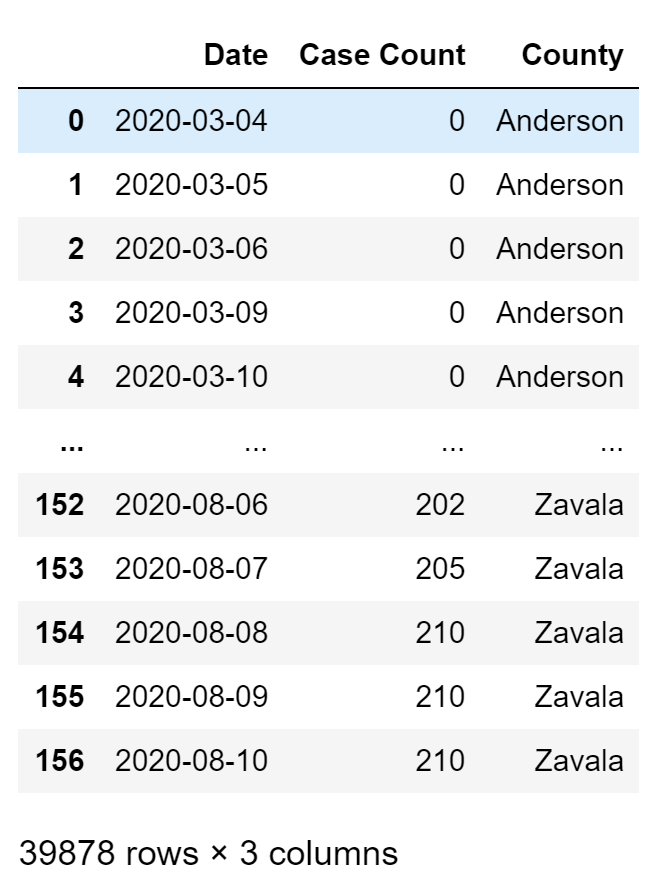
fig = px.scatter(ts, x='Date', y='Case Count', color='County')
fig.update_traces(mode='markers+lines')
#fig.update_traces(mode='lines')
fig.show()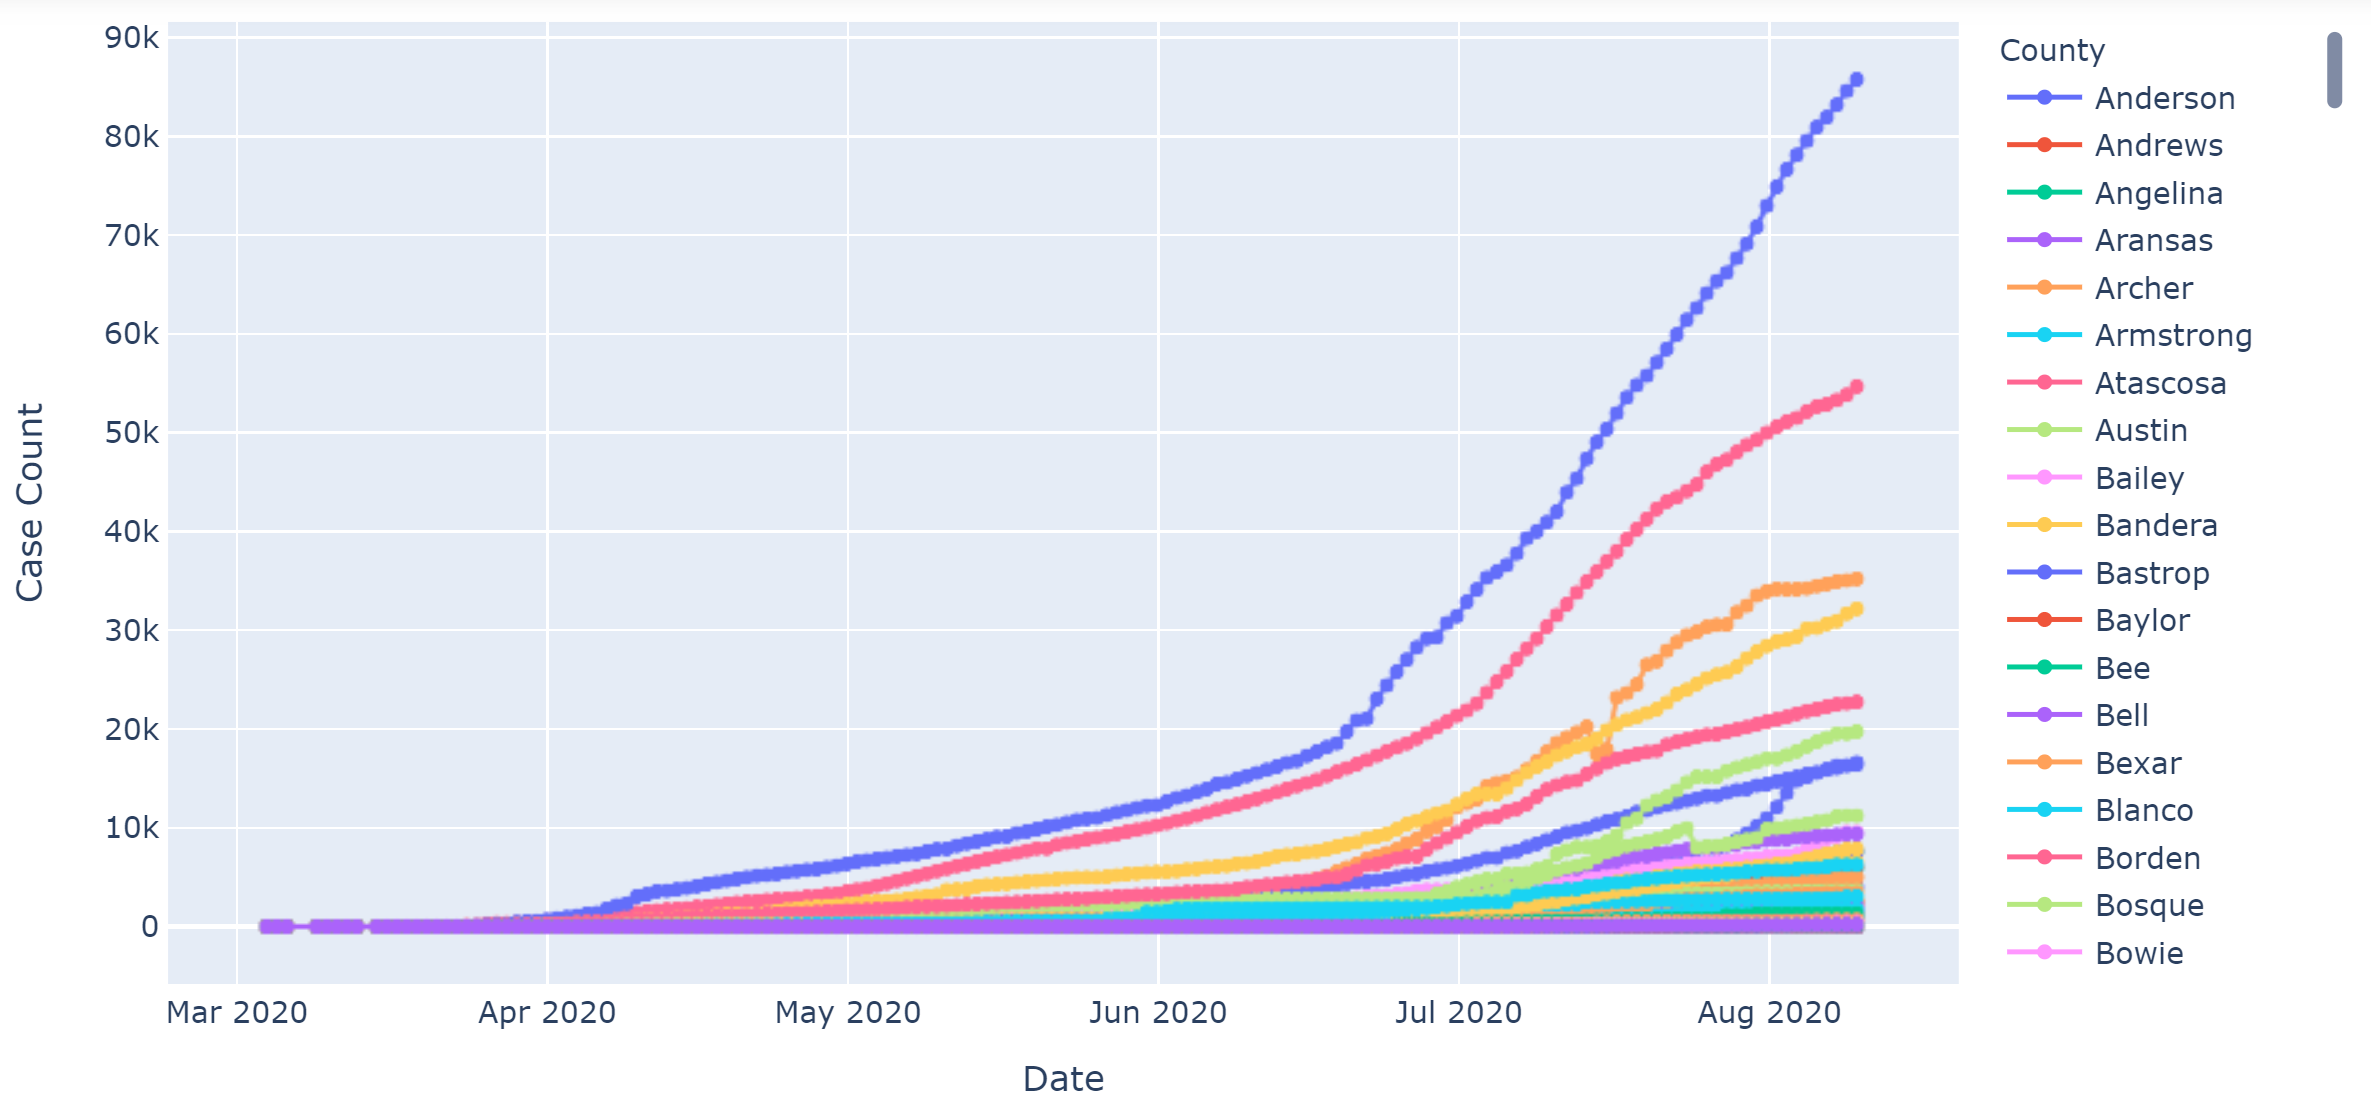
We can finally plot our data as a plotly scatter plot using just three simple lines of code! I used the markers+lines option which I think looks more pleasing and is easier to interact with than just the lines. I have fallen in love with plotly because unlike seaborn or matplotlib, the graphs are interactive and soooooo simple to code. Plotly also has outstanding documentation which can be found here.
最后,我们只需使用三行简单的代码就可以将数据绘制为散点图! 我使用了markers + lines选项,我认为它比线条更令人愉悦,并且更易于交互。 我爱上了plotly,因为与seaborn或matplotlib不同,这些图是交互式的,非常易于编码。 Plotly也有出色的文档,可以在这里找到。
Step 5: Creating a local web page for your dashboard using dash
步骤5:使用破折号为仪表板创建本地网页
This is the step that might get tricky for some people if they do not have any software development experience. I didn’t have any about a month ago so I will got through this step slowly and keep it as simple as possible. First we want to create a virtual environment in the directory we have our notebooks/data. To do this we must go to our command line or Anaconda prompt and cd to that directory. Something like this:
如果某些人没有任何软件开发经验,那么此步骤可能会很棘手。 大约一个月前我没有任何信息,所以我将逐步完成此步骤,并使其尽可能简单。 首先,我们要在我们的笔记本/数据目录中创建一个虚拟环境。 为此,我们必须转到命令行或Anaconda提示符,并cd到该目录。 像这样:
C:\Users\tsbloxsom>cd C:\Users\tsbloxsom\Documents\GitHub\Texas-census-county-data-project\Automate collecting of data notebooksThen we create the virtual environment:
然后我们创建虚拟环境:
python3 -m venv venvThen we activate the virtual environment:
然后,我们激活虚拟环境:
venv\Scripts\activateLets get to the dash program now. Here is a link for anyone new to dash. Dash is made by the people from plotly so you get great documentation and great products. I learned how to make this app for the time series dashboard in under 2 hours, not trying to brag, its just that simple. Below is the code for the app. I used a combination of dash’s basic app templates found in this tutorial on their website. So open up your favorite code editor like Spyder and save the below code as app.py in the same directory as your new venv folder and .csv file(s).
现在让我们进入破折号程序。 这是任何新手的链接 。 Dash是由人们精心策划的,因此您可以获得出色的文档和出色的产品。 我学会了如何在2小时内使该应用程序用于时间序列仪表板,而不是吹牛,它就这么简单。 以下是该应用程序的代码。 我在其网站上使用了本指南中的dash的基本应用程序模板的组合。 因此,打开您喜欢的代码编辑器(如Spyder),并将以下代码另存为app.py,与新的venv文件夹和.csv文件位于同一目录中。
import dash
import dash_core_components as dcc
import dash_html_components as html
import plotly.express as px
import pandas as pdexternal_stylesheets = ['https://codepen.io/chriddyp/pen/bWLwgP.css']app = dash.Dash(__name__, external_stylesheets=external_stylesheets)colors = {
    'background': '#F0F8FF',
    'text': '#00008B'
}# assume you have a "long-form" data frame
# see https://plotly.com/python/px-arguments/ for more options
df = pd.read_csv("time_series_plotly.csv")fig = px.scatter(df, x='Date', y='Case Count', color='County')fig.update_layout(
    plot_bgcolor=colors['background'],
    paper_bgcolor=colors['background'],
    font_color=colors['text']
)markdown_text = '''
### Texas COVID-19 DashboardCreator: Truett Bloxsom, [LinkedIn](https://www.linkedin.com/in/truett-bloxsom/), [github](https://github.com/tsbloxsom)This is my first interactive dashboard using Dash! Hope you like it!This first plot is Texas COVID-19 accumulated cases by county over timeSource for data: [dshs.texas.gov](https://www.dshs.texas.gov/coronavirus/additionaldata/)'''app.layout = html.Div([
    dcc.Markdown(children=markdown_text,
        style={
            'backgroundColor': colors['background'],
            'textAlign': 'center',
            'color': colors['text']
        }),

    dcc.Graph(
        id='example-graph',
        figure=fig
    )
])if __name__ == '__main__':
    app.run_server(debug=True)
Now go back to the activated environment and download dash, plotly, and pandas:
现在回到激活的环境并下载破折号,密谋和熊猫:
pip install <package_name>Then you can run your app by running this command:
然后,您可以通过运行以下命令来运行您的应用程序:
python3 app.pyIt should look something like this:
它看起来应该像这样:
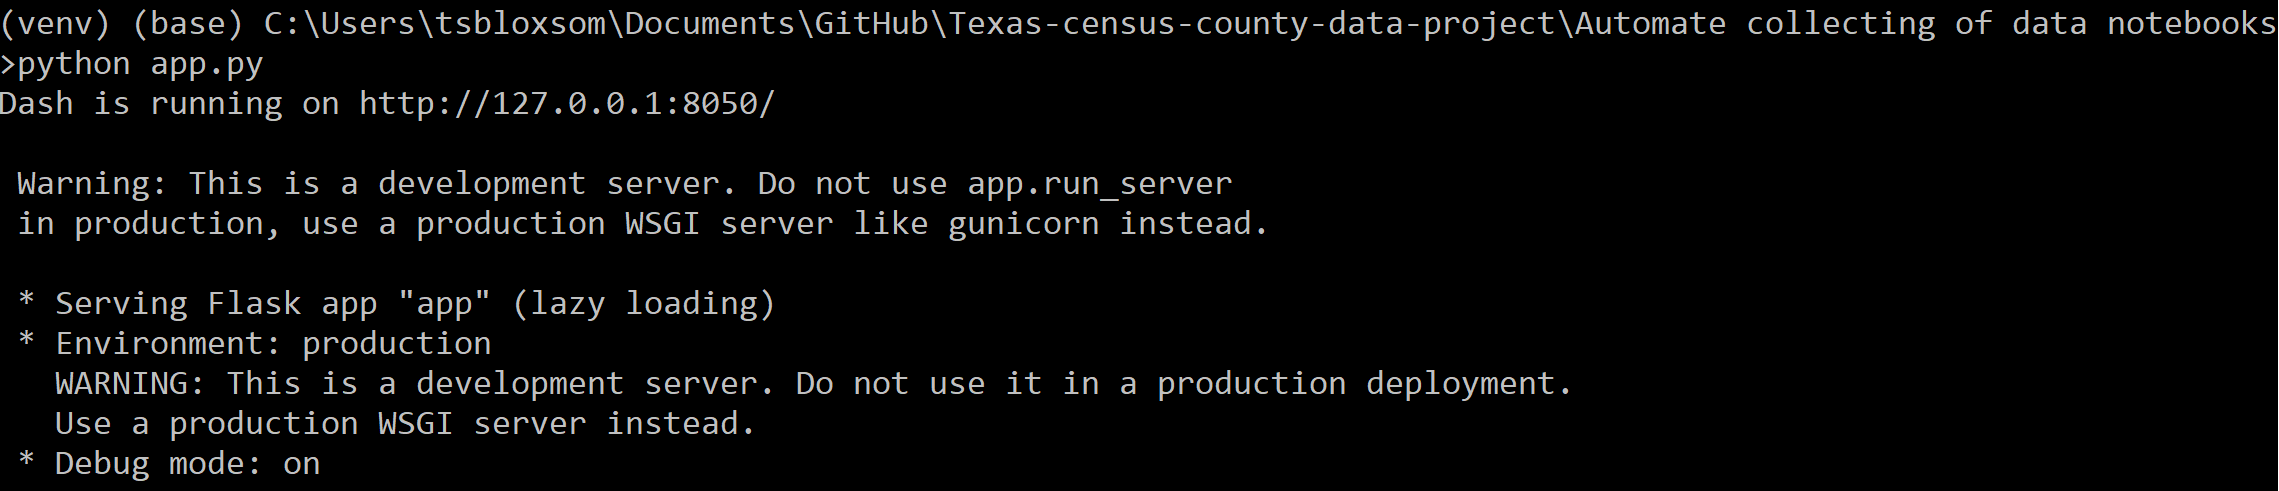
Now just copy the http link and paste it into chrome and boom! It should look like this:
现在,只需复制http链接并将其粘贴到chrome和boom中即可! 它看起来应该像这样:
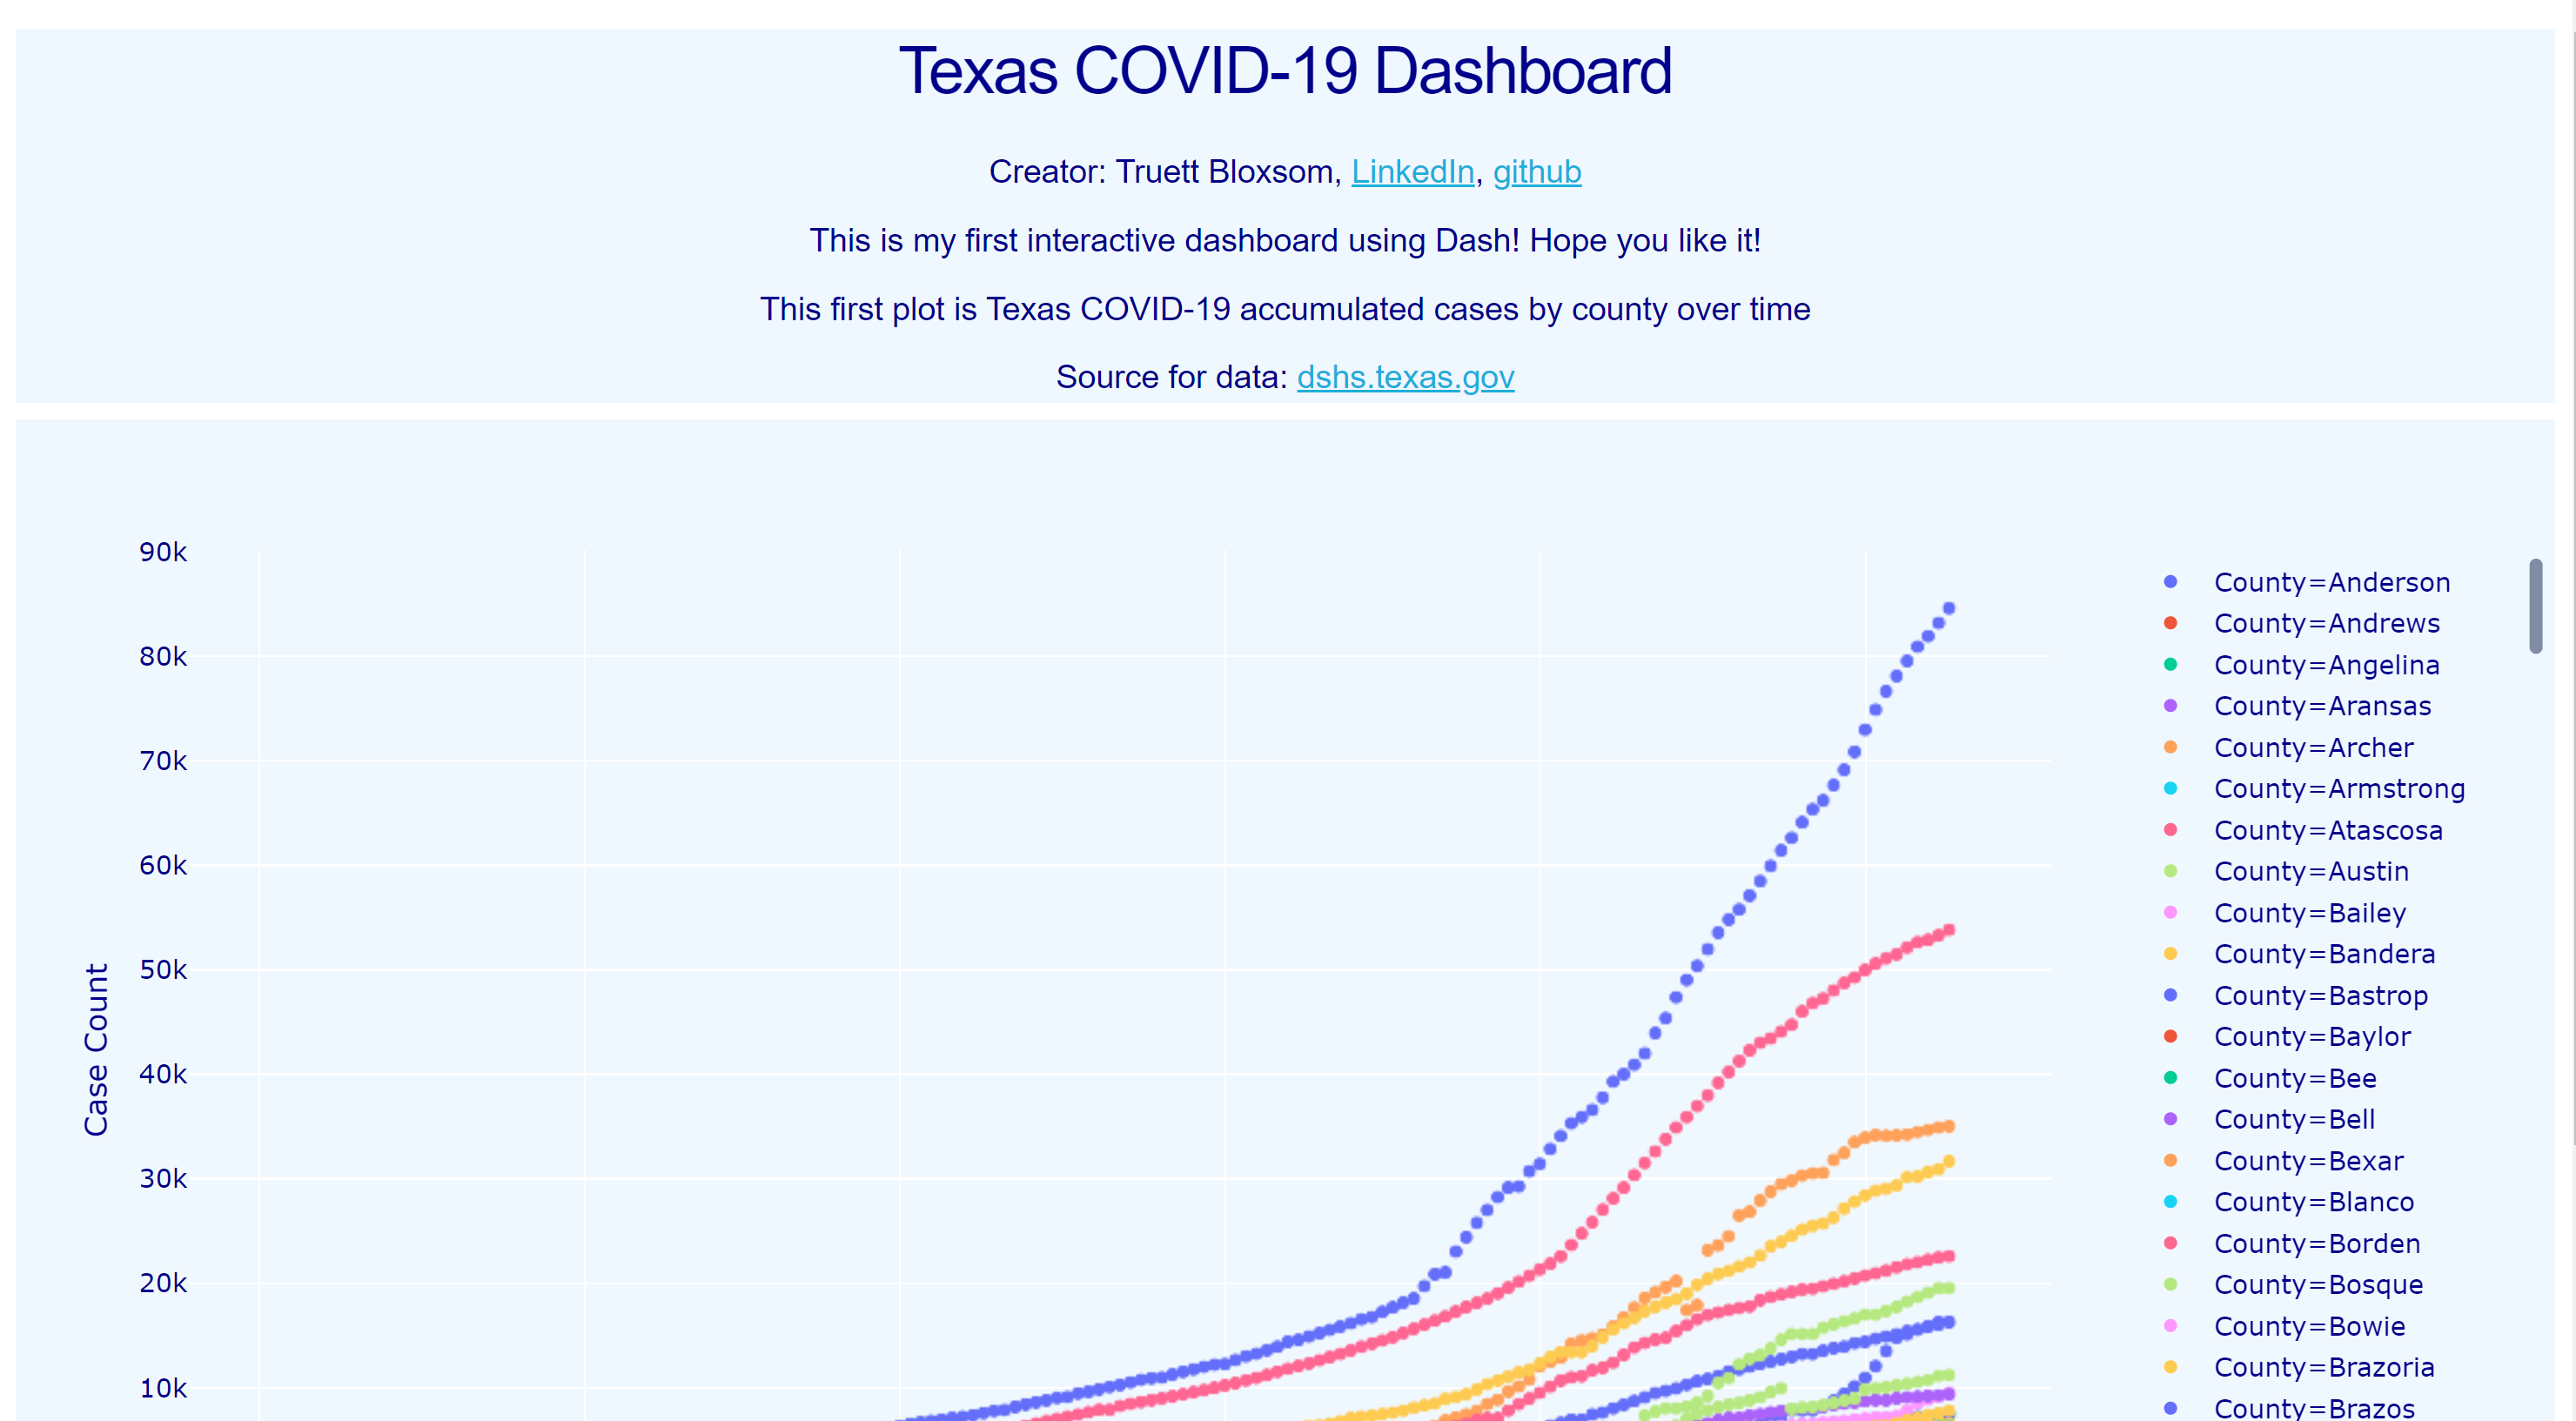
I went a step further and followed this tutorial by Elsa Scola on how to deploy your dash app for free. If you just want to play around with my interactive dashboard you can here!
我走得更远,并跟随Elsa Scola的本教程讲解如何免费部署仪表板应用程序。 如果您只想使用我的交互式仪表板,可以在这里 !
Thanks for following my tutorial and feel free to connect with me on linkedin. I am always trying to get feedback and strengthen my data science skills, so if there was anything I could improve coding wise or explain something in greater detail please let me know in the comments.
感谢您关注我的教程,并随时在linkedin上与我联系。 我一直在努力获得反馈,并加强我的数据科学技能,因此,如果有什么我可以提高编码水平或更详细地解释某些内容的话,请在评论中告诉我。
python交互式和文件式


 254
254


 被折叠的 条评论
为什么被折叠?
被折叠的 条评论
为什么被折叠?
 到【灌水乐园】发言


