


Summarizing key takeaways from my learnings of the famous Python scientific Library Numpy .
从我对著名的Python科学图书馆Numpy的学习中总结了重要的收获。
To run the codes as shown in this article, use this online Python compiler. This will help you understand and retain the concepts as you move along and also help you develop the habit of practicing coding .
要运行本文中显示的代码,请使用此在线 Python编译器 。 这将帮助您在继续学习的过程中理解和保留概念,并帮助您养成练习编码的习惯。
Many companies hiring for Python positions specifically require knowledge of Numpy library.
许多招聘Python职位的公司特别需要Numpy库的知识。
NumPy is a python library used for working with arrays. It also has functions for working in domain of linear algebra, Fourier transform, and matrices. NumPy was created in 2005 by Travis Oliphant. It is an open source project and you can use it freely. NumPy stands for Numerical Python.
NumPy是用于处理数组的python库。 它还具有在线性代数,傅立叶变换和矩阵的域中工作的功能。 NumPy由Travis Oliphant于2005年创建。 这是一个开源项目,您可以自由使用它。 NumPy代表数值Python。
In Python we have lists that serve the purpose of arrays, but they are slow to process. NumPy aims to provide an array object that is up to 50x faster that traditional Python lists.
在Python中,我们有满足数组目的的列表,但是处理起来很慢。 NumPy旨在提供一个比传统Python列表快50倍的数组对象。
The array object in NumPy is called ndarray, it provides a lot of supporting functions that make working with ndarray very easy. Arrays are very frequently used in data science, where speed and resources are very important.
NumPy中的数组对象称为ndarray ,它提供了许多支持功能,使使用ndarray非常容易。 阵列在数据科学中非常常用,因为速度和资源非常重要。
Learning outcomes:
学习成果:
Applying Numpy to calculate statistical concepts:
应用Numpy计算统计概念:
- Mean 意思
- Median 中位数
- Percentiles 百分位数
- Interquartile Range 四分位间距
- Outliers 离群值
- Standard Deviation 标准偏差
意思: (MEAN:)
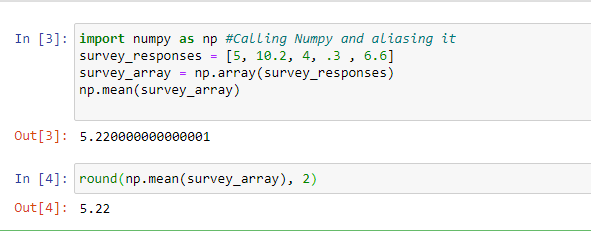
Before using Numpy on a dataset, we need to convert it into array. Array in Python is similar to list in Python. It is represented by square braces with values inside it separated by comma. In order to to perform array operations on a list, we need to first transform it into array.
在数据集中使用Numpy之前,我们需要将其转换为数组。 Python中的数组类似于Python中的列表。 用方括号表示,其中的值用逗号分隔。 为了对列表执行数组操作,我们需要首先将其转换为数组。
Example:
例:
survey_responses = [5, 10.2, 4, .3,6.6]
survey_responses = [5,10.2,4,.3,6.6]
We can then transform the dataset into a NumPy array using
然后我们可以使用以下方法将数据集转换为NumPy数组
survey_array = np.array(survey_responses)
survey_array = np.array(survey_responses)
Note: np is an alias for Numpy
注意:np是Numpy的别名
Calculating mean:
计算平均值:
survey_mean = np.mean(survey_array)
survey_mean = np.mean(survey_array)
Output:
输出:
0维数组 (0-D Arrays)
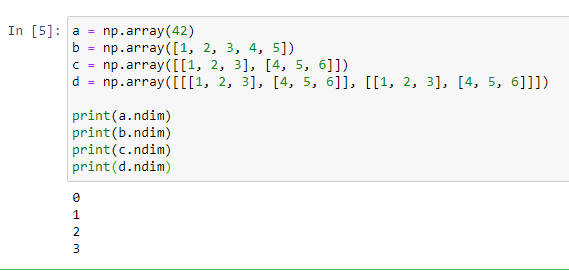
0-D arrays, or Scalars, are the elements in an array. Each value in an array is a 0-D array.
0-D数组或标量是数组中的元素 。 数组中的每个值都是一个0-D数组。
Eg: arr = np.array(42)
例如:arr = np.array(42)
一维阵列 (1-D Arrays)
An array that has 0-D arrays as its elements is called uni-dimensional or 1-D array. These are the most common and basic arrays.
以0-D数组为元素的数组称为一维或一维数组。 这些是最常见的基本数组。
Eg: arr = np.array([1, 2, 3, 4, 5])
例如:arr = np.array([1、2、3、4、5])
二维阵列 (2-D Arrays)
An array that has 1-D arrays as its elements is called a 2-D array. These are often used to represent matrix or 2nd order tensors.
以一维数组为元素的数组称为二维数组。 这些通常用于表示矩阵或二阶张量。
Eg: arr = np.array([[1, 2, 3], [4, 5, 6]])
例如:arr = np.array([[1、2、3],[4、5、6]])
3-D阵列 (3-D arrays)
An array that has 2-D arrays (matrices) as its elements is called 3-D array. These are often used to represent a 3rd order tensor.
以2维数组(矩阵)为元素的数组称为3维数组。 这些通常用于表示三阶张量。
Eg: arr = np.array([[[1, 2, 3], [4, 5, 6]], [[1, 2, 3], [4, 5, 6]]])
例如:arr = np.array([[[[1、2、3],[4、5、6]],[[1、2、3],[4、5、6]]])
nD阵列 (n-D arrays)
An array that has (n-1)-D arrays as its elements is called n-D array.
以(n-1)-D个数组为元素的数组称为nD数组。
检查数组的维数 (Check Number of Dimensions of an Array)
NumPy Arrays provides the ndim attribute that returns an integer that tells us how many dimensions the array have.
NumPy数组提供ndim属性,该属性返回一个整数,该整数告诉我们数组有多少维。
创建高维数组: (Creating Higher Dimensional Arrays:)
An array can have any number of dimensions.
数组可以具有任意数量的维。
When the array is created, you can define the number of dimensions by using the ndmin argument.
创建数组时,可以使用ndmin参数定义维数。
Eg: arr = np.array([1, 2, 3, 4], ndmin=5)
例如:arr = np.array([1,2,3,4],ndmin = 5)
note: For finding dimensions “ndim” is used while for creating dimensions “ndmin” is used. Both should not be confused to be same.
注意:查找尺寸时使用“ ndim”,而创建尺寸时使用“ ndmin”。 不应将两者混淆。
示例问题4部分: (Example problem 4 parts:)
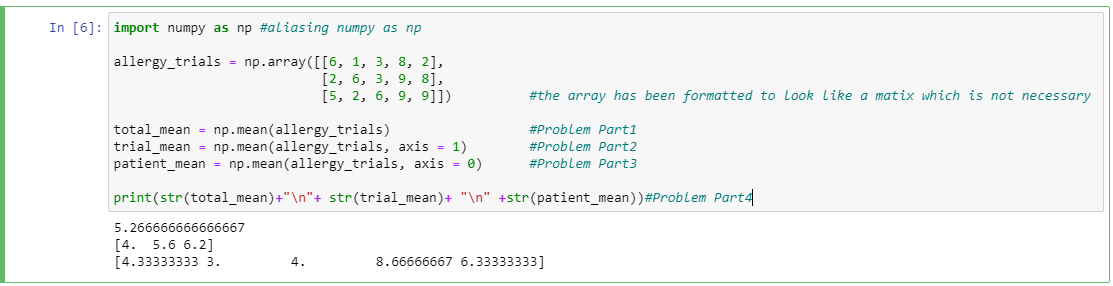
We’re provided with data about a trial for a new allergy medication, AllerGeeThatSucks! Five participants were asked to rate how drowsy the medication made them once a day for three days on a scale of one (least drowsy) to ten (most drowsy).Use
np.meanto find the average level of drowsiness across all the trials and save the result to the variabletotal_mean.我们获得了有关新过敏药物AllerGeeThatSucks的试验数据。 要求五名参与者以1次(最低困倦)至10次(最困倦)的
np.mean来np.mean每天三天一次药物使他们昏昏欲睡的程度。使用np.mean来查找所有试验中的平均困倦程度。将结果保存到变量total_mean。
allergy_trials = np.array([[6, 1, 3, 8, 2], [2, 6, 3, 9, 8], [5, 2, 6, 9, 9]])
allergy_trials = np.array([[6,1,3,8,2],[2,6,3,9,8],[5,2,6,9,9]])
2. Use np.mean to find the average level of drowsiness across each day of the experiment and save to the variable trial_mean.
2.使用np.mean查找实验每一天的平均睡意程度,并将其保存到变量trial_mean.
3. Use np.mean to find the average level of drowsiness across for each individual patient to see if some were more sensitive to the drug than others and save it to the variable patient_mean.
3.使用np.mean查找每个患者的平均睡意程度,以查看是否有人比其他人对药物更敏感,并将其保存到变量patient_mean.
4. Print the variables for total_mean, trial_mean, and patient_mean on three separate lines.
4.在三行中分别打印total_mean , trial_mean和patient_mean的变量。
Output:
输出:
Question
题
What is an axis in Numpy?
Numpy中的轴是什么?
Answer
回答
An axis is similar to a dimension. For a 2-dimensional array, there are 2 axes: vertical and horizontal.
轴类似于尺寸。 对于二维数组,有2个轴:垂直轴和水平轴。
When applying certain Numpy functions like np.mean(), we can specify what axis we want to calculate the values across.
当应用某些np.mean()函数(如np.mean() ,我们可以指定要计算值的轴。
For axis=0, this means that we apply a function along each “column”, or all values that occur vertically.
对于axis=0 ,这意味着我们沿每个“列”或垂直出现的所有值应用函数。
For axis=1, this means that we apply a function along each “row”, or all values horizontally.
对于axis=1 ,这意味着我们沿每个“行”或水平的所有值应用函数。
外景 (OUTLIERS)
As we can see, the mean is a helpful way to quickly understand different parts of our data. However, the mean is highly influenced by the specific values in our data set. What happens when one of those values is significantly different from the rest?
如我们所见,均值是快速理解数据不同部分的有用方法。 但是,平均值受到数据集中特定值的高度影响。 当这些值之一与其他值显着不同时,会发生什么?
Values that don’t fit within the majority of a dataset are known as outliers. It’s important to identify outliers because if they go unnoticed, they can skew our data and lead to error in our analysis (like determining the mean). They can also be useful in pointing out errors in our data collection.
数据集的大部分都不适合的值称为离群值。 识别离群值非常重要,因为如果不注意离群值,它们可能会扭曲我们的数据并导致我们分析中的错误(例如确定均值)。 它们还可用于指出我们数据收集中的错误。
When we’re able to identify outliers, we can then determine if they were due to an error in sample collection or whether or not they represent a significant but real deviation from the mean.
当我们能够识别异常值时,我们便可以确定它们是否是由于样本采集错误所致,或者它们是否代表均值的显着但真实的偏差。
排序和离群值 (Sorting and Outliers)
One way to quickly identify outliers is by sorting our data, Once our data is sorted, we can quickly glance at the beginning or end of an array to see if some values lie far beyond the expected range. We can use the NumPy function np.sort to sort our data.
快速识别离群值的一种方法是对数据进行排序。对数据进行排序后,我们可以快速浏览数组的开头或结尾,以查看某些值是否超出预期范围。 我们可以使用NumPy函数np.sort对数据进行排序。
Let’s take 3rd grade student’s height example, and imagine an 8th grader walked into our experiement:
让我们以三年级学生的身高为例,并想象一个八年级学生走进我们的实验:
>>> heights = np.array([49.7, 46.9, 62, 47.2, 47, 48.3, 48.7])
>>> heights = np.array([49.7, 46.9, 62, 47.2, 47, 48.3, 48.7])If we use
np.sort, we can immediately identify the taller student since their height (62”) is noticeably outside the range of the dataset:如果我们使用
np.sort,我们可以立即识别出较高的学生,因为他们的身高(62“)明显超出了数据集范围:
>>> np.sort(heights)array([ 46.9, 47. , 47.2, 48.3, 48.7, 49.7, 62])
>>> np.sort(heights)array([ 46.9, 47. , 47.2, 48.3, 48.7, 49.7, 62])
Reverse sorting: for any given array we can reverse the order of elements by np.sort(array_name[::-1])
反向排序:对于任何给定的数组,我们可以通过np.sort(array_name [::-1])反转元素的顺序
中位数 (MEDIAN)
Another key metric that we can use in data analysis is the median. The median is the middle value of a dataset that’s been ordered in terms of magnitude (from lowest to highest).
我们可以在数据分析中使用的另一个关键指标是中位数 。 中位数是按幅度(从最低到最高)排序的数据集的中间值。
Let’s look at the following array:
让我们看一下以下数组:
np.array( [1, 1, 2, 3, 4, 5, 5])In this example, the median would be 3, because it is positioned half-way between the minimum value and the maximum value.
在此示例中,中位数为3 ,因为它位于最小值和最大值之间的一半。
If the length of our dataset was an even number, the median would be the value halfway between the two central values. So in the following example, the median would be 3.5:
如果我们的数据集的长度是偶数,则中位数将是两个中心值之间的中间值。 因此,在以下示例中,中位数为3.5 :
np.array( [1, 1, 2, 3, 4, 5, 5, 6])But what if we had a very large dataset? It would get very tedious to count all of the values. Luckily, NumPy also has a function to calculate the median, np.median:
但是,如果我们有一个非常大的数据集怎么办? 计算所有值将非常繁琐。 幸运的是,NumPy还具有计算中位数np.median :
>>> my_array = np.array([50, 38, 291, 59, 14])
>>> np.median(my_array)
50.0
Mean vs. Median
均值与中位数
In a dataset, the median value can provide an important comparison to the mean. Unlike a mean, the median is not affected by outliers. This becomes important in skewed datasets, datasets whose values are not distributed evenly.
在数据集中,中值可以提供与平均值的重要比较。 与平均值不同,中位数不受异常值的影响。 这在偏斜的数据集(其值不是均匀分布的数据集)中变得很重要。
百分位数 (PERCENTILES)
As we know, the median is the middle of a dataset: it is the number for which 50% of the samples are below, and 50% of the samples are above. But what if we wanted to find a point at which 40% of the samples are below, and 60% of the samples are above?
众所周知,中位数是数据集的中间部分:是50%以下的样本和50%以上的样本的数量。 但是,如果我们想找到40%的样本低于下方,而60%的样本高于上方的点呢?
This type of point is called a percentile. The Nth percentile is defined as the point N% of samples lie below it. So the point where 40% of samples are below is called the 40th percentile. Percentiles are useful measurements because they can tell us where a particular value is situated within the greater dataset.
这种类型的点称为百分位 。 第N个百分位数定义为样本N%位于其下方的点。 因此,低于40%的样本的点称为第40个百分点。 百分数是有用的度量,因为它们可以告诉我们特定值在较大数据集中的哪个位置。
Let’s look at the following array:
让我们看一下以下数组:
d = [1, 2, 3, 4, 4, 4, 6, 6, 7, 8, 8]There are 11 numbers in the dataset. The 40th percentile will have 40% of the 10 remaining numbers below it (40% of 10 is 4) and 60% of the numbers above it (60% of 10 is 6). So in this example, the 40th percentile is 4.
数据集中有11个数字。 第40个百分位数将在其下面的10个剩余数字中占40%(10的40%为4),在其上方的数字中有60%(10的60%为6)。 因此,在此示例中,第40个百分位数是4。
In NumPy, we can calculate percentiles using the function np.percentile, which takes two arguments: the array and the percentile to calculate.
在NumPy中,我们可以使用函数np.percentile来计算百分位数,该函数需要两个参数: 数组和要计算的百分位数 。
Here’s how we would use NumPy to calculate the 40th percentile of array d:
这是我们将如何使用NumPy计算数组d的第40个百分位数:
>>> d = np.array([1, 2, 3, 4, 4, 4, 6, 6, 7,  8, 8])
>>> np.percentile(d, 40)
4.00
Some percentiles have specific names:
一些百分位数有特定的名称:
The 25th percentile is called the first quartile
第25个百分位数称为第一个四分位数
The 50th percentile is called the median
第50个百分位数称为中位数
The 75th percentile is called the third quartile
第75个百分位数称为第三四分位数
The minimum, first quartile, median, third quartile, and maximum of a dataset are called a five-number summary. This set of numbers is a great thing to compute when we get a new dataset.
数据集的最小,第一四分位数,中位数,第三四分位数和最大值称为五数汇总 。 当我们获得一个新的数据集时,这组数字是一件很棒的事情。
The difference between the first and third quartile is a value called the interquartile range. For example, say we have the following array:
第一四分位数与第三四分位数之间的差是称为四分位数间距的值 。 例如,假设我们有以下数组:
d = [1, 2, 3, 4, 4, 4, 6, 6, 7, 8, 8]We can calculate the 25th and 75th percentiles using np.percentile:
我们可以使用np.percentile计算第25和第75个百分位数:
np.percentile(d, 25)
>>> 3.5
np.percentile(d, 75)
>>> 6.5
Then to find the interquartile range, we subtract the value of the 25th percentile from the value of the 75th:
然后,要找到四分位数范围,请从第75个百分位数的值中减去第25个百分位数的值:
6.5 - 3.5 = 350% of the dataset will lie within the interquartile range. The interquartile range gives us an idea of how spread out our data is. The smaller the interquartile range value, the less variance in our dataset. The greater the value, the larger the variance.
数据集的50%将位于四分位间距范围内。 四分位数范围使我们对数据的分布范围有了一个了解。 四分位间距值越小,数据集中的方差越小。 值越大,方差越大。
标准偏差 (STANDARD DEVIATION)
When the standard deviation is small, the values will be less spread out and be closer to the mean. This will cause the overall shape of this dataset to appear less chaotic and more leveled.
当标准偏差较小时,这些值将散布较少并且更接近平均值。 这将导致此数据集的整体形状看起来更混乱,更平整。
When the standard deviation is large, the values will be more spread out from the mean. The shape of the dataset will appear to be more uneven and chaotic as the standard deviation increases.
当标准偏差较大时,这些值将从平均值中更分散。 随着标准偏差的增加,数据集的形状将显得更加不均匀和混乱。
We can find the standard deviation of a dataset using the Numpy function np.std:
我们可以使用Numpy函数np.std找到数据集的标准差:
>>> nums = np.array([65, 36, 52, 91, 63, 79])
>>> np.std(nums)
17.716909687891082
翻译自: https://medium.com/@mdkhalid.siddiquee/numpy-uncovered-a-beginners-guide-9c5fed6efc7


 621
621

 被折叠的 条评论
为什么被折叠?
被折叠的 条评论
为什么被折叠?
 到【灌水乐园】发言


