


javascript初学者
Using Charts
使用图表
Using charts and data visualization tools within your apps can be a very daunting experience when it’s your first time. There are so many tools available such as GraphQL, Chart.JS, etc. One option I found very easy to use was AnyChart. AnyChart is a charting library designed for JavaScript that has documentation dated back to 2003. When using this tool, the main things you, the developer, must handle is the data you want imported and the styling. For the sake of this walkthrough, the focus will remain on the data.
首次使用时,在应用程序中使用图表和数据可视化工具可能会非常令人生畏。 有很多可用的工具,例如GraphQL,Chart.JS等。我发现非常易于使用的一个选项是AnyChart 。 AnyChart是一个为JavaScript设计的图表库,其文档可以追溯到2003年。使用此工具时,开发人员必须处理的主要事情是要导入的数据和样式。 为了进行本演练,重点将放在数据上。
Choosing Your Chart
选择图表
AnyChart has many data visualization choices from pie & donut charts to graphs. For this walkthrough, we will be using the Donut Chart template found here.
从饼图和甜甜圈图到图形,AnyChart都有许多数据可视化选择。 在本演练中,我们将使用在此处找到的“甜甜圈图”模板。
Adding the Source Code
添加源代码
After accessing the donut chart link, select “Source Code” and add the items within the <head> tag into the head of your html and complete like steps for the <body> tag. Then, different from what is illustrated within the source code, add everything within the <script> tag into your javascript file within a function of your choosing, preferably in a function that will only handle the adding of this chart. Now, this code looks very daunting at first, but keep in mind that the only thing required to be changed is the first 10 lines of the <script> tag, specifically the data variable:
访问甜甜圈图链接后,选择“源代码”,然后将<head>标记内的项目添加到html的头部,并完成<body>标记的类似步骤。 然后,与源代码中所示的不同,将<script>标记内的所有内容添加到您选择的函数中的javascript文件中,最好是在仅处理此图表添加的函数中。 现在,此代码起初看起来非常艰巨,但是请记住,唯一需要更改的是<script>标记的前10行,特别是data变量:
Data
数据
The data variable appears differently depending on which chart you choose. However, with these steps, you should be able to switch from one chart type to another seamlessly. First, it is important that you define an array of what will serve as your data at the top of your javascript file, rather than within the function you created for the chart. Defining these variables globally will ensure that you can access the variable within different functions and change/alter data when need be. At the top of your page, you should have:
数据变量根据您选择的图表而有所不同。 但是,通过这些步骤,您应该能够从一种图表类型无缝切换到另一种图表类型。 首先,重要的是在javascript文件顶部(而不是在为图表创建的函数中)定义一个将用作数据的数组。 全局定义这些变量将确保您可以访问不同功能中的变量,并在需要时更改/更改数据。 在页面顶部,您应该具有:
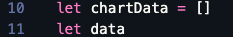
Please note that the chartData variable can be named anything as it will be passed into the data variable shown in the first image. Whatever it is named, it is advised to select a name that well identifies what the array contains or what it is for.
请注意, chartData变量可以命名为任何名称,因为它将传递到第一张图片中所示的数据变量中。 无论使用什么名称,建议选择一个名称,该名称可以很好地标识阵列包含的内容或用途。
Iteration
迭代
In the case that your web application utilizes API’s that contains the data you want represented in the chart, hard coding these items as your data is not best practice. Instead, it is recommended that you iterate through your array of hashes all the while building your chartData variable. For the sake of this walkthrough, let’s assume that you have built an API containing users with each user having a set of expenses which has an “item” key and an “amount” key. You have also completed a Fetch GET request at the beginning of your page to access this resource.
如果您的Web应用程序利用包含要在图表中表示的数据的API,则对这些项目进行硬编码,因为这不是最佳实践。 相反,建议您在构建chartData变量时始终遍历哈希数组。 为了进行本演练,我们假设您构建了一个包含用户的API,每个用户都有一组费用,这些费用具有“项目”键和“金额”键。 您还已经在页面开头完成了“获取GET”请求以访问该资源。
Go into the function defined for building this chart. My function, as shown below, is named addChart and passes in user(following the convention of the Fetch GET request). If you have not already done so, within this function, paste in all the code which is contained in the <script> tag mentioned above (about 70 total lines of code). Now, the first lines of code within your function, above the provided <script> code, should be an iteration through the users object.
进入为构建此图表而定义的功能。 我的函数(如下所示)名为addChart,并传递给用户(遵循Fetch GET请求的约定) 。 如果尚未执行此操作,请在此函数中粘贴上述<script>标记中包含的所有代码(总共70行代码)。 现在,函数中位于提供的<script>代码上方的第一行代码应该是通过users对象的迭代。
Within this iteration, the expense items and amounts are pushed into chartData, which, if you recall, was initialized as an empty array. Keep in mind that the format within the push method is chosen based on the initial snapshot of what data should look like as provided within the source code.
在此迭代中,费用项目和金额被推入chartData中,如果您还记得的话,它会被初始化为一个空数组。 请记住, push方法中的格式是根据源代码中提供的数据外观的初始快照选择的。
Passing in the Data
传递数据
Finally, the chartData variable must be passed within the data variable as shown on line 97.
最后,必须将chartData变量传递到data变量内,如第97行所示。
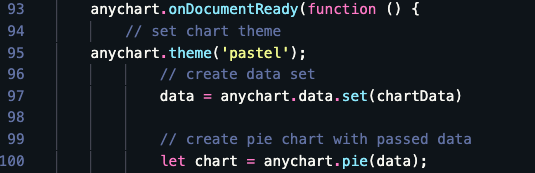
If we look at line 97, knowing what chartData is, this is the exact same as the original source code. There are about 70 additional lines of code for the building of this donut chart, however, adding in the data relevant to your project is all that is necessary to make the chart appear on your page.
如果我们看第97行,知道什么是chartData ,那么这与原始源代码完全相同。 构建该甜甜圈图大约有70条额外的代码行,但是,要使该图显示在页面上,只需添加与项目相关的数据即可。
Final Considerations
最后考虑
It is recommended that all variables provided by AnyChart be initialized through the const or let keywords, rather than the var keyword used within the source code.
建议通过const或let关键字而不是源代码中使用的var关键字初始化AnyChart提供的所有变量。
Play around and see what charts you make part of your next project!
试一试,看看哪些图表成为您下一个项目的一部分!
翻译自: https://medium.com/swlh/javascript-charts-for-beginners-iterating-through-data-6118b6492a2a
javascript初学者


 255
255

 被折叠的 条评论
为什么被折叠?
被折叠的 条评论
为什么被折叠?
 到【灌水乐园】发言


