


stetho 调试数据库
As Android developers, our development life often involves integrating API or web services while building dynamic apps. Previously, it’s been a little bit troublesome to find the responses and missing fields in the API response because we used to keep logs to check the output or debug the app using the debugger available in Studio.
作为Android开发人员,我们的开发生活通常涉及集成API 或网络服务,同时构建动态应用。 以前,在API响应中查找响应和缺少字段会有些麻烦,因为我们以前会保留日志 使用Studio中可用的调试器检查输出或调试应用。
After spending a good amount of time, we realized that there were some unexpected types of data that were coming from the back end. So this process needs a little bit of time and patience to explore things because if you connect multiple devices, you always need to switch between them to check the output.
在花费了大量时间后,我们意识到后端有一些意外的数据类型。 因此,此过程需要一点时间和耐心来探索事物,因为如果您连接多个设备,则始终需要在它们之间切换以检查输出。
But then I found Stetho, which made the work easier and saved time. Though it’s been a long time, there are many developers out there who still do logging or debugging for network call inspections. I’m writing this for those who need some guidance to make their work simpler.
但是后来我找到了Stetho , 这使工作更加轻松并节省了时间。 尽管已经很长时间了,但仍有许多开发人员仍在进行日志或调试以进行网络呼叫检查。 我是为那些需要一些指导以简化工作的人编写的。
问题 (Problem)
You need patience and time to explore how many times a network request is getting fired. While dealing with multiple devices, you need to switch between devices to see logs or attach debuggers, which makes inspecting network requests a bit problematic.
您需要耐心和时间来探索触发网络请求的次数。 在处理多个设备时,您需要在设备之间切换以查看日志或附加调试器,这使得检查网络请求有点麻烦。
解 (Solution)
We need a library or tool that automates the network call inspection easily with few lines of code. We need to be able to inspect network calls parallelly to a certain number of devices at a point to check if events are firing correctly or not. So this is where Stetho comes into play.
我们需要一个库或工具来使用几行代码轻松地自动执行网络呼叫检查。 我们需要能够同时检查与一定数量设备并行的网络调用,以检查事件是否正确触发。 这就是Stetho发挥作用的地方。
什么是Stetho? (What Is Stetho?)
Stetho is a simple library from Facebook with which we can easily debug network calls. No need to add logs during development and remove them while releasing. No need to use a debugger. Just by following three steps, we can get all network calls inside the Chrome desktop browser. We can see all network requests getting fired from the application, such as latency, size shot, fire sequence, request params, response data, etc. Stetho has many features apart from network inspection, but this article will briefly discuss network request inspection. So let’s get started.
Stetho是Facebook的一个简单库,通过它我们可以轻松调试网络调用。 无需在开发过程中添加日志,而在发布时将其删除。 无需使用调试器。 只需执行以下三个步骤,我们就可以在Chrome桌面浏览器中获取所有网络通话。 我们可以看到所有网络请求都从应用程序中触发,例如等待时间,大小射击,触发序列,请求参数,响应数据等。Stetho除了网络检查外还具有许多功能,但是本文将简要讨论网络请求检查。 因此,让我们开始吧。
步骤1:在build.gradle中添加依赖项 (Step 1: Add dependency in build.gradle)
implementation 'com.facebook.stetho:stetho:1.5.1'Only the main stetho dependency is strictly required. However, we can also use one of the network helpers:
仅严格要求主stetho依赖。 但是,我们也可以使用以下网络助手之一:
implementation 'com.facebook.stetho:stetho-okhttp3:1.5.1' ORimplementation 'com.facebook.stetho:stetho-urlconnection:1.5.1'You can also enable a JavaScript console:
您还可以启用JavaScript控制台:
implementation 'com.facebook.stetho:stetho-js-rhino:1.5.1'步骤2:我用一行代码在应用程序类中将其取消 (Step 2: Initialize it in the application class with one line of code)
public class MyApplication extends Application {
  public void onCreate() {
    super.onCreate();
     if(BuildConfig.DEBUG) {
      Stetho.initializeWithDefaults(this)
     }
  }
}
Don’t forget to register your class in the AndroidManifest.xml:
不要忘记在AndroidManifest.xml注册您的类:
<manifest
        xmlns:android="http://schemas.android.com/apk/res/android"
        ...>
        <application
                android:name="MyApplication"
                ...>
         </application>
</manifest>步骤3:启用网络检查 (Step 3: Enable network inspection)
If you are using the popular OkHttp library at the 3.x release, you can use the interceptors system to automatically hook into your existing stack. This is currently the simplest and most straightforward way to enable network inspection:
如果您正在3.x发行版中使用流行的OkHttp库 ,则可以使用拦截器系统自动挂钩到现有堆栈中。 这是当前启用网络检查的最简单,最直接的方法:
 OkHttpClient.Builder()
    .addNetworkInterceptor(StethoInterceptor())
    .build()
Interceptors are a powerful mechanism that can monitor, rewrite, and retry calls. Check out more about interceptors.
拦截器是一种强大的机制,可以监视,重写和重试呼叫。 进一步了解拦截器 。
That's it! We are ready to inspect every network call that’s getting fired from the app. Easy, right?
而已! 我们准备检查从该应用触发的每个网络调用。 容易吧?
The next question would be where to check the output.
下一个问题是在哪里检查输出。
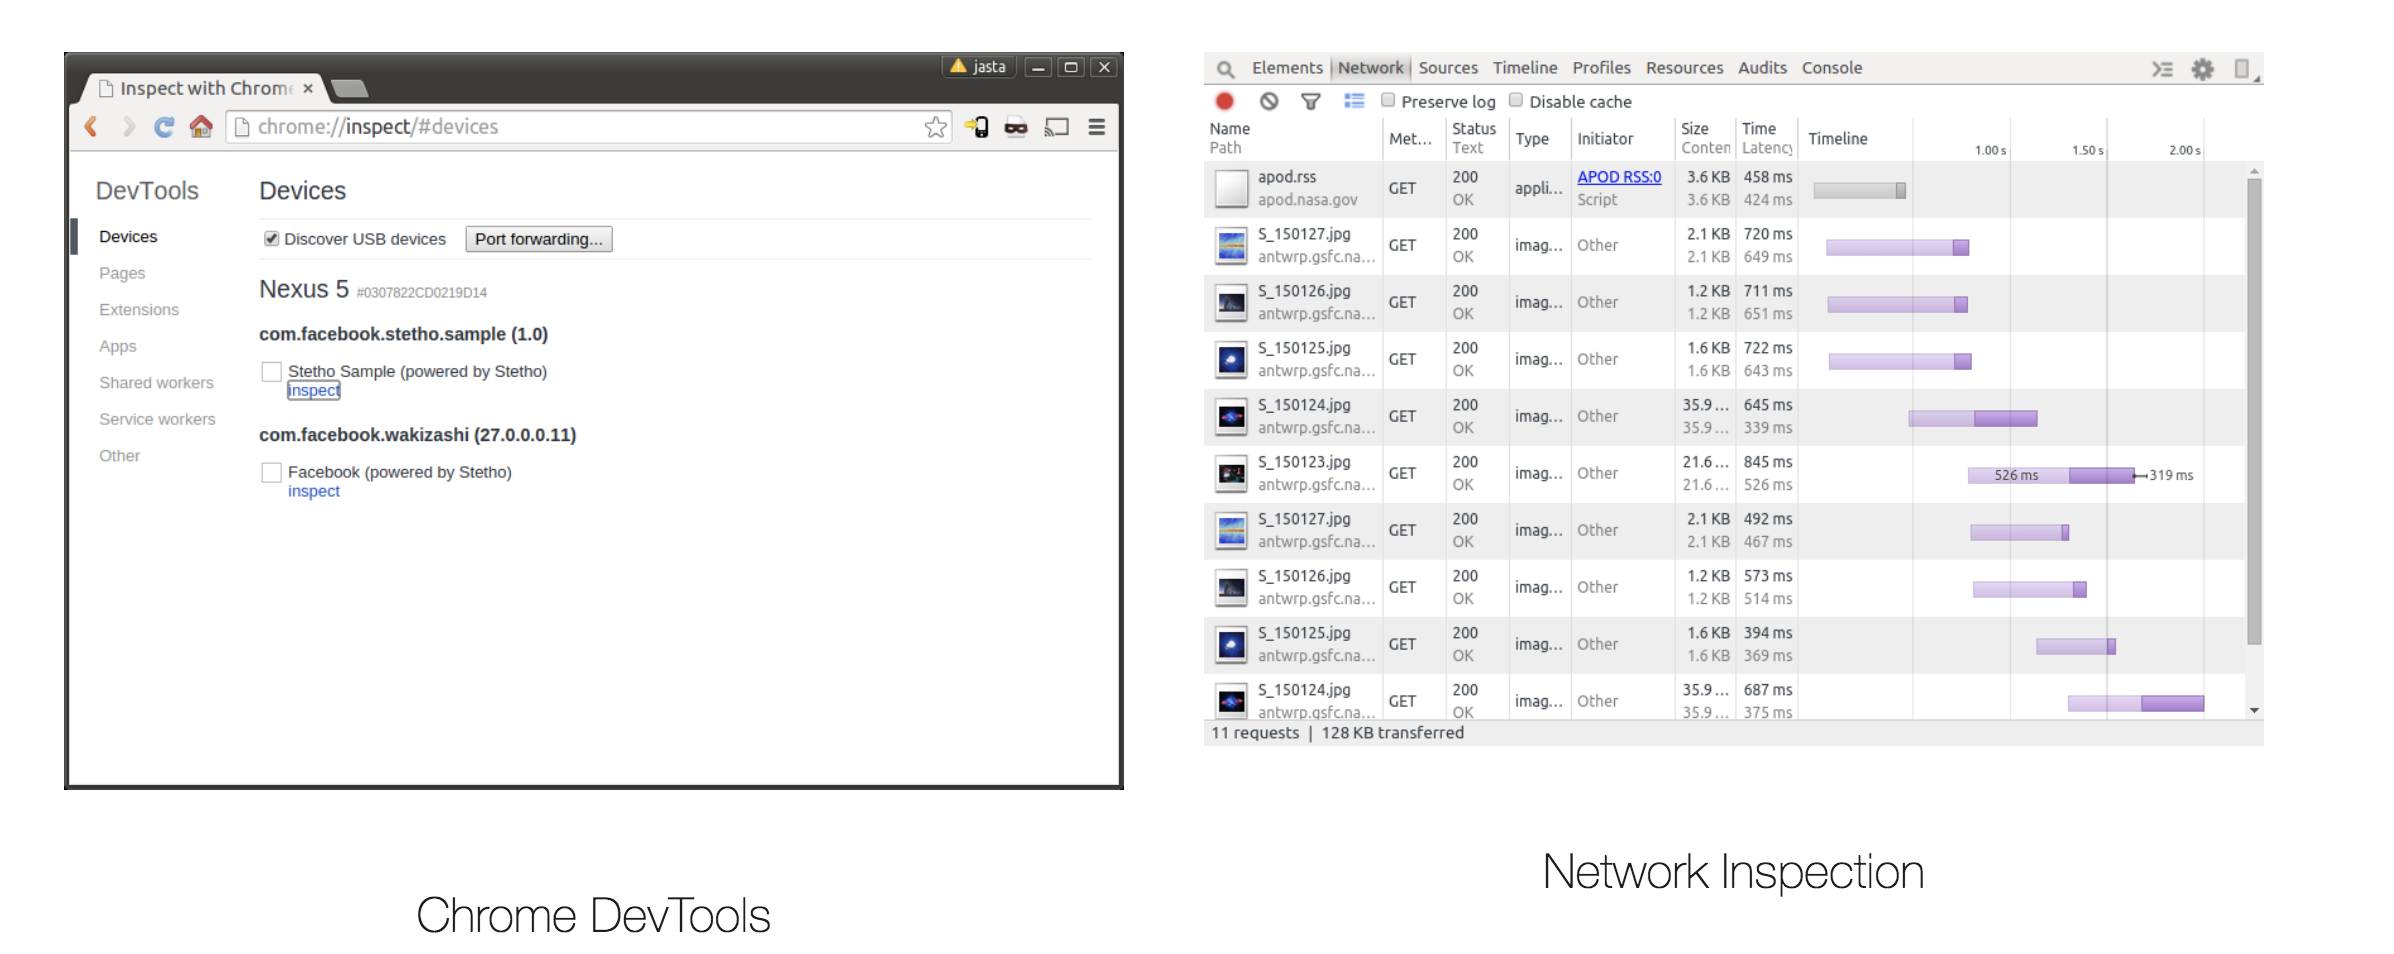
如何使用Chrome DevTools进行检查 (How to Work With Chrome DevTools to Inspect)
The integration with the Chrome DevTools front end is implemented using a client/server protocol that the Stetho software provides for your application. Now that the basic setup is done, we need to open Chrome and connect the device to check the request fires.
与Chrome DevTools前端的集成是使用Stetho软件为您的应用程序提供的客户端/服务器协议实现的。 现在基本的设置已经完成,我们需要打开Chrome并连接设备以检查请求是否触发。
Open your Chrome browser and enter chrome://inspect in the URL bar. Then hit enter and you will be able to see your devices connected as shown in the image below. Click inspect to see the magic!
打开您的Chrome浏览器,然后在网址栏中输入chrome://inspect 。 然后按Enter键,您将能够看到连接的设备,如下图所示。 单击检查看魔术!
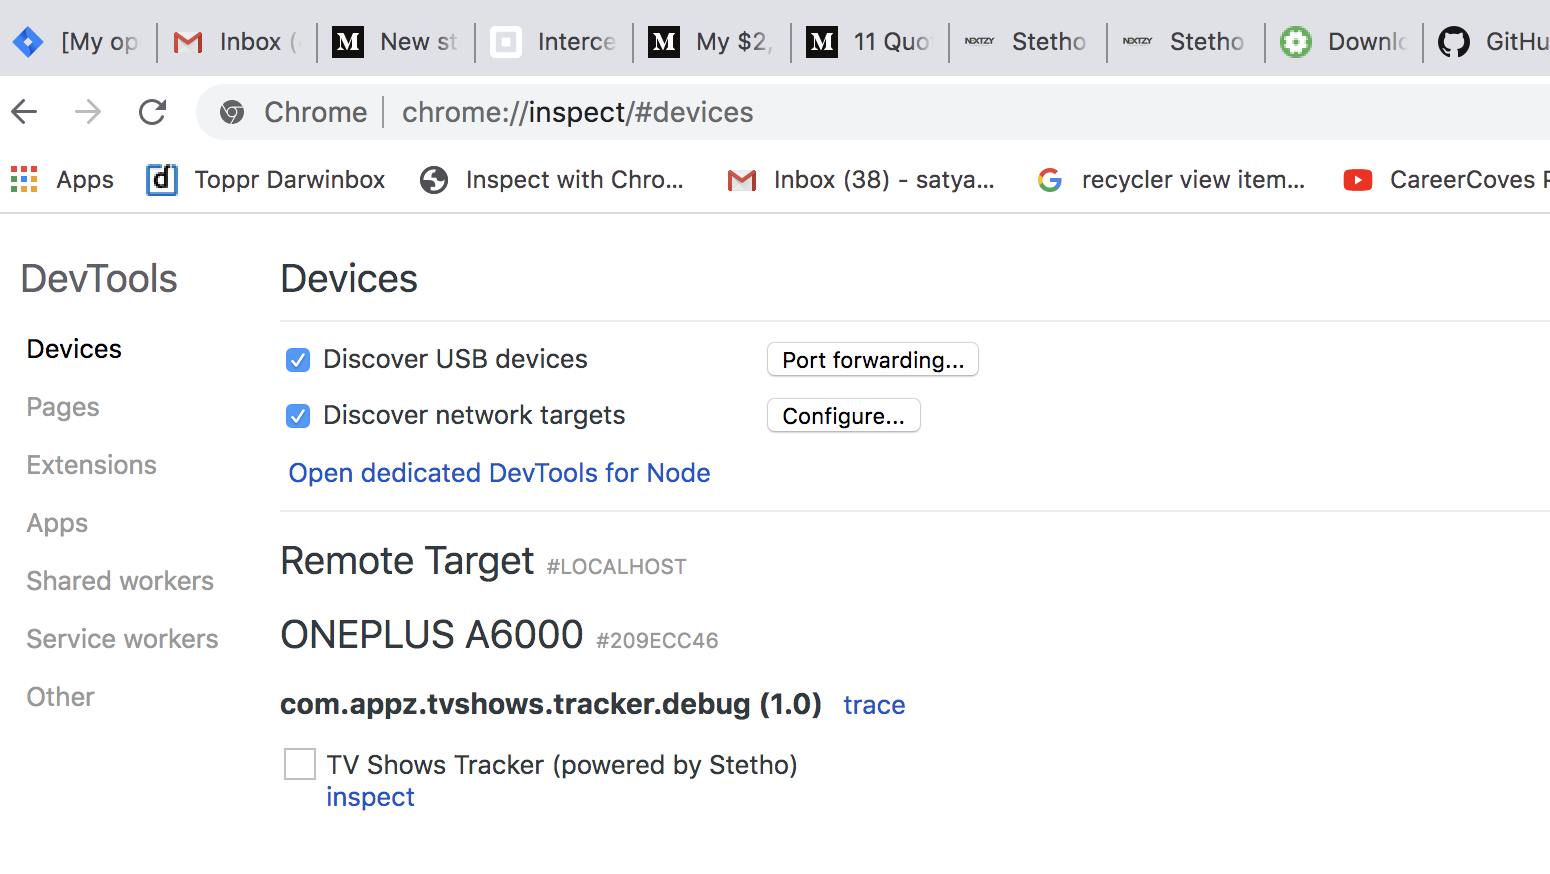
In the screen above, you can see my connected device with the starting name ONEPLUS. Here, it will list all the devices that are connected with the USB debugging option enabled along with the list of apps on each device with Stetho integrated.
在上面的屏幕中,您可以看到已连接设备的名称为ONEPLUS。 在这里,它将列出启用了USB调试选项的所有已连接设备,以及集成了Stetho的每台设备上的应用程序列表。
So when you click on inspect below the app name, actual magic happens. It opens a separate window that gives an overview of all the services in a list format with every detail required.
因此,当您单击应用程序名称下方的“ 检查 ”时,就会发生真正的魔术。 它会打开一个单独的窗口,以列表格式提供所有服务的概述,其中包含所需的每个详细信息。
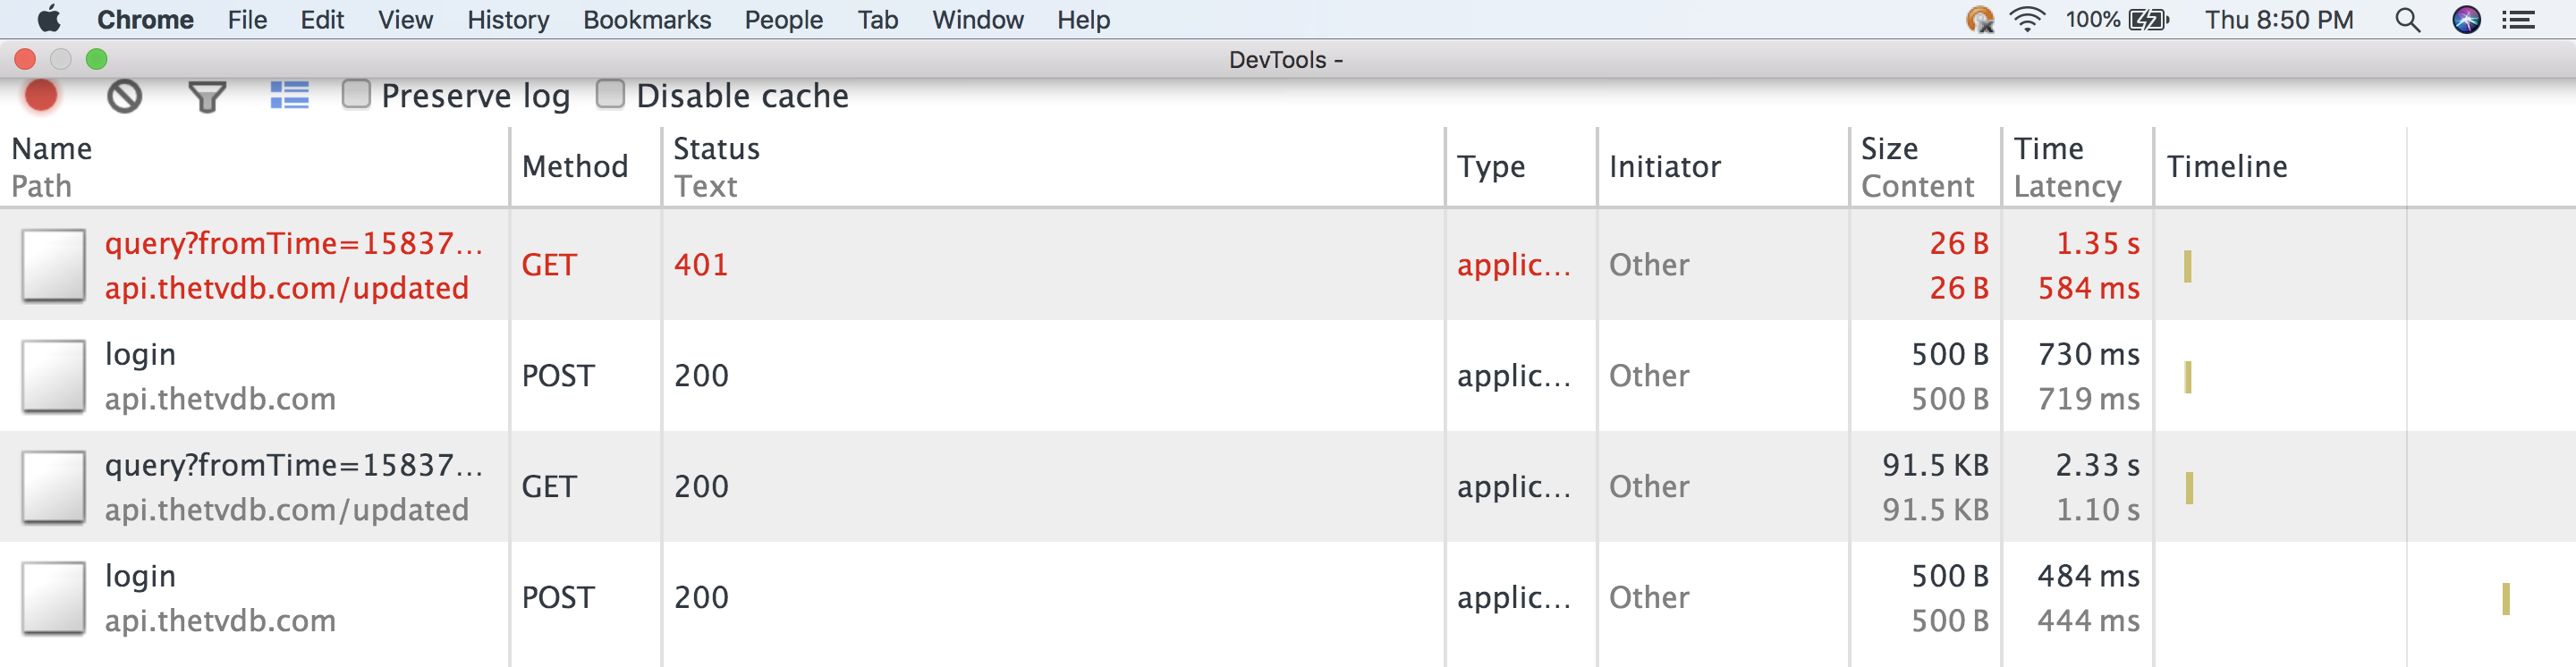
You can also find any duplicate requests that are getting fired easily, as we have with Log.
您也可以找到与Log一样容易被触发的任何重复请求。
When you click on any single request, it will show three different sections: Headers, Preview, and Response. To view the individual section, you can click on each one. For example, if you click on Headers, it will show the following:
单击任何单个请求时,它将显示三个不同的部分:标题,预览和响应。 要查看各个部分,可以单击每个部分。 例如,如果单击“标题”,它将显示以下内容:
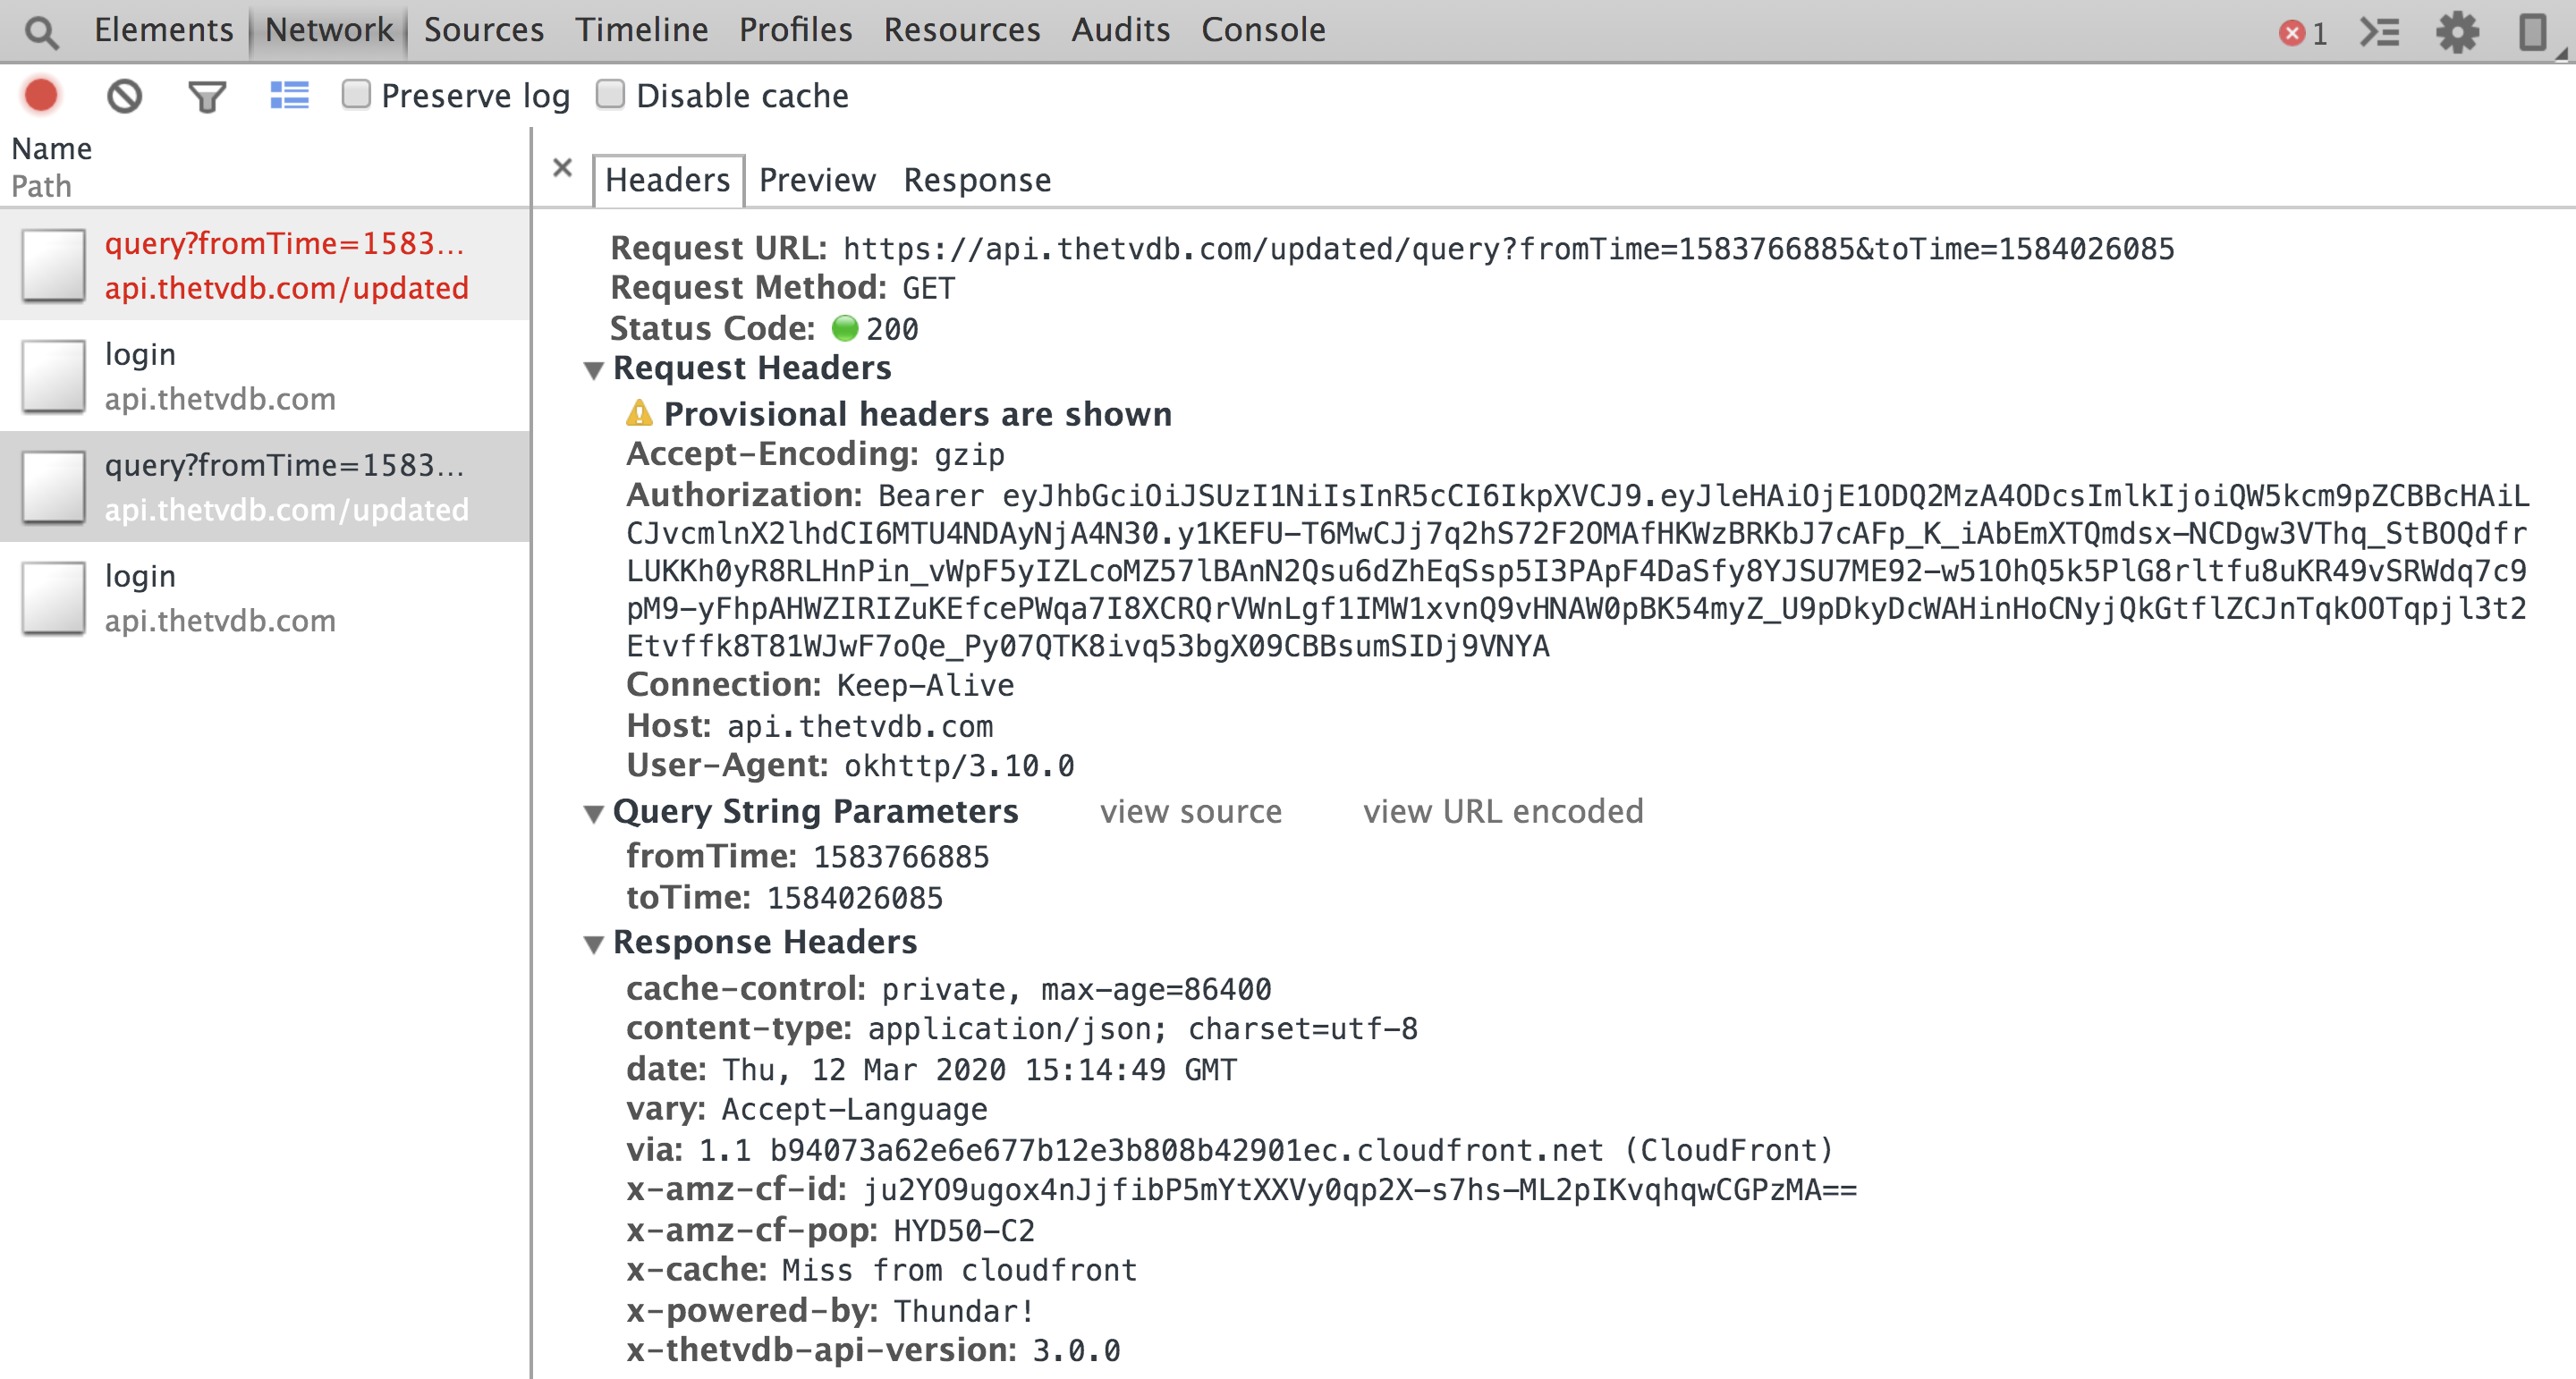
You can view the complete request params part here. This is very comfortable for viewing the request header part in detail. You can easily find out any request params that are missing while firing the request.
您可以在此处查看完整的请求参数部分。 对于详细查看请求标头部分,这非常舒适。 您可以轻松地找出触发请求时丢失的任何请求参数。
Now let’s check the Preview section:
现在让我们检查“预览”部分:
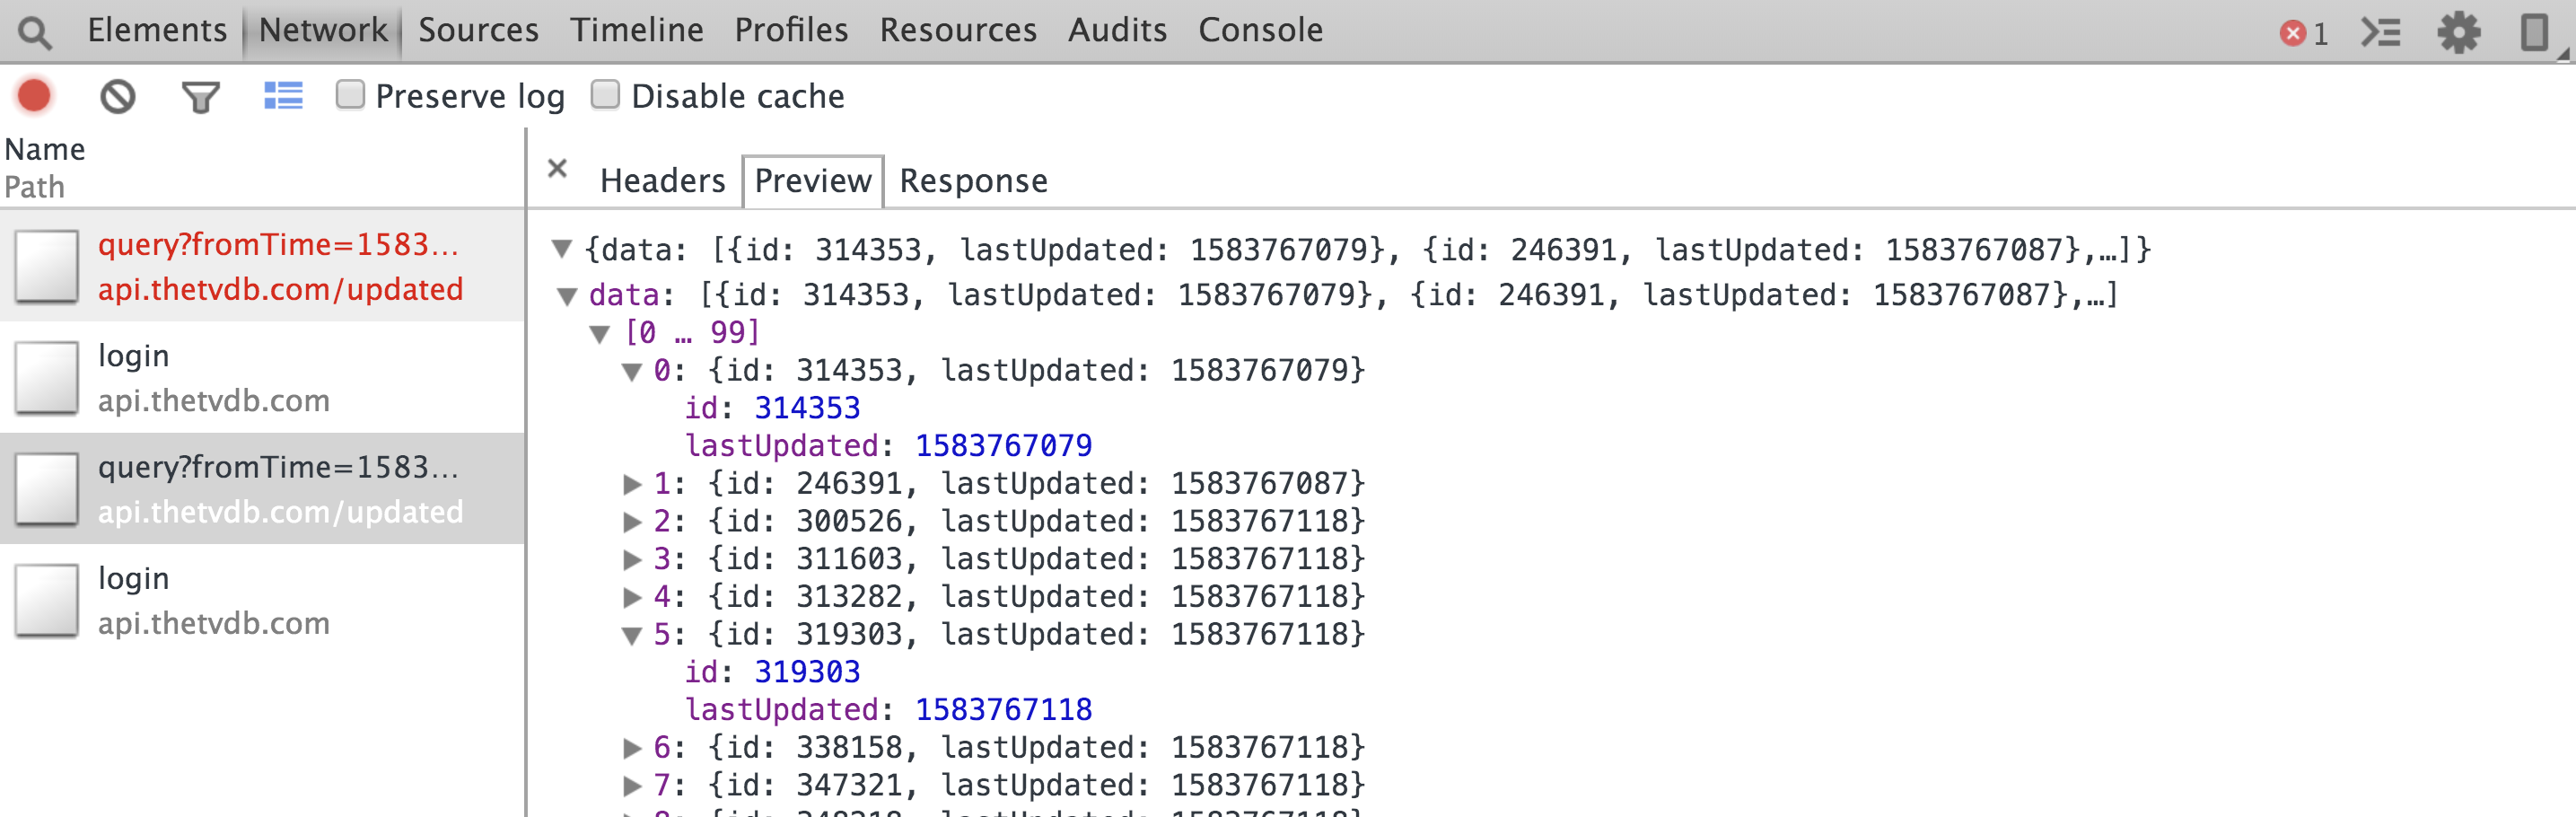
It shows in the JSON collapsed format when you click on the first node, then it opens the objects inside it and the same continues with the internal nodes. This can help you to build model classes very easily. You can even figure out the mismatching data formats and expected values’ missing cases in seconds.
当您单击第一个节点时,它以JSON折叠格式显示,然后打开其中的对象,并且内部节点也是如此。 这可以帮助您非常轻松地构建模型类。 您甚至可以在几秒钟内找出不匹配的数据格式和期望值的缺失情况。
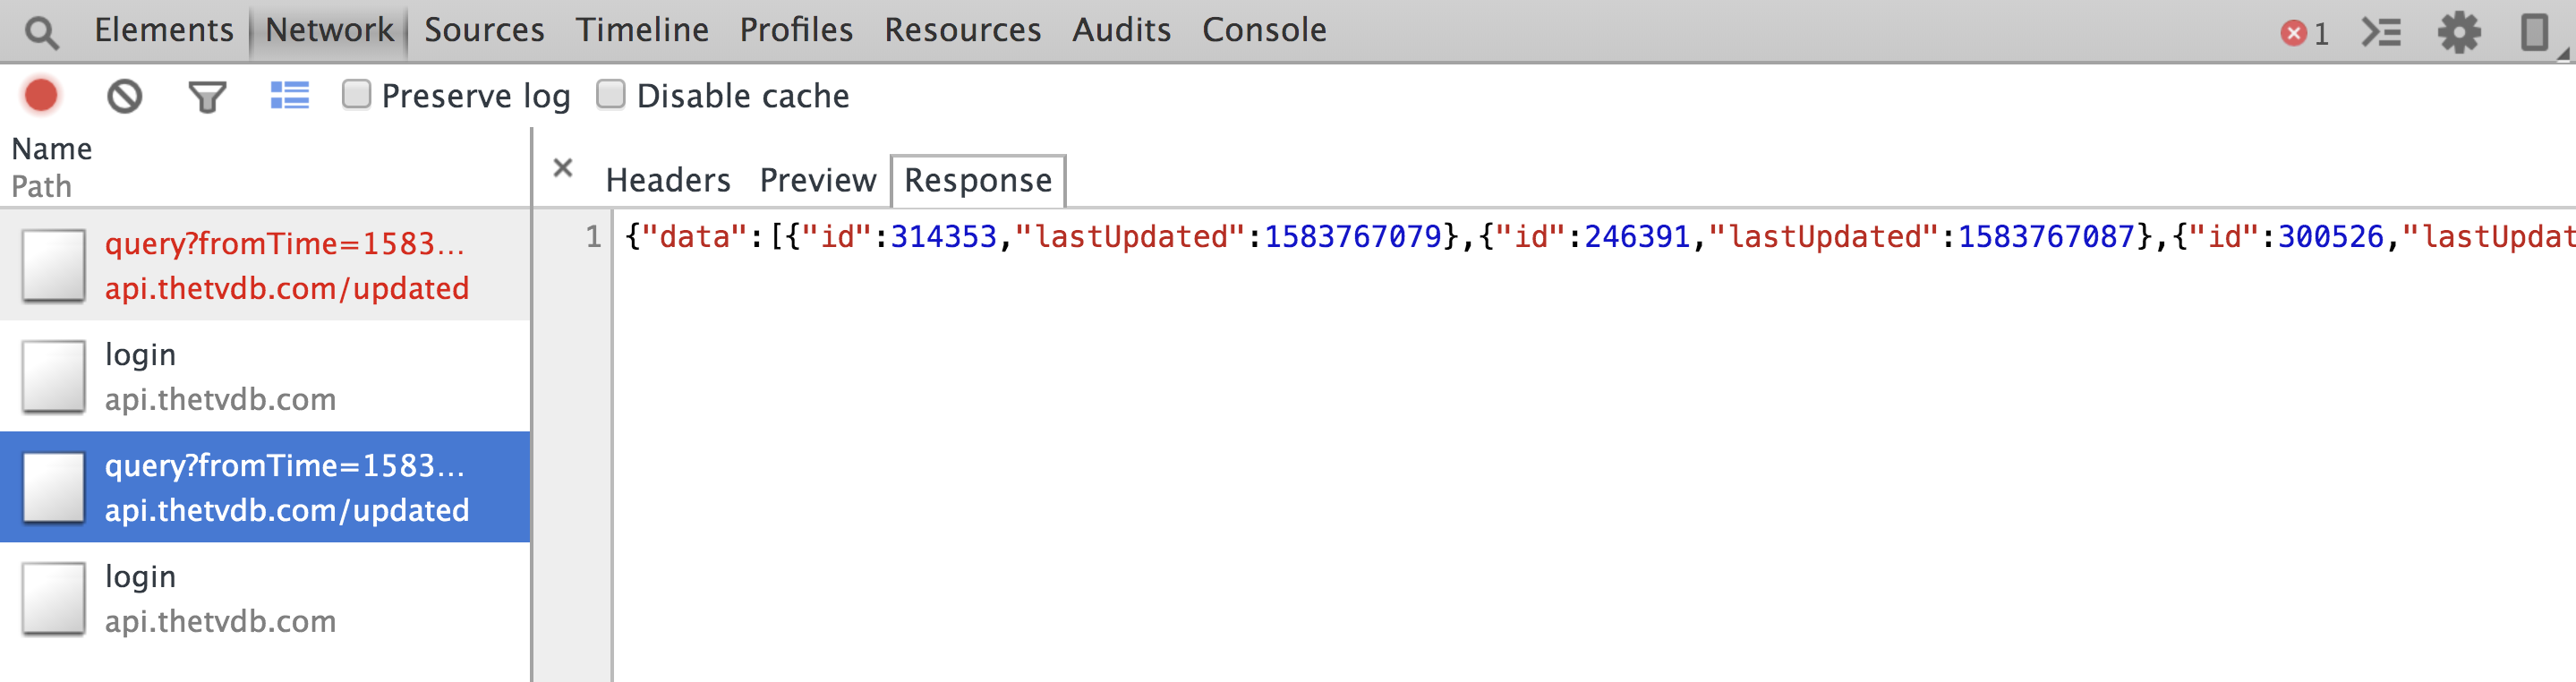
The Response section is raw-format data. You can simply copy-paste it anywhere:
响应部分是原始格式的数据。 您可以简单地将其复制粘贴到任何地方:
If your device is disconnected, it shows the prompt below:
如果您的设备已断开连接,则会显示以下提示:
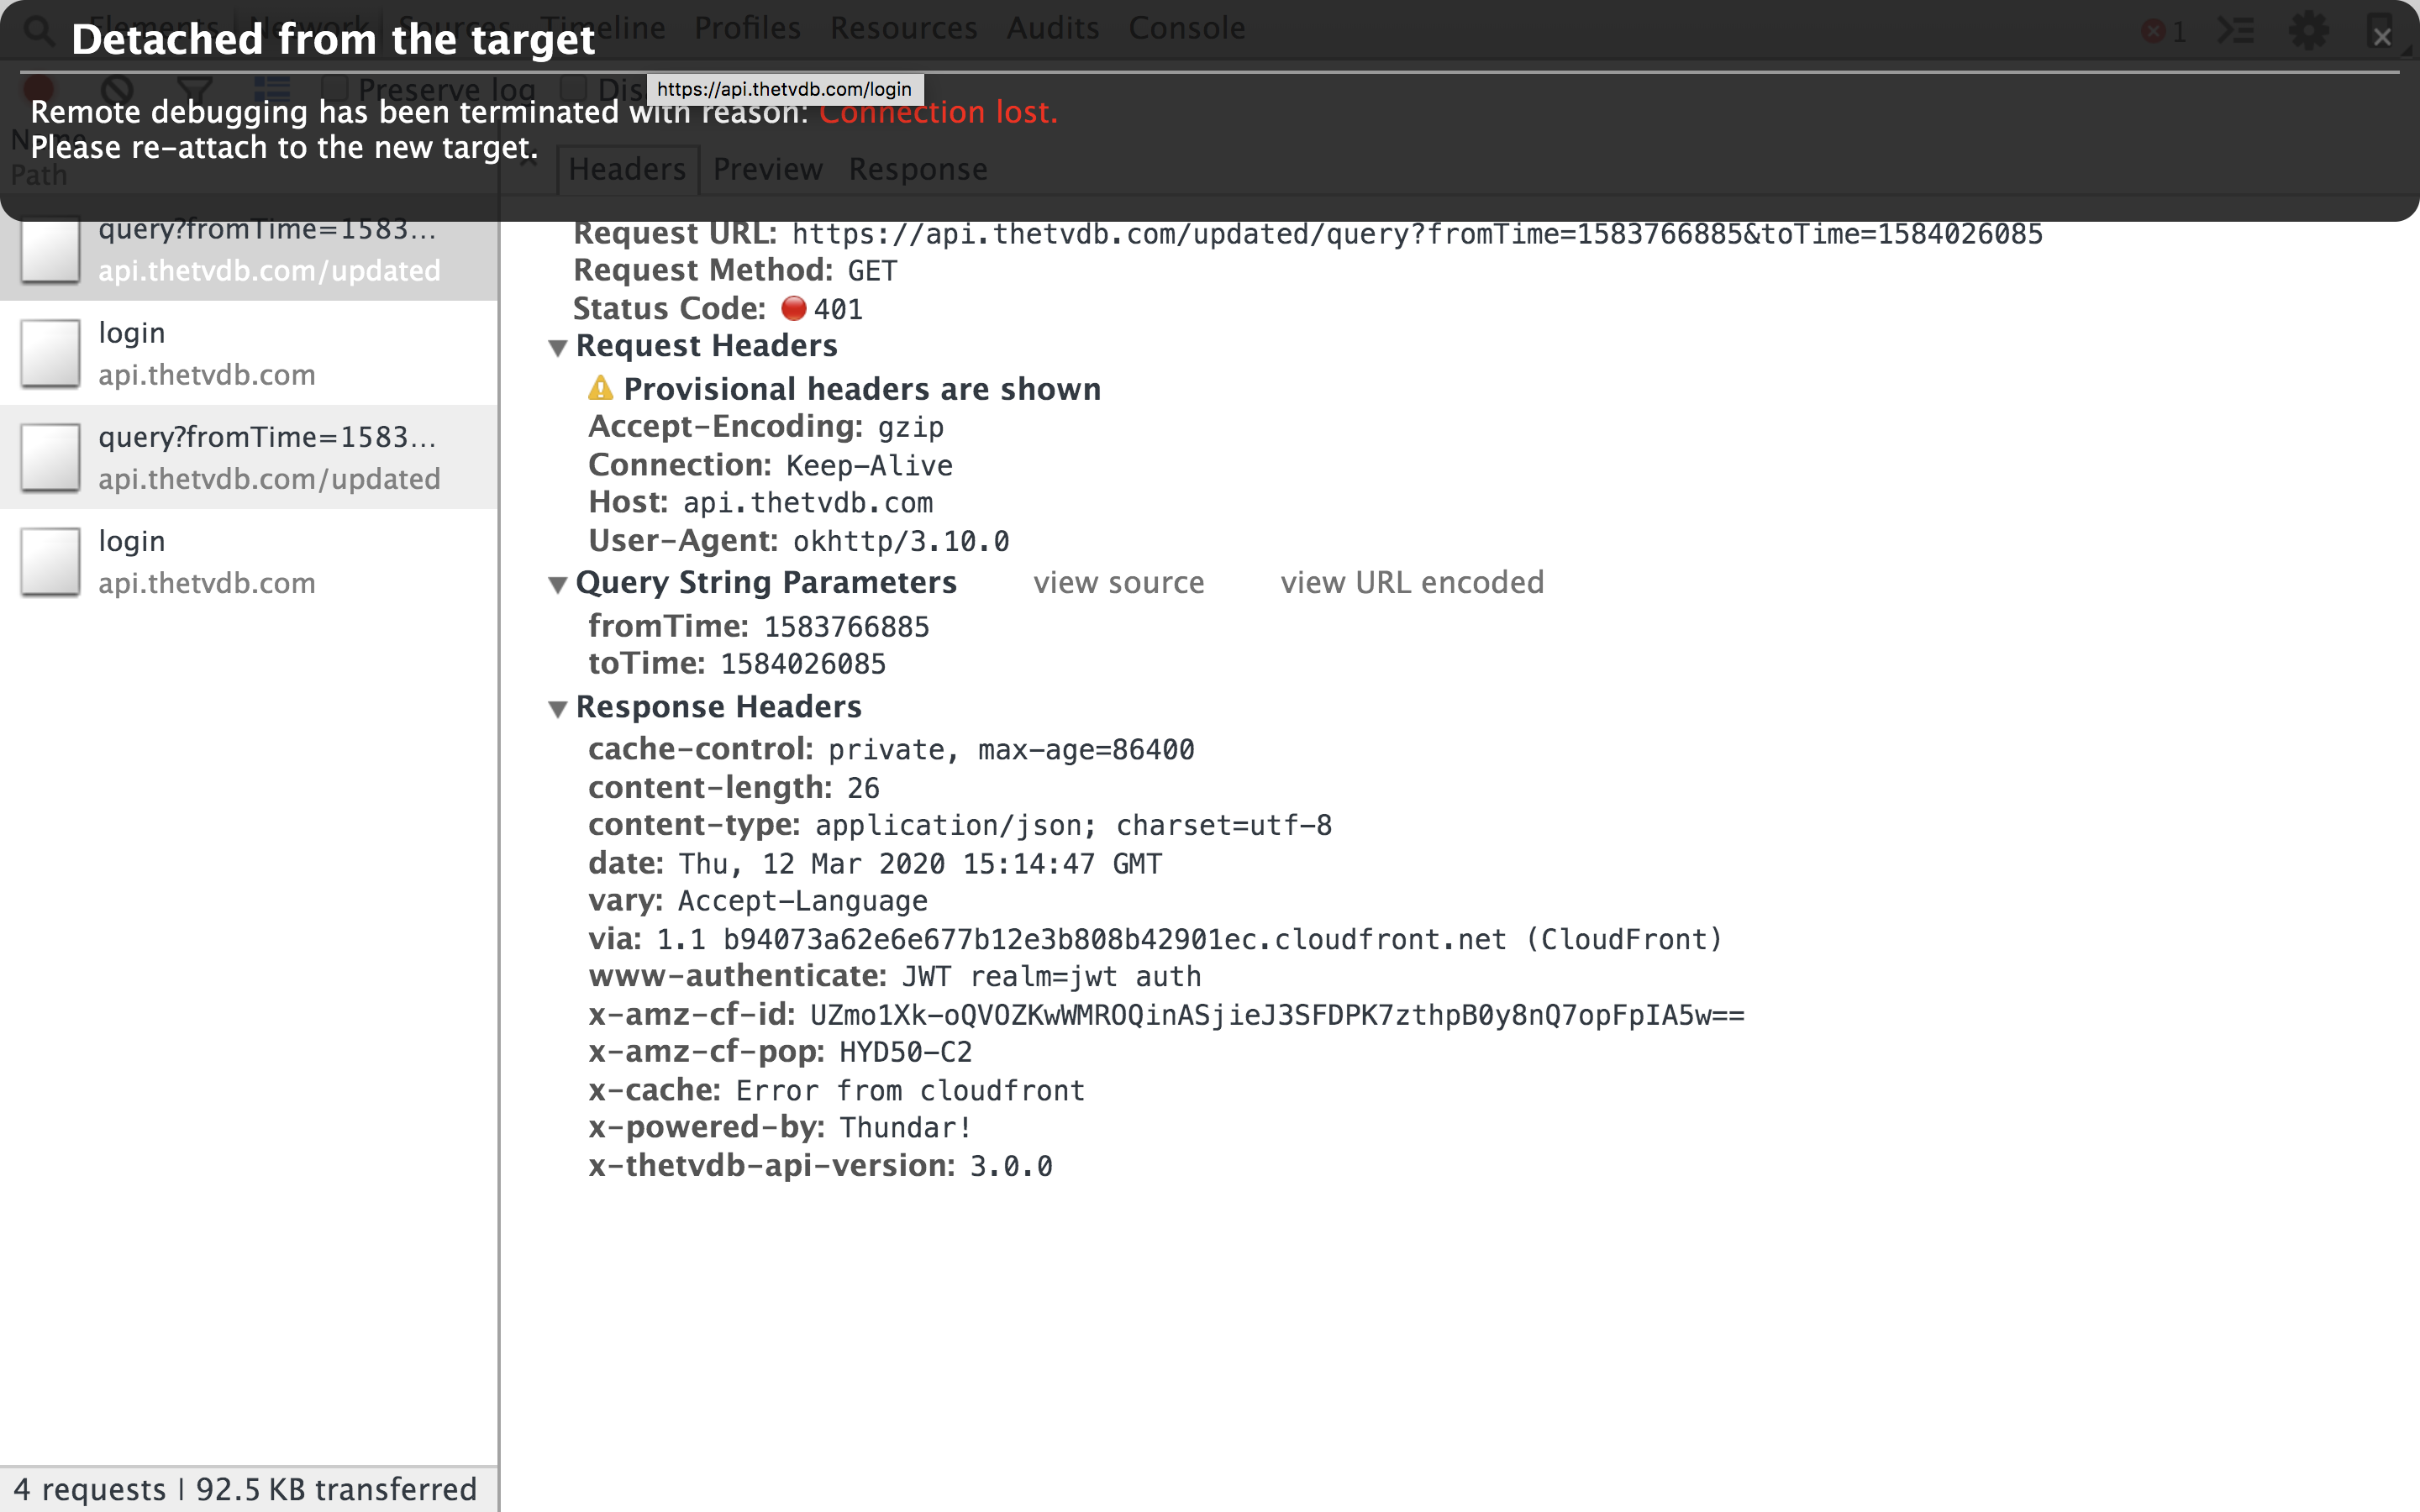
Click the checkbox for the Preserve Log option so you can view the data even if the device is disconnected. Otherwise, the data would be lost and you would need to reconnect the device and try again. Check out a sample of Stetho on GitHub by Facebook developers for more information.
单击“保留日志”选项的复选框,以便即使设备断开连接也可以查看数据。 否则,数据将丢失,您将需要重新连接设备并重试。 查看Facebook开发人员在GitHub上 的Stetho示例,以获取更多信息。
结论 (Conclusion)
By now, you should have an idea of how easily we can inspect the network fires with the Stetho library. That’s not all there is to Stetho. We have only discussed network inspection, but Stetho has many more features, like visualizing SQLite databases, view hierarchy, dump app, JavaScript console, etc. We can explore these in future articles.
到现在为止,您应该已经知道我们可以使用Stetho库轻松地检查网络火灾。 Stetho还不止这些。 我们仅讨论了网络检查,但是Stetho具有更多功能,例如可视化SQLite数据库,视图层次结构,转储应用程序,JavaScript控制台等。我们可以在以后的文章中进行探讨。
Thanks for reading. Please let me know your suggestions and comments.
谢谢阅读。 请让我知道您的建议和意见。
stetho 调试数据库


 1万+
1万+


 被折叠的 条评论
为什么被折叠?
被折叠的 条评论
为什么被折叠?
 到【灌水乐园】发言


