


 本文介绍了如何运用时间序列模型,特别是Facebook的先知模型,进行时间序列预测,以此来预测股价变动。通过机器学习算法,结合Python编程,实现对股票市场的智能预测。
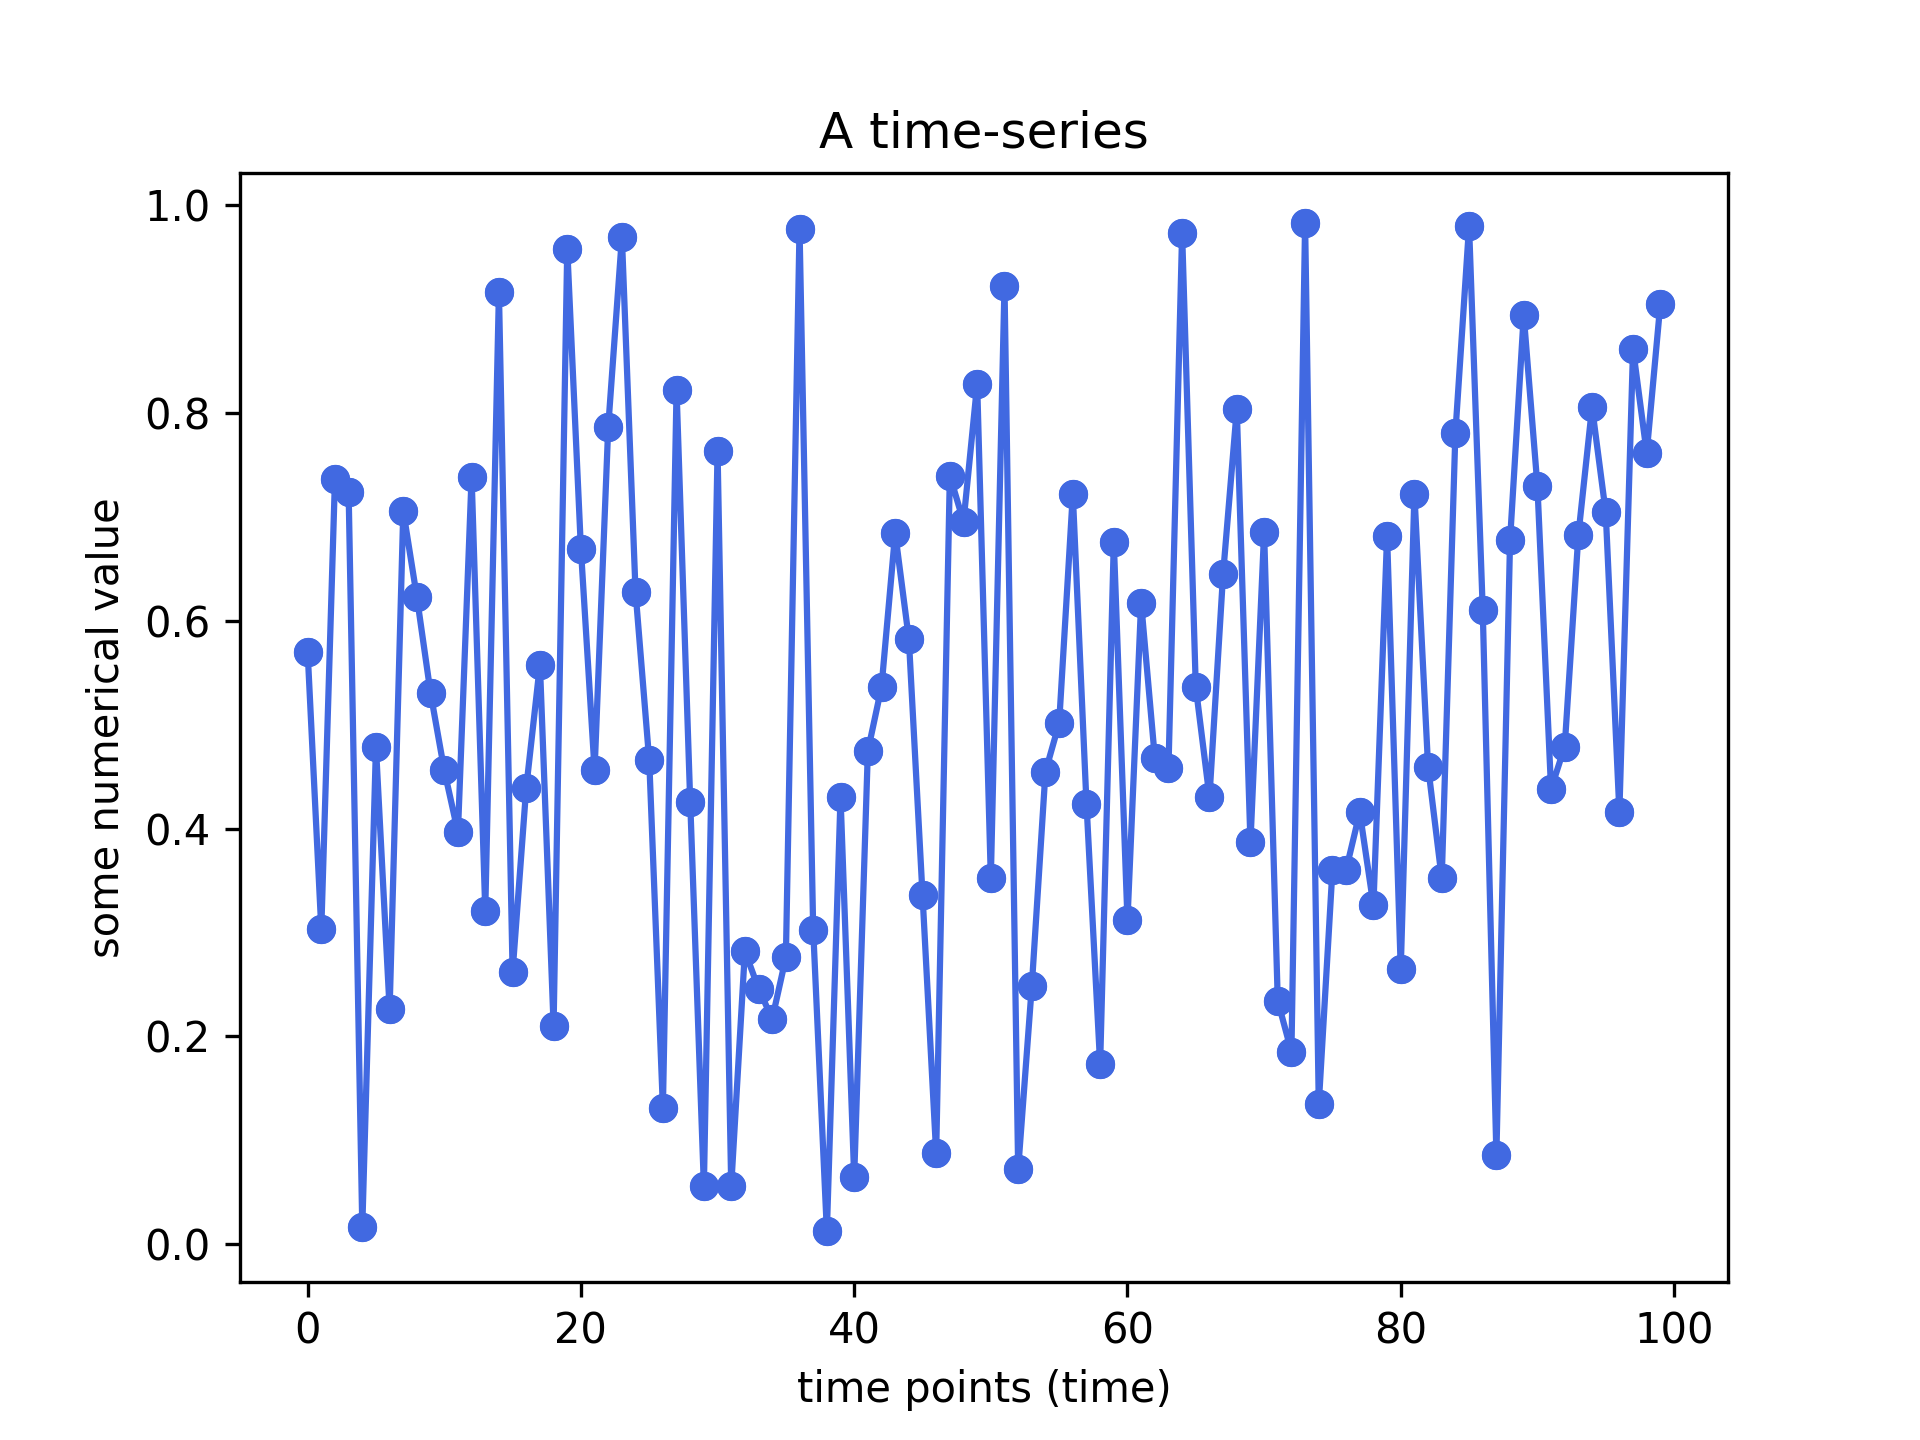
时间序列模型预测
1.简介 (1. Introduction)
1.1。 时间序列和预测模型 (1.1. Time-series & forecasting models)
Traditionally most machine learning (ML) models use as input features some observations (samples / examples) but there is no time dimension in the data.
传统上,大多数机器学习(ML)模型使用一些观察值(样本/示例)作为输入特征,但是数据中没有时间 维度 。
Time-series forecasting models are the models that are capable to predict future values based on previously observed values. Time-series forecasting is widely used for non-stationary data. Non-stationary data are called the data whose statistical properties e.g. the mean and standard deviation are not constant over time but instead, these metrics vary over time.
时间序列预测模型是能够基于先前 观察到的 值来预测 未来值的模型。 时间序列预测已广泛用于非平稳数据 。 非平稳数据称为其统计属性(例如,平均值和标准偏差)随时间变化的数据不是恒定的,而是这些度量随时间变化的数据。
These non-stationary input data (used as input to these models) are usually called time-series. Some examples of time-series include the temperature values over time, stock price over time, price of a house over time etc. So, the input is a signal (time-series) that is defined by observations taken sequentially in time.
这些非平稳输入数据(用作这些模型的输入)通常称为时间序列。 时间序列的一些示例包括随时间变化的温度值,随时间变化的股票价格,随时间变化的房屋价格等。因此,输入是一个信号 (时间序列), 由按时间顺序进行的观察定义 。
A time series is a sequence of observations taken sequentially in time.
时间序列是按时间顺序进行的一系列观察。
Observation: Time-series data is recorded on a discrete time scale.
观察:时间序列数据以离散的 时间 刻度记录。
Disclaimer (before we move on): There have been attempts to predict stock prices using time series analysis algorithms, though they still cannot be used to place bets in the real market. This is just a tutorial article that does not intent in any way to “direct” people into buying stocks.
免责声明 (在继续之前):尽管仍然不能使用时间序列分析算法来预测实际市场中的价格,但已经尝试进行预测。 这只是一篇教程文章,无意以任何方式“引导”人们购买股票。
1.2预测模型:Facebook的先知 (1.2 The forecasting model: Facebook’s Prophet)
The most commonly used models for forecasting predictions are the autoregressive models. Briefly, the autoregressive model specifies that the output variable depends linearly on its own previous values and on a stochastic term (an imperfectly predictable term).
用于预测预测的最常用模型是自回归模型。 简而言之,自回归模型指定输出变量线性地取决于其自身的先前值和随机项(一个不完全可预测的项)。
Recently, in an attempt to develop a model that could capture seasonality in time-series data, Facebook developed the famous Prophet model that is publicly available for everyone. In this article, we will use this state-of-the-art model: the Prophet model. Prophet is able to capture daily, weekly and yearly seasonality along with holiday effects, by implementing additive regression models.
最近,为了开发一种可以捕获时间序列数据季节性的模型, Facebook开发了著名的Prophet模型,该模型公开供所有人使用。 在本文中,我们将使用最先进的模型: Prophet模型。 通过实施加性回归 模型 ,先知能够捕获每日 , 每周和每年的季节性以及假日 影响 。
The mathematical equation behind the Prophet model is defined as:
先知模型背后的数学方程式定义为:
y(t) = g(t) + s(t) + h(t) + e(t)
y(t)= g(t)+ s(t)+ h(t)+ e(t)
- with, g(t) representing the trend. Prophet uses a piecewise linear model for trend forecasting. 其中,g(t)代表趋势。 先知使用分段线性模型进行趋势预测。
- s(t) represents periodic changes (weekly, monthly, yearly). s(t)代表周期性变化(每周,每月,每年)。
- h(t) represents the effects of holidays (recall: Holidays impact businesses). h(t)代表假期的影响(回想一下:假期对企业的影响)。
- e(t) is the error term. e(t)是误差项。
The Prophet model fitting procedure is usually very fast (even for thousands of observations) and it does not require any data pre-processing. It deals also with missing data and outliers.
Prophet模型拟合过程通常非常快(即使对于成千上万个观测值而言),并且不需要任何数据预处理。 它还处理丢失的数据和异常值。
In this article, we are going to use the Prophet mode to predict Google’s stock price in the future.
在本文中,我们将使用先知模式来预测Google的未来股价。
Let’s get started !
让我们开始吧 !
2.获取股价历史数据 (2. Getting the stock price history data)
Thanks to Yahoo finance we can get the data for free. Use the following link to get the stock price history of Google: https://finance.yahoo.com/quote/GOOG/history?period1=1433548800&period2=1591833600&interval=1d&filter=history&frequency=1d
多亏了Yahoo的资助,我们可以免费获得数据。 使用以下链接获取Google的股价历史记录: https : //finance.yahoo.com/quote/GOOG/history?period1=1433548800&period2=1591833600&interval=1d&filter= history &frequency=1d
You should see the following:
您应该看到以下内容:
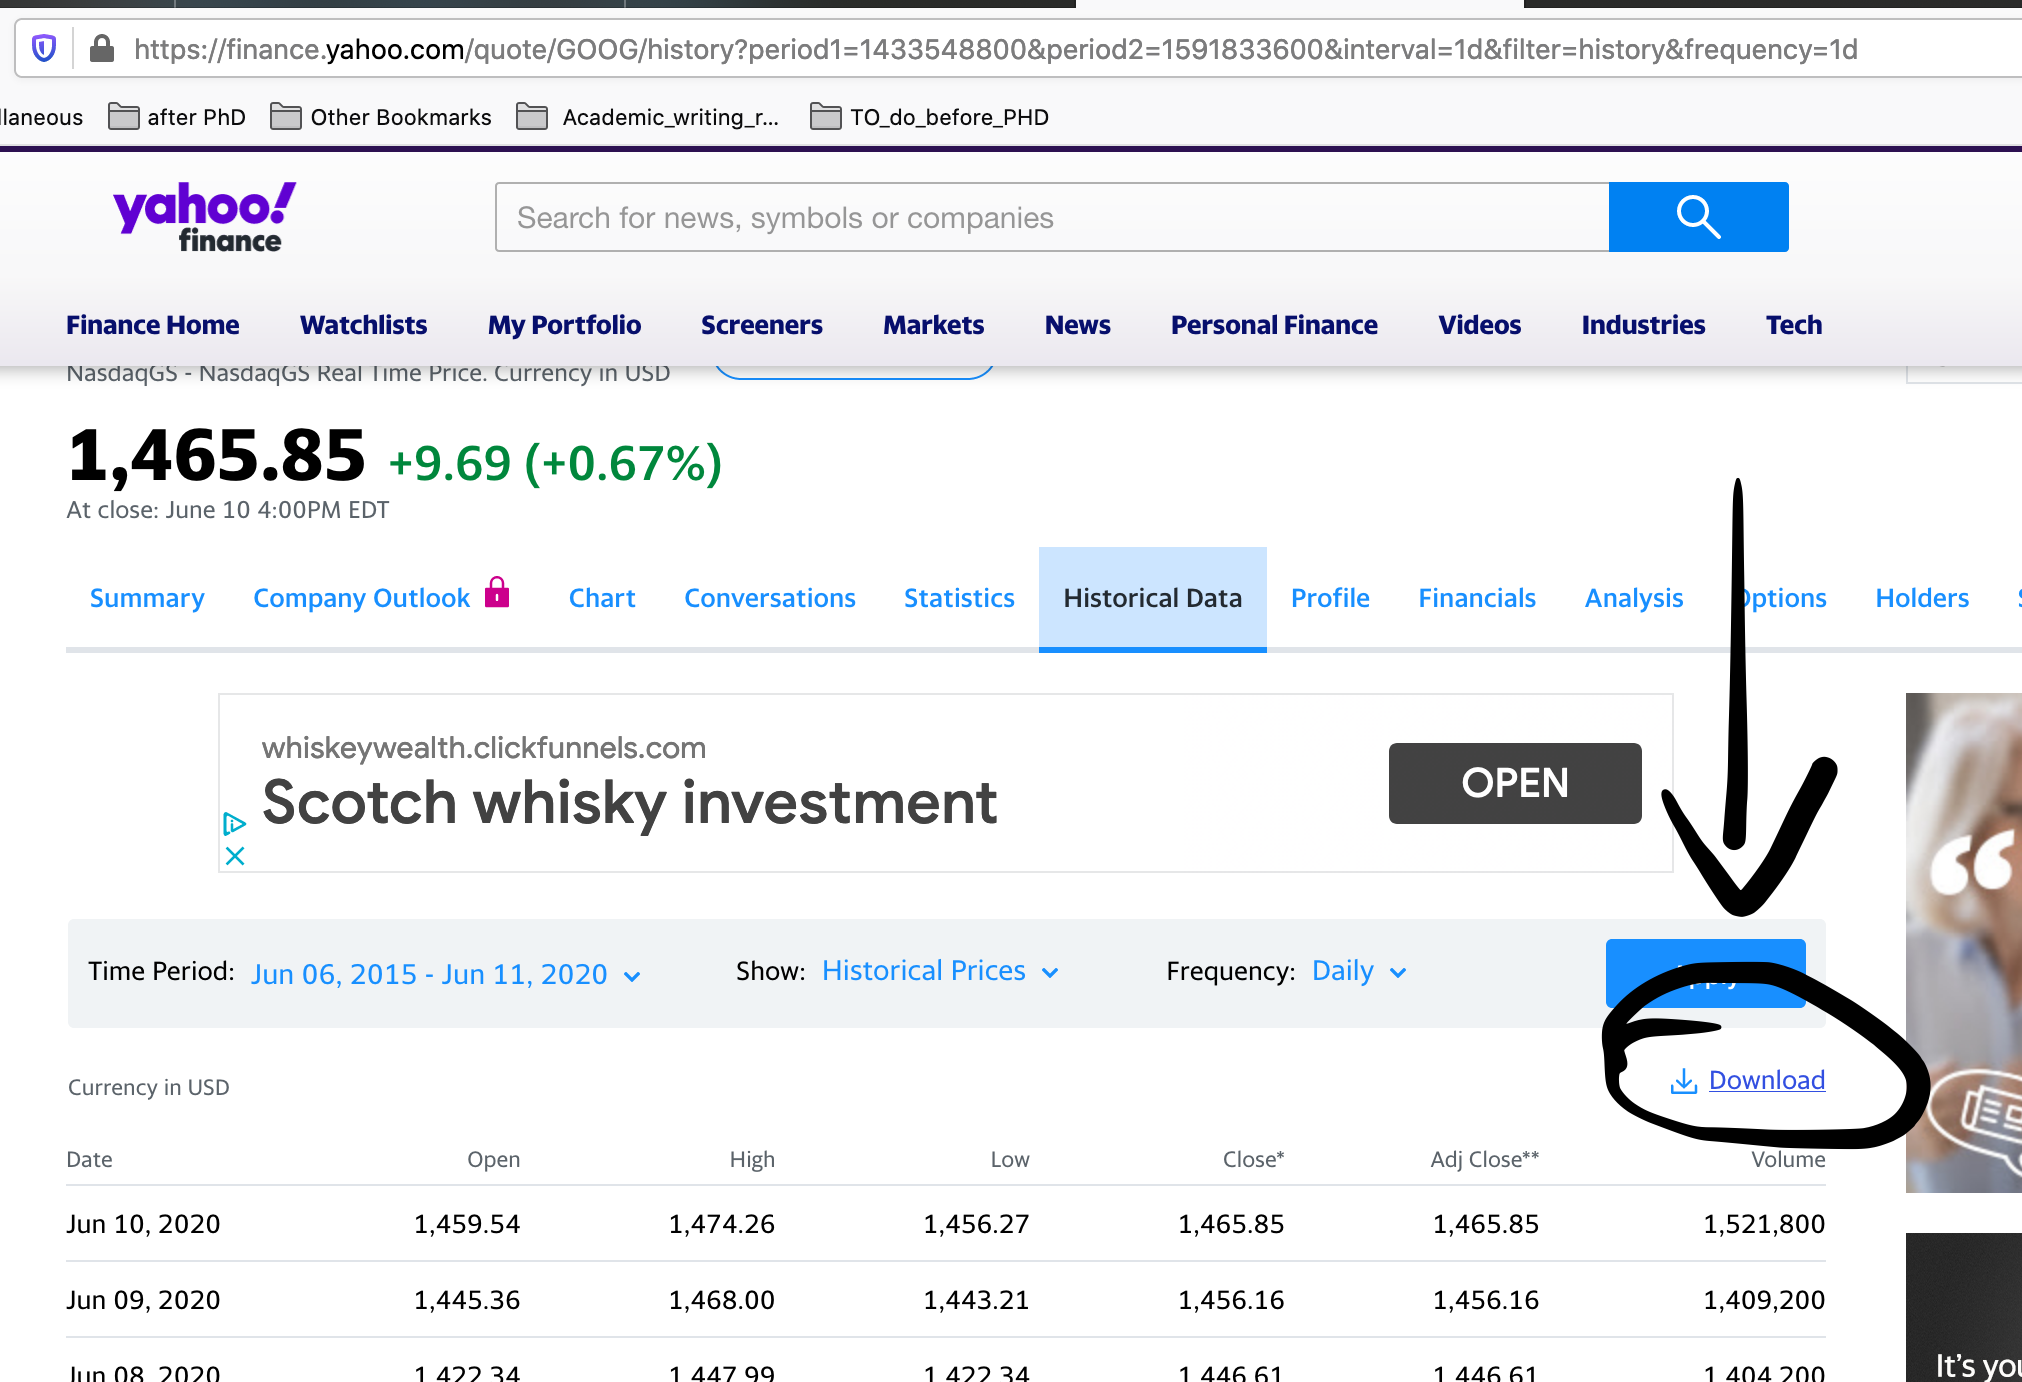
Click on the Download and save the .csv file locally on your computer.
单击下载,然后将.csv文件本地保存在您的计算机上。
The data are from 2015 till now (2020) !
数据为2015年至今( 2020年 )!
3. Python工作示例 (3. Python working example)
Now that we have the data, let’s inspect the data, build the model and predict the stock price !
现在我们有了数据,让我们检查数据,建立模型并预测股价!
3.1. Load & inspect the data
3.1。 加载并检查数据
import numpy as np
import pandas as pd
import matplotlib.pyplot as plt# Load the dataset using pandas
data = pd.read_csv("/Users/loukas/Downloads/GOOG.csv")
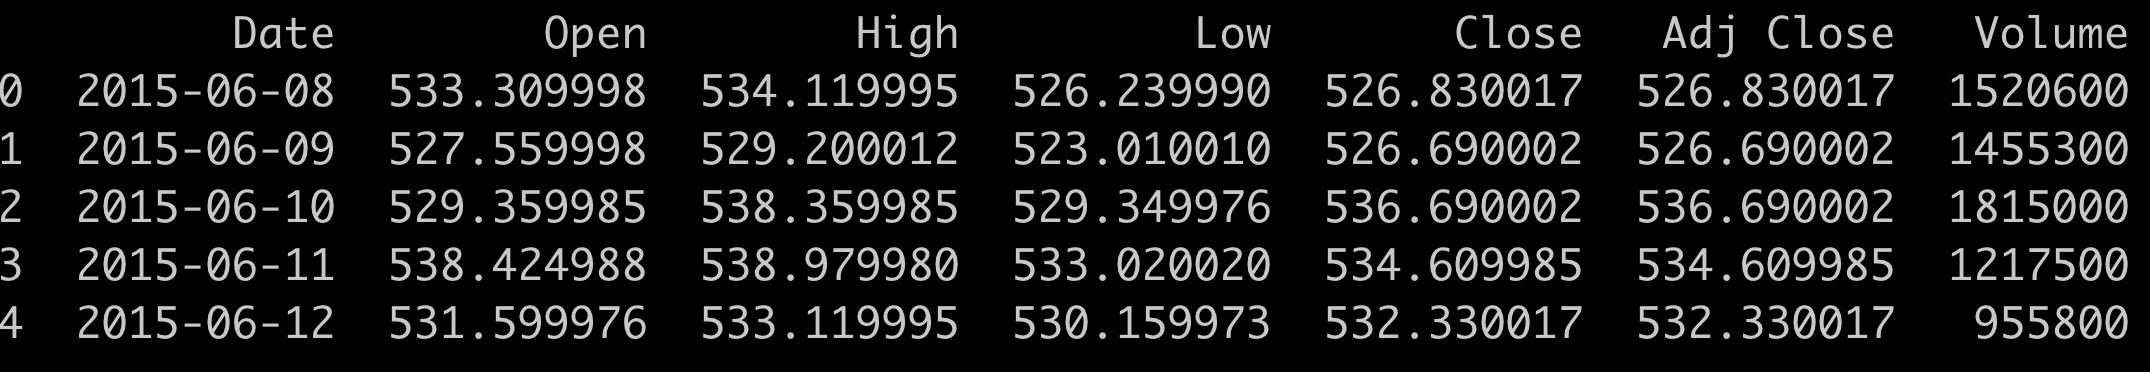
data.head(5)The above code should print the following:
上面的代码应打印以下内容:
Now, let’s print some statistics such as the mean, median, min, max and standard deviation values for the above features (columns).
现在,让我们打印一些统计信息,例如以上特征(列)的平均值,中位数,最小值,最大值和标准偏差值。
data.describe()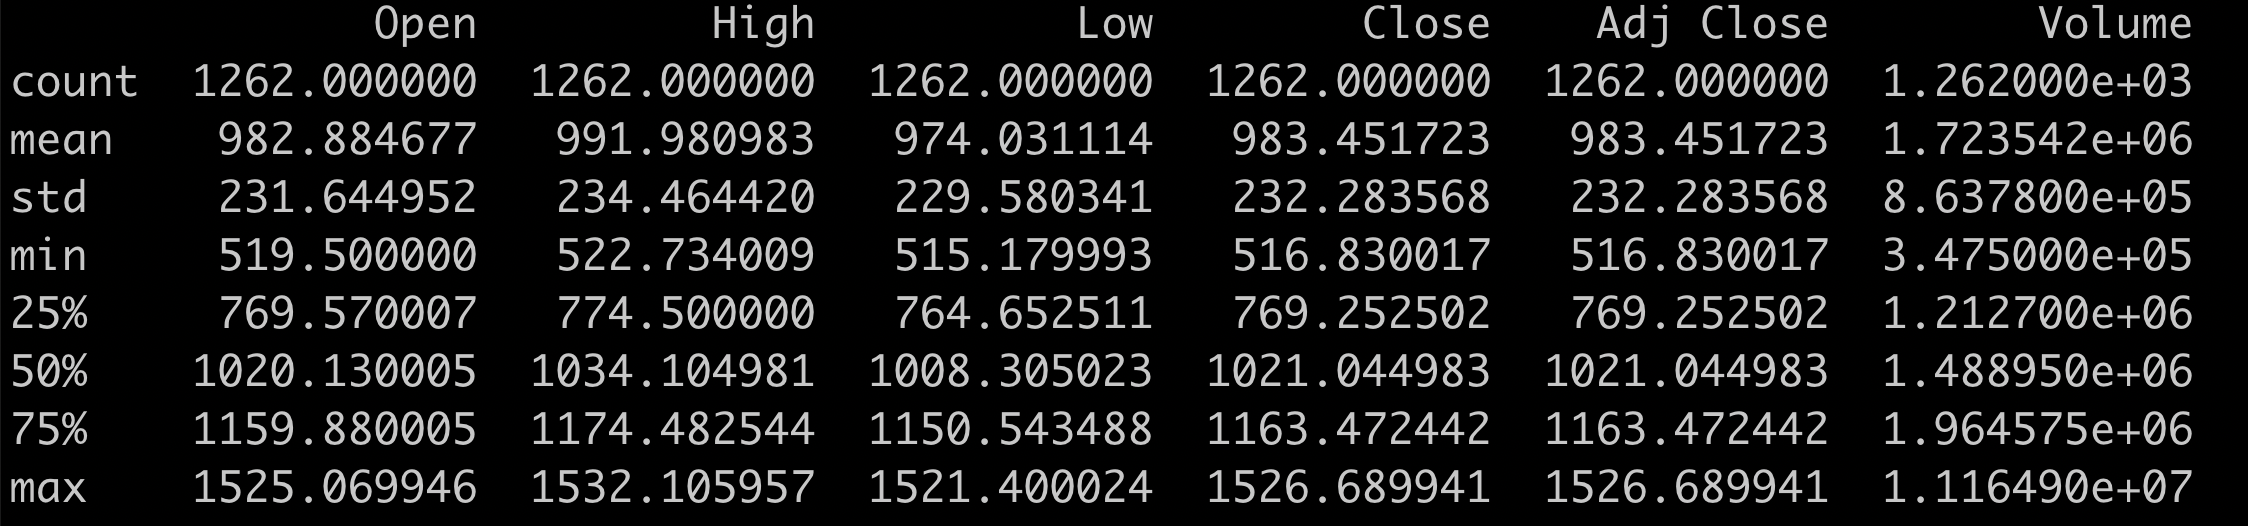
Over the past 5 years (2015–2020) the mean stock price at Close is 983.45 ! Really high!
在过去5年(2015–2020年), 平均收盘价为983.45! 真高!
3.2. Build the predictive model
3.2。 建立预测模型
Let’s move on with the modeling now. We will only use the dates and the Close price as features for our model.
现在让我们继续进行建模。 我们将仅使用日期和收盘 价作为模型的功能。
# Select only the important features i.e. the date and price
data = data[["Date","Close"]] # select Date and Price# Rename the features: These names are NEEDED for the model fitting
data = data.rename(columns = {"Date":"ds","Close":"y"}) #renaming the columns of the datasetdata.head(5)
The last python command should return the first 5 lines of our dataset. You should see something like this:
最后一条python命令应返回数据集的前5行。 您应该会看到以下内容:
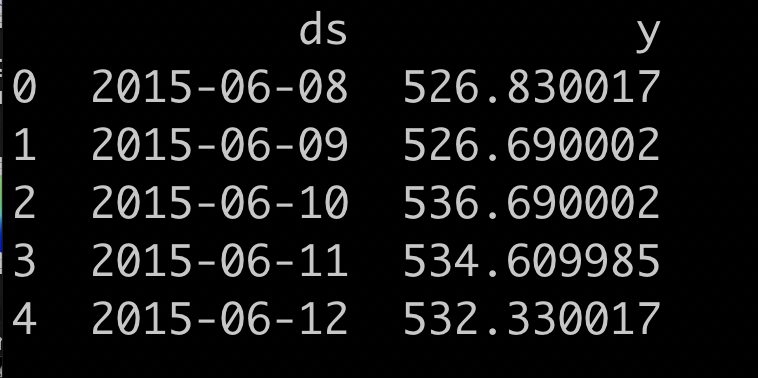
Here, ds is the date and y is the Google Stock price.
在这里, ds是日期, y是Google 股票价格。
In this tutorial, we will not split the data into training and test sets but instead we will use all the data to fit the model and then ask the model to predict future values i.e. the stock price in 2021.
在本教程中,我们不会将数据分为训练集和测试集,而是将使用所有数据来拟合模型,然后要求模型预测未来值,即2021年的股价。
Usually people split the data into training and testing because they do not want to train the model on the test set as well. If we keep a test set hidden, then the model will forecast values on unseen data. In that case, we would be also able to measure the error of the model.
通常,人们将数据分为训练和测试,因为他们也不想在测试集上训练模型。 如果我们隐藏测试集,则模型将根据看不见的数据预测值。 在这种情况下,我们也可以测量模型的误差。
Next, we import the Prophet class from the fbprophet module and then create an object of the Prophet class.
接下来,我们从fbprophet模块导入Prophet类,然后创建Prophet类的对象。
Side-note: The model’s github page is this: https://github.com/facebook/prophet
旁注:模型的github页面是这样的: https : //github.com/facebook/prophet
To install the module type on your console:
pip install fbprophet.要在控制台上安装模块类型:
pip install fbprophet。
from fbprophet import Prophetm = Prophet(daily_seasonality = True) # the Prophet class (model)
m.fit(data) # fit the model using all data
You should see this after the fitting:
试穿后,您应该会看到以下内容:
Optimization terminated normally: Convergence detected: relative gradient magnitude is below tolerance
优化正常终止:检测到收敛:相对梯度幅度低于公差
3.3. Plot the predictions
3.3。 绘制预测
Now, for the last step, we will ask the model to predict future values and then visualize the predictions.
现在,对于最后一步,我们将要求模型预测未来值,然后可视化预测。
future = m.make_future_dataframe(periods=365) #we need to specify the number of days in future
prediction = m.predict(future)
m.plot(prediction)plt.title("Prediction of the Google Stock Price using the Prophet")
plt.xlabel("Date")
plt.ylabel("Close Stock Price")
plt.show()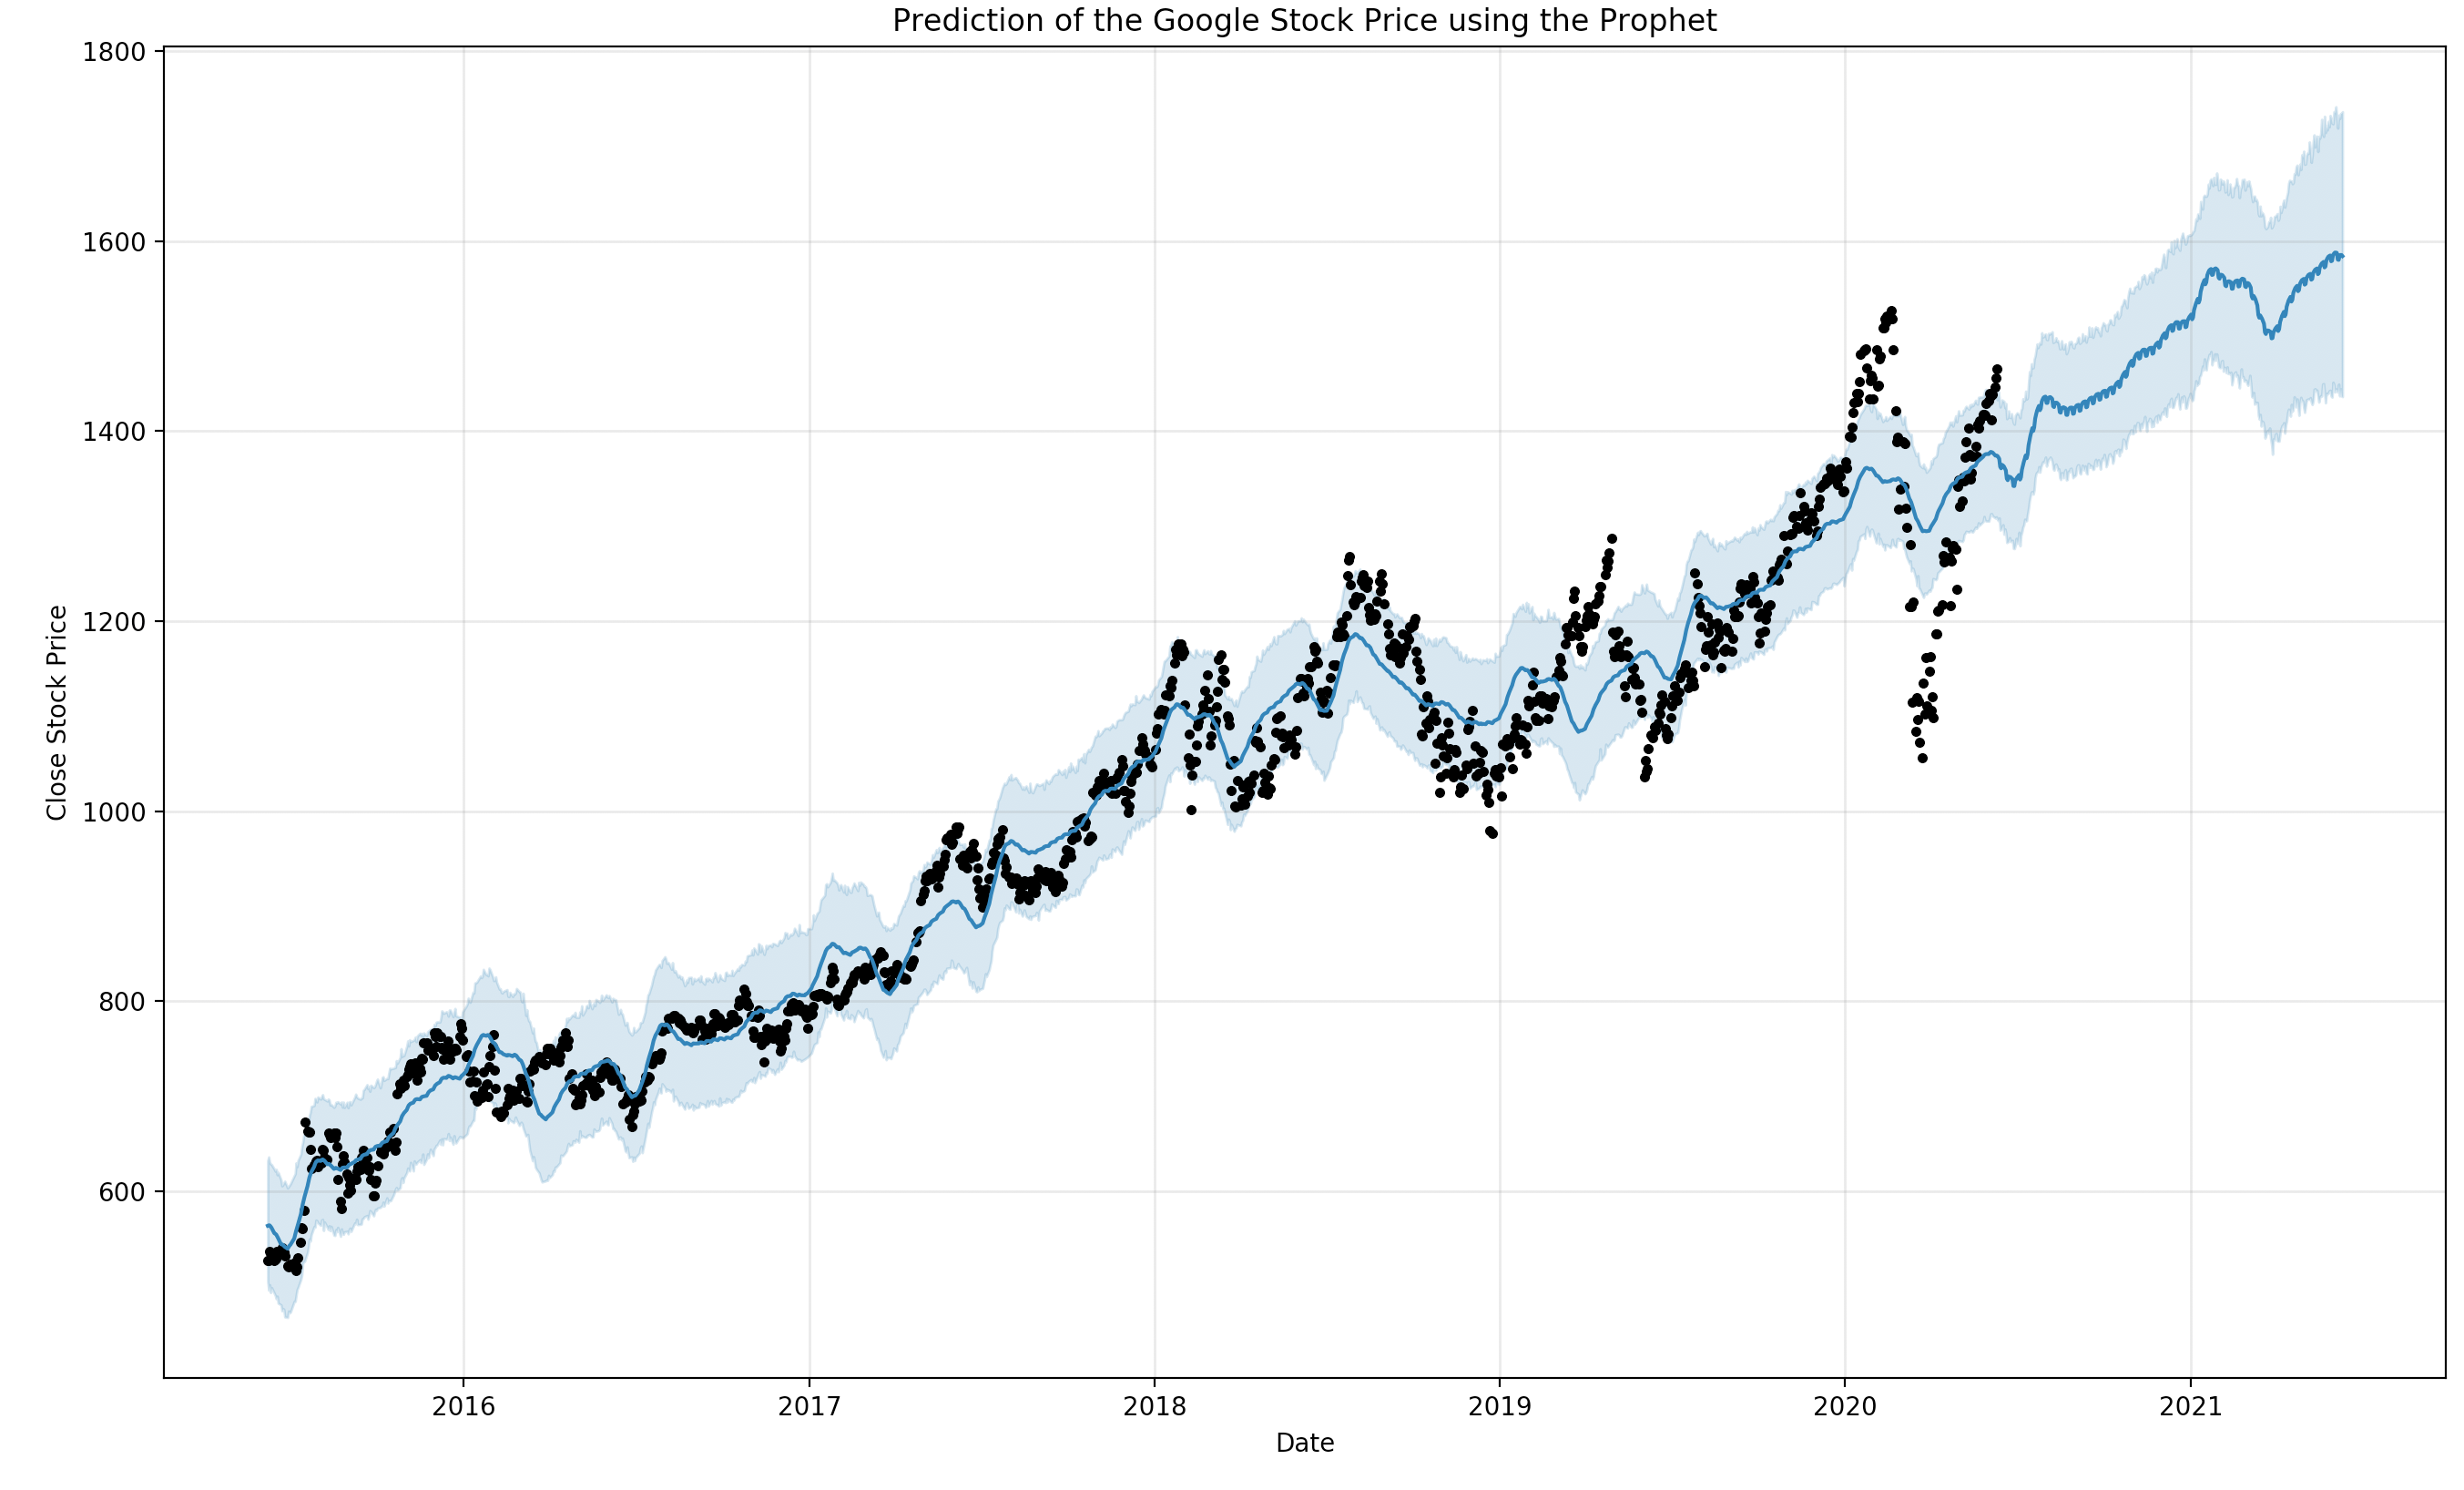
该模型使用了所有训练数据(黑点),并预测了2020年6月至2021年6月的未来股价! 蓝色阴影是置信区间。 (The model used all the data for the training (black dots) and predicted the future stock price from June 2020 till June 2021 ! Blue shadow is the confidence interval.)
Conclusion: It seems that the Google Stock price will be around 1600 in June 2021 based on the model’s prediction.
结论 :根据该模型的预测,Google股票价格似乎将在2021年6月达到1600左右。
Side note: In this case, we cannot measure the error of the model. If someone wanted to do that, then they should split the data into training and test sets, fit the model using the training set only, predict the prices of the test set and then measure the error using the ground truth price values of the test set.
边 注 :在这种情况下, 我们无法衡量模型的误差 。 如果有人愿意这样做,则应将数据分为训练集和测试集,仅使用训练集拟合模型,预测测试集的价格,然后使用测试集的真实价格来衡量误差。 。
Observation: Huge drop in March 2020 due to the COVID-19 lockdown.
观察 :由于COVID-19锁定,2020年3月的大幅下降。
奖金 (BONUS)
3.4. Plot the trend, weekly, seasonally, yearly and daily components
3.4。 绘制趋势,每周,季节性,年度和每日组成部分
If you want to see the forecast components i.e. trend, weekly, seasonally, yearly and daily components, then you can do this using the following command.
如果要查看预测组成部分,例如趋势,每周,季节性,年度和每日组成部分 ,则可以使用以下命令进行操作。
m.plot_components(prediction)
plt.show()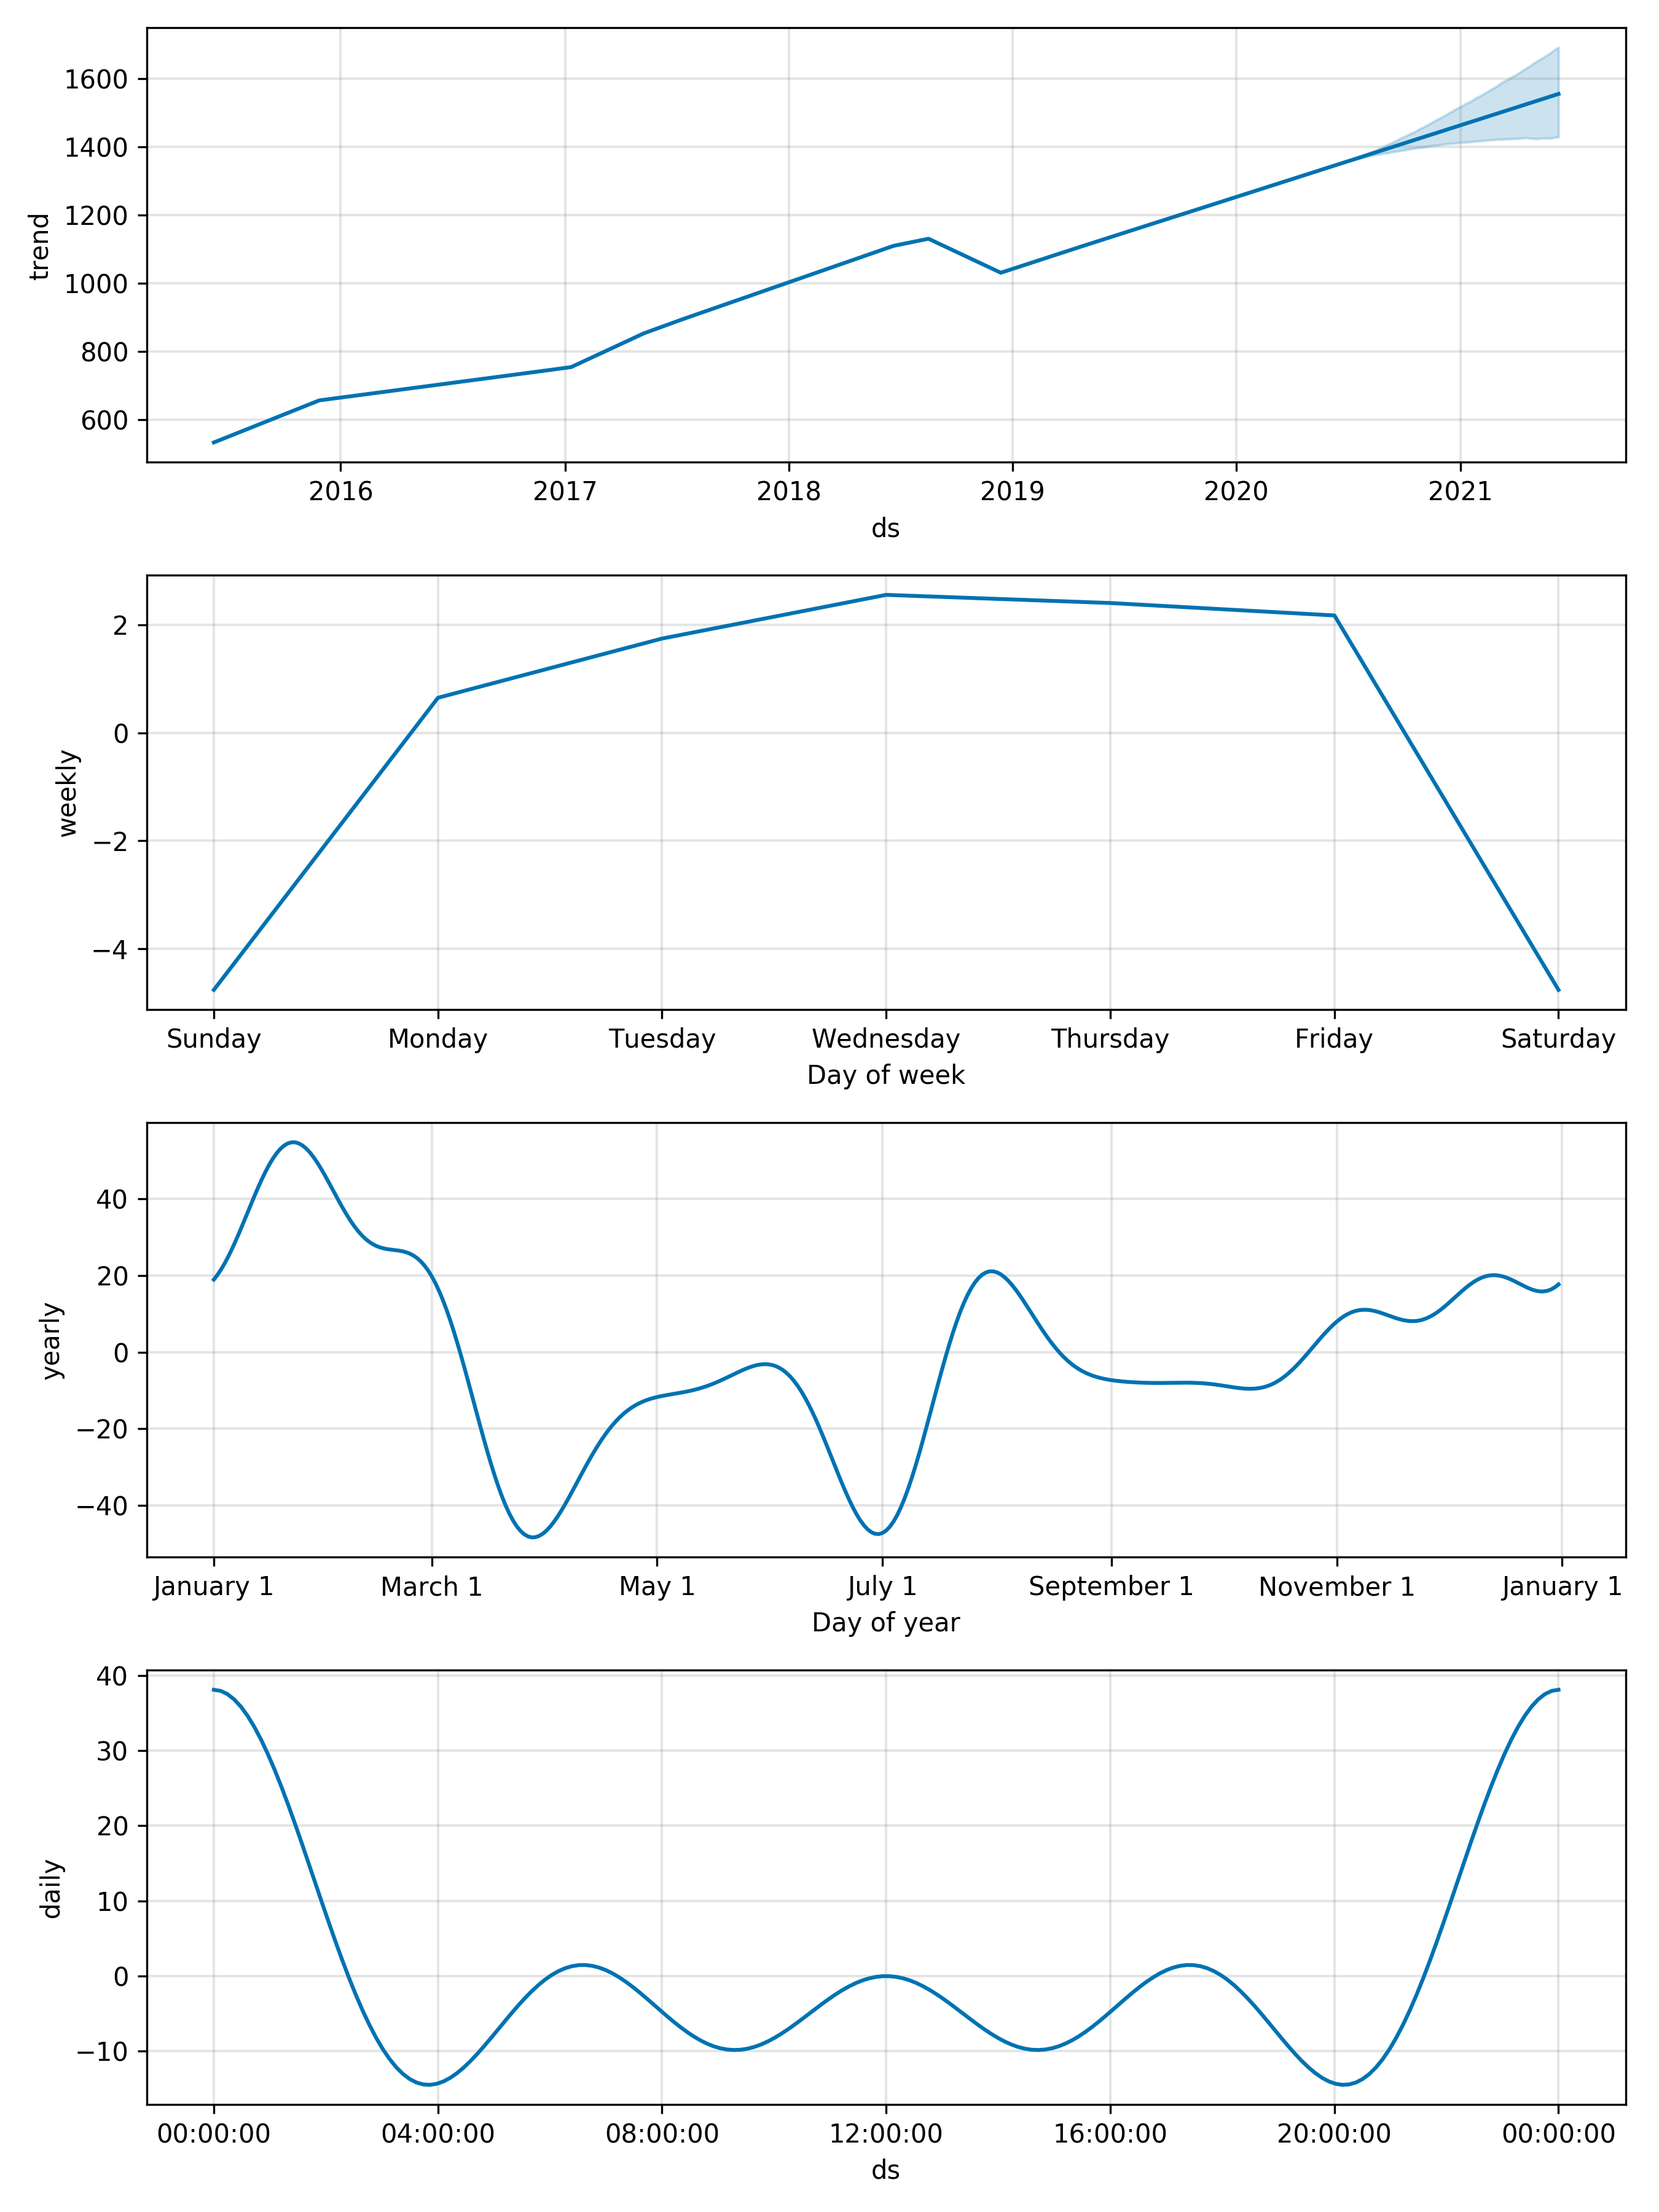
结果 (Results)
Based on the estimated trends, we can see that usually the stock price is maximum in early January (see 3rd subplot) and mostly on Wednesdays (see 2nd subplot). Finally, the 1st subplot shows an increase of the stock price in the near future (between June 2020 and June 2021).
根据估计的趋势,我们可以看到通常股票价格在1 月初达到最高(请参阅第3个子图),而大部分时间是在星期三 (请参见第2个子图)。 最后,第一个子图显示了不久的将来(2020年6月至2021年6月)股价上涨。
That’s all folks ! Hope you liked this article!
那就是所有的人! 希望您喜欢这篇文章!
与我取得联系 (Get in touch with me)
ResearchGate: https://www.researchgate.net/profile/Serafeim_Loukas
ResearchGate : https : //www.researchgate.net/profile/Serafeim_Loukas
EPFL profile: https://people.epfl.ch/serafeim.loukas
EPFL 个人资料 : https : //people.epfl.ch/serafeim.loukas
Stack Overflow: https://stackoverflow.com/users/5025009/seralouk
时间序列模型预测


 1801
1801

 被折叠的 条评论
为什么被折叠?
被折叠的 条评论
为什么被折叠?
 到【灌水乐园】发言


