用MATPLOTLIB设计 (DESIGNING WITH MATPLOTLIB)
We’re back. This is the third part of our articles discussing data visualization using Matplotlib and Jupyter Notebook for beginner, the last part of our plan. If you haven’t read two articles before, here they are
我们回来了。 这是我们的文章的第三部分,为初学者讨论使用Matplotlib和Jupyter Notebook进行数据可视化,这是我们计划的最后一部分。 如果您以前没有看过两篇文章,这里是
Part I
第一部分
Part II
第二部分
In this part, we will guide you in showing three-dimensional plots. Several types of 3D plots are provided by matplotlib. They are 3D points (scatter), lines, contour plots, wireframes, surface, and surface triangulations. We will give you an example of each type.
在这一部分中,我们将指导您显示三维图。 matplotlib提供了几种类型的3D图。 它们是3D点(散点图),线,轮廓图,线框,表面和表面三角剖分。 我们将为您提供每种类型的示例。
1. 3D Points Plot
1. 3D点图
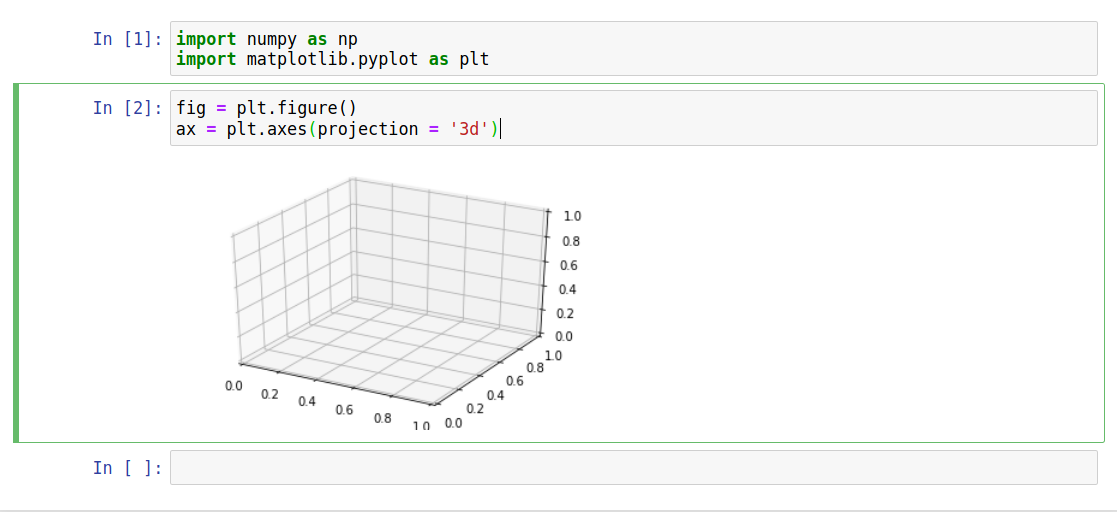
As mentioned in two parts before, firstly, we need to import and define a container for our plot. Besides 3D plots, we need to create a 3D container using the following code
如前两部分所述,首先,我们需要为绘图导入并定义一个容器。 除了3D图外,我们还需要使用以下代码创建3D容器
fig = plt.figure()
ax = plt.axes(projection = '3d')
If you run it, you can a result like this
如果运行它,可能会得到如下结果
The next step is creating data point in the 3D axis, using this code
下一步是使用此代码在3D轴上创建数据点
xdata = 7 * np.random.random(100)
ydata = np.sin(xdata) + 0.25 * np.random.random(100)
zdata = np.cos(xdata) + 0.25 * np.random.random(100)
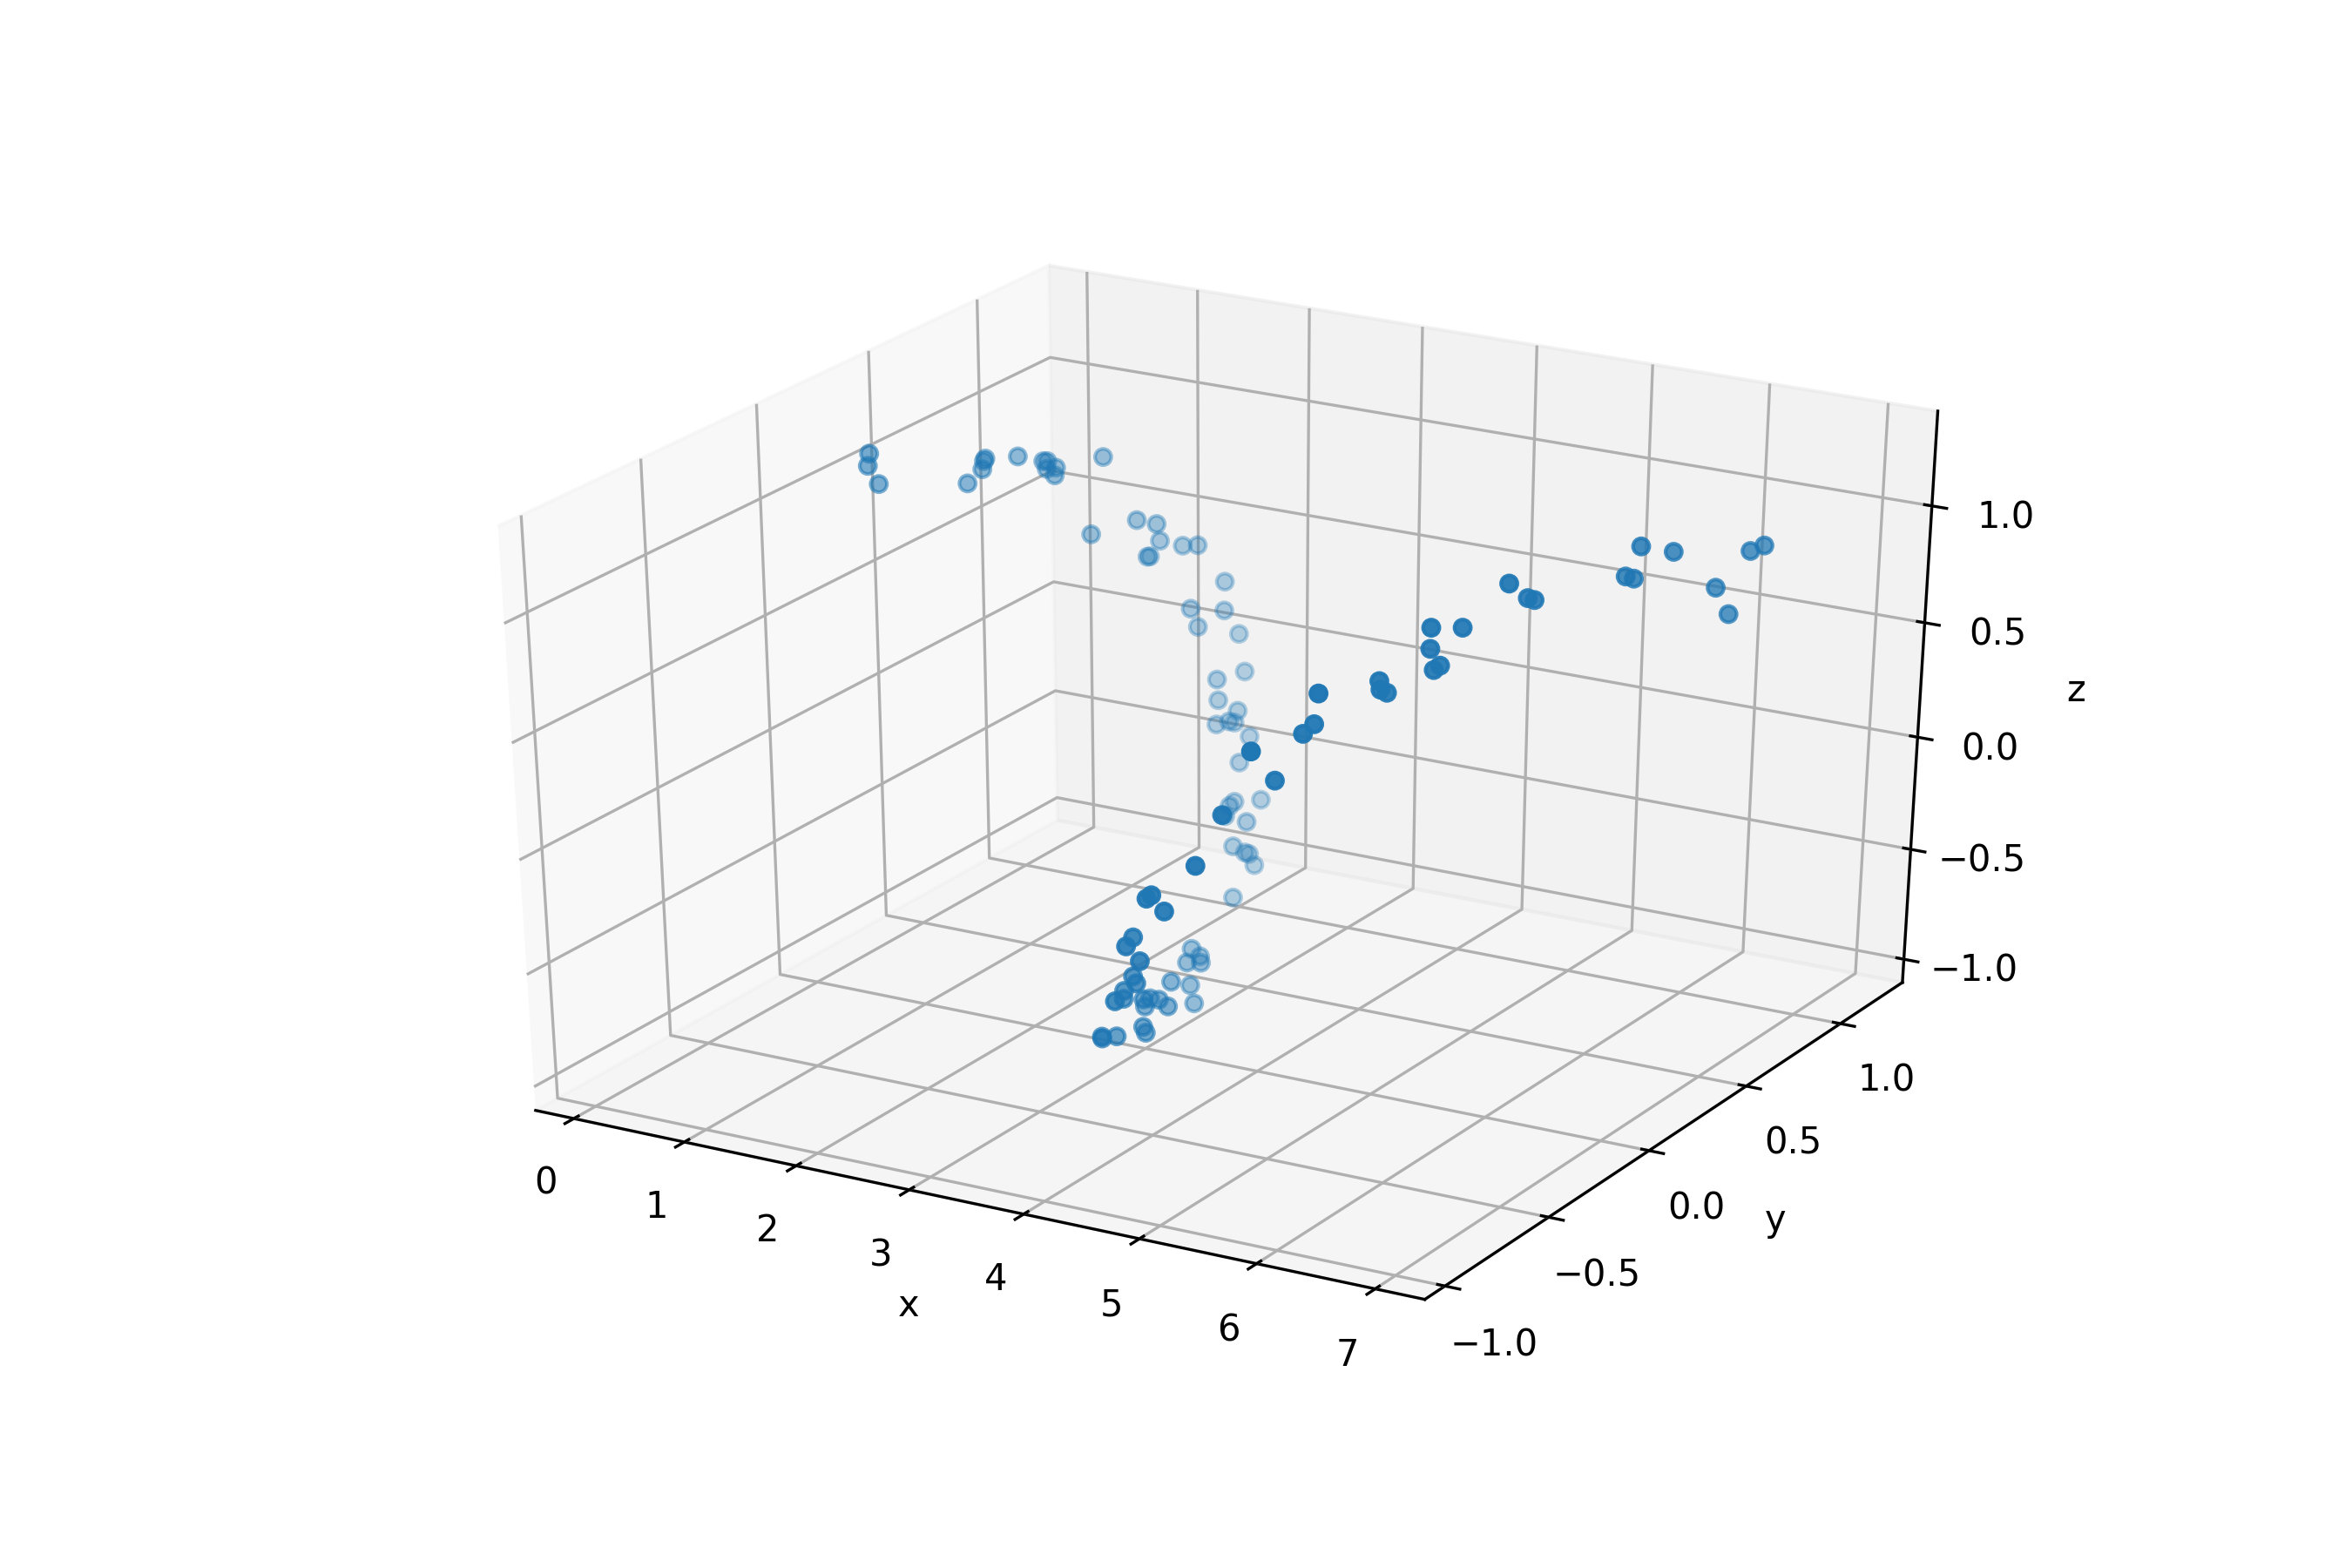
We create 100 random data points using np.random.random(100). After that, you can use the following code to visualize 3D scatter
我们使用np.random.random(100)创建100个随机数据点。 之后,您可以使用以下代码可视化3D散射
fig = plt.figure(figsize=(9, 6))#3d container
ax = plt.axes(projection = '3d')#3d scatter plot
ax.scatter3D(xdata, ydata, zdata)#give labels
ax.set_xlabel('x')
ax.set_ylabel('y')
ax.set_zlabel('z')#save figure
plt.savefig('3d_scatter.png', dpi = 300);
It will give you a result like this
它会给你这样的结果
2. 3D Line Plot
2. 3D线图
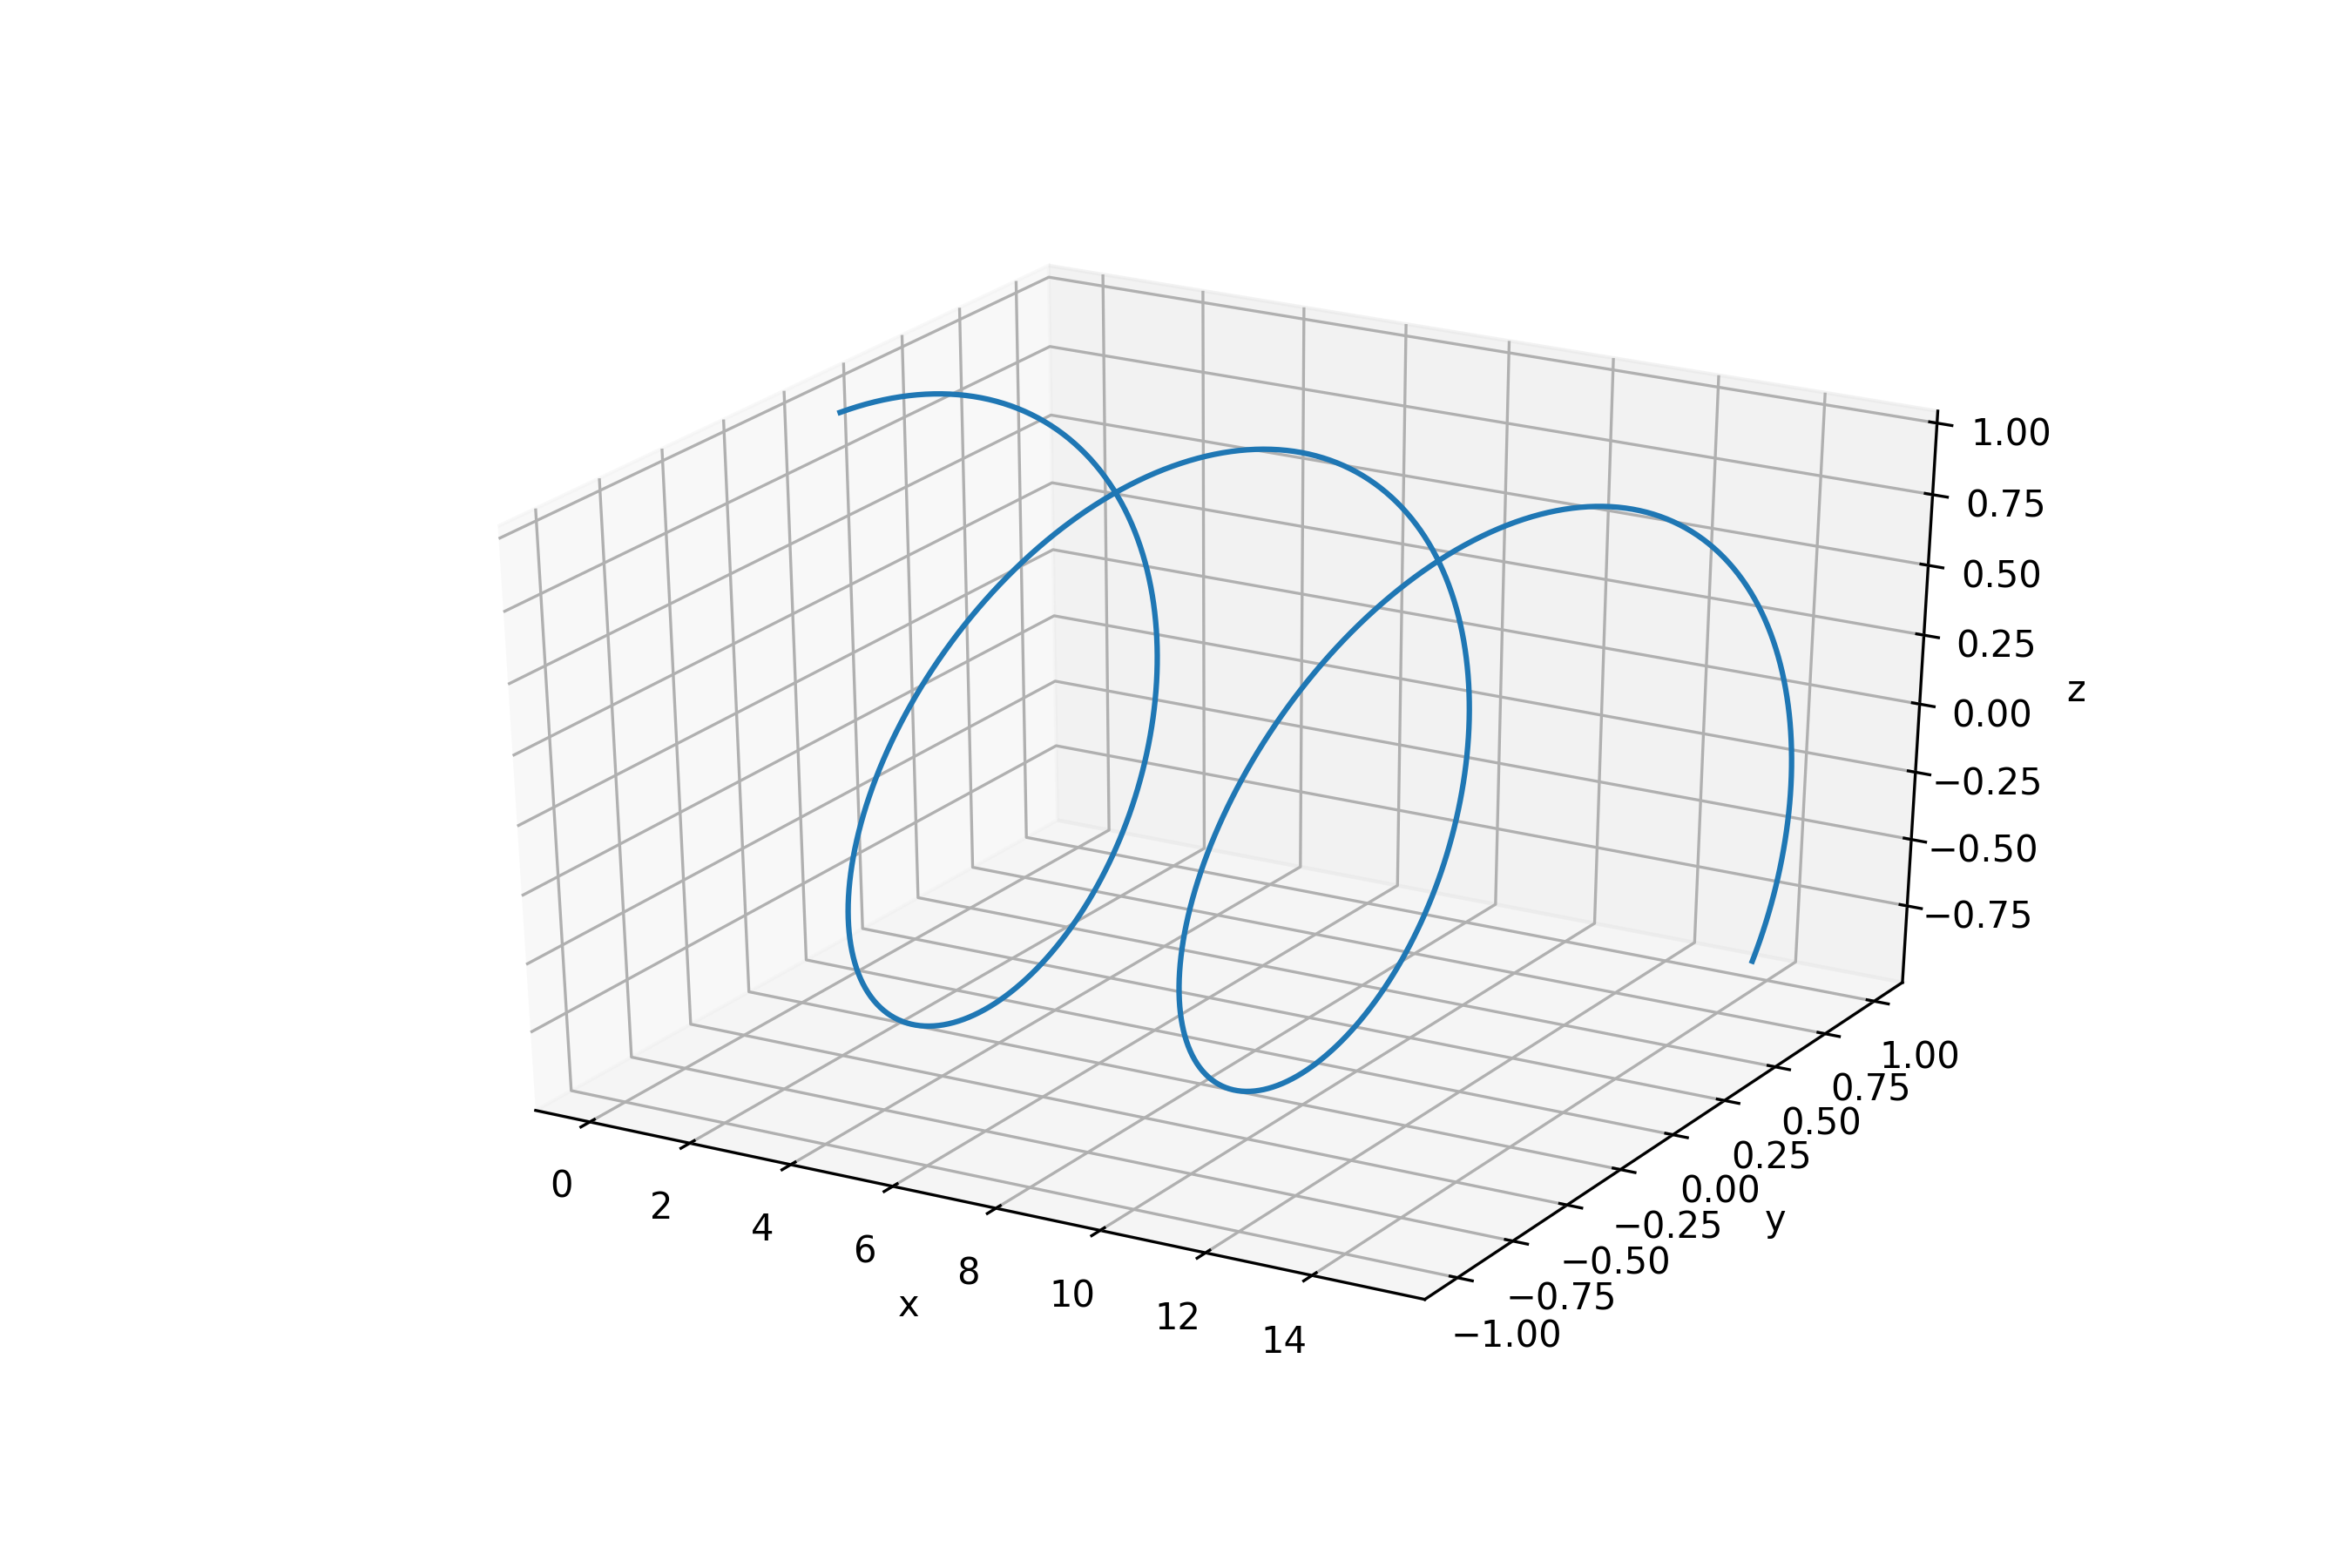
The visualization of 3D line plots is almost the same as the previous one. You can check the different part between 3D line plots with 3D point plots in the following code
3D线图的可视化与上一个几乎相同。 您可以在以下代码中检查3D线图与3D点图之间的不同部分
fig = plt.figure(figsize=(9, 6))#create data for 3d line
xline = np.linspace(0, 15, 1000)
yline = np.sin(xline)
zline = np.cos(xline)#3d container
ax = plt.axes(projection = '3d')#3d scatter plot
ax.plot3D(xline, yline, zline)#give labels
ax.set_xlabel('x')
ax.set_ylabel('y')
ax.set_zlabel('z')#save figure
plt.savefig('3d_plot.png', dpi = 300);
The code will show a plot like this
该代码将显示这样的情节
3. 3D Contour Plot
3. 3D轮廓图
To visualize the contour plot, we need to create a grid for data in x and y-axis, if z is a result of x and y. To create a grid, we can use mesh grid code in NumPy. Here is the code to generate the data point and its grid.
为了可视化等高线图,如果z是x和y的结果,我们需要为x和y轴上的数据创建一个网格。 要创建网格,我们可以在NumPy中使用网格网格代码。 这是生成数据点及其网格的代码。
# create data points
x = np.linspace(-10, 10, 100)
y = np.linspace(-15, 15, 100)# create grid
X, Y = np.meshgrid(x, y)Z = np.sin(X) + np.cos(Y)# create figure container
fig = plt.figure(figsize=(9, 6))
ax = plt.axes(projection = '3d')# 3d contour plot
ax.contour3D(X, Y, Z, 100, cmap = 'viridis')# set labels
ax.set_xlabel('x')
ax.set_ylabel('y')
ax.set_zlabel('z')# save figure
plt.savefig('3d_contour.png', dpi = 300)
The code will show you this figure
该代码将向您显示此图
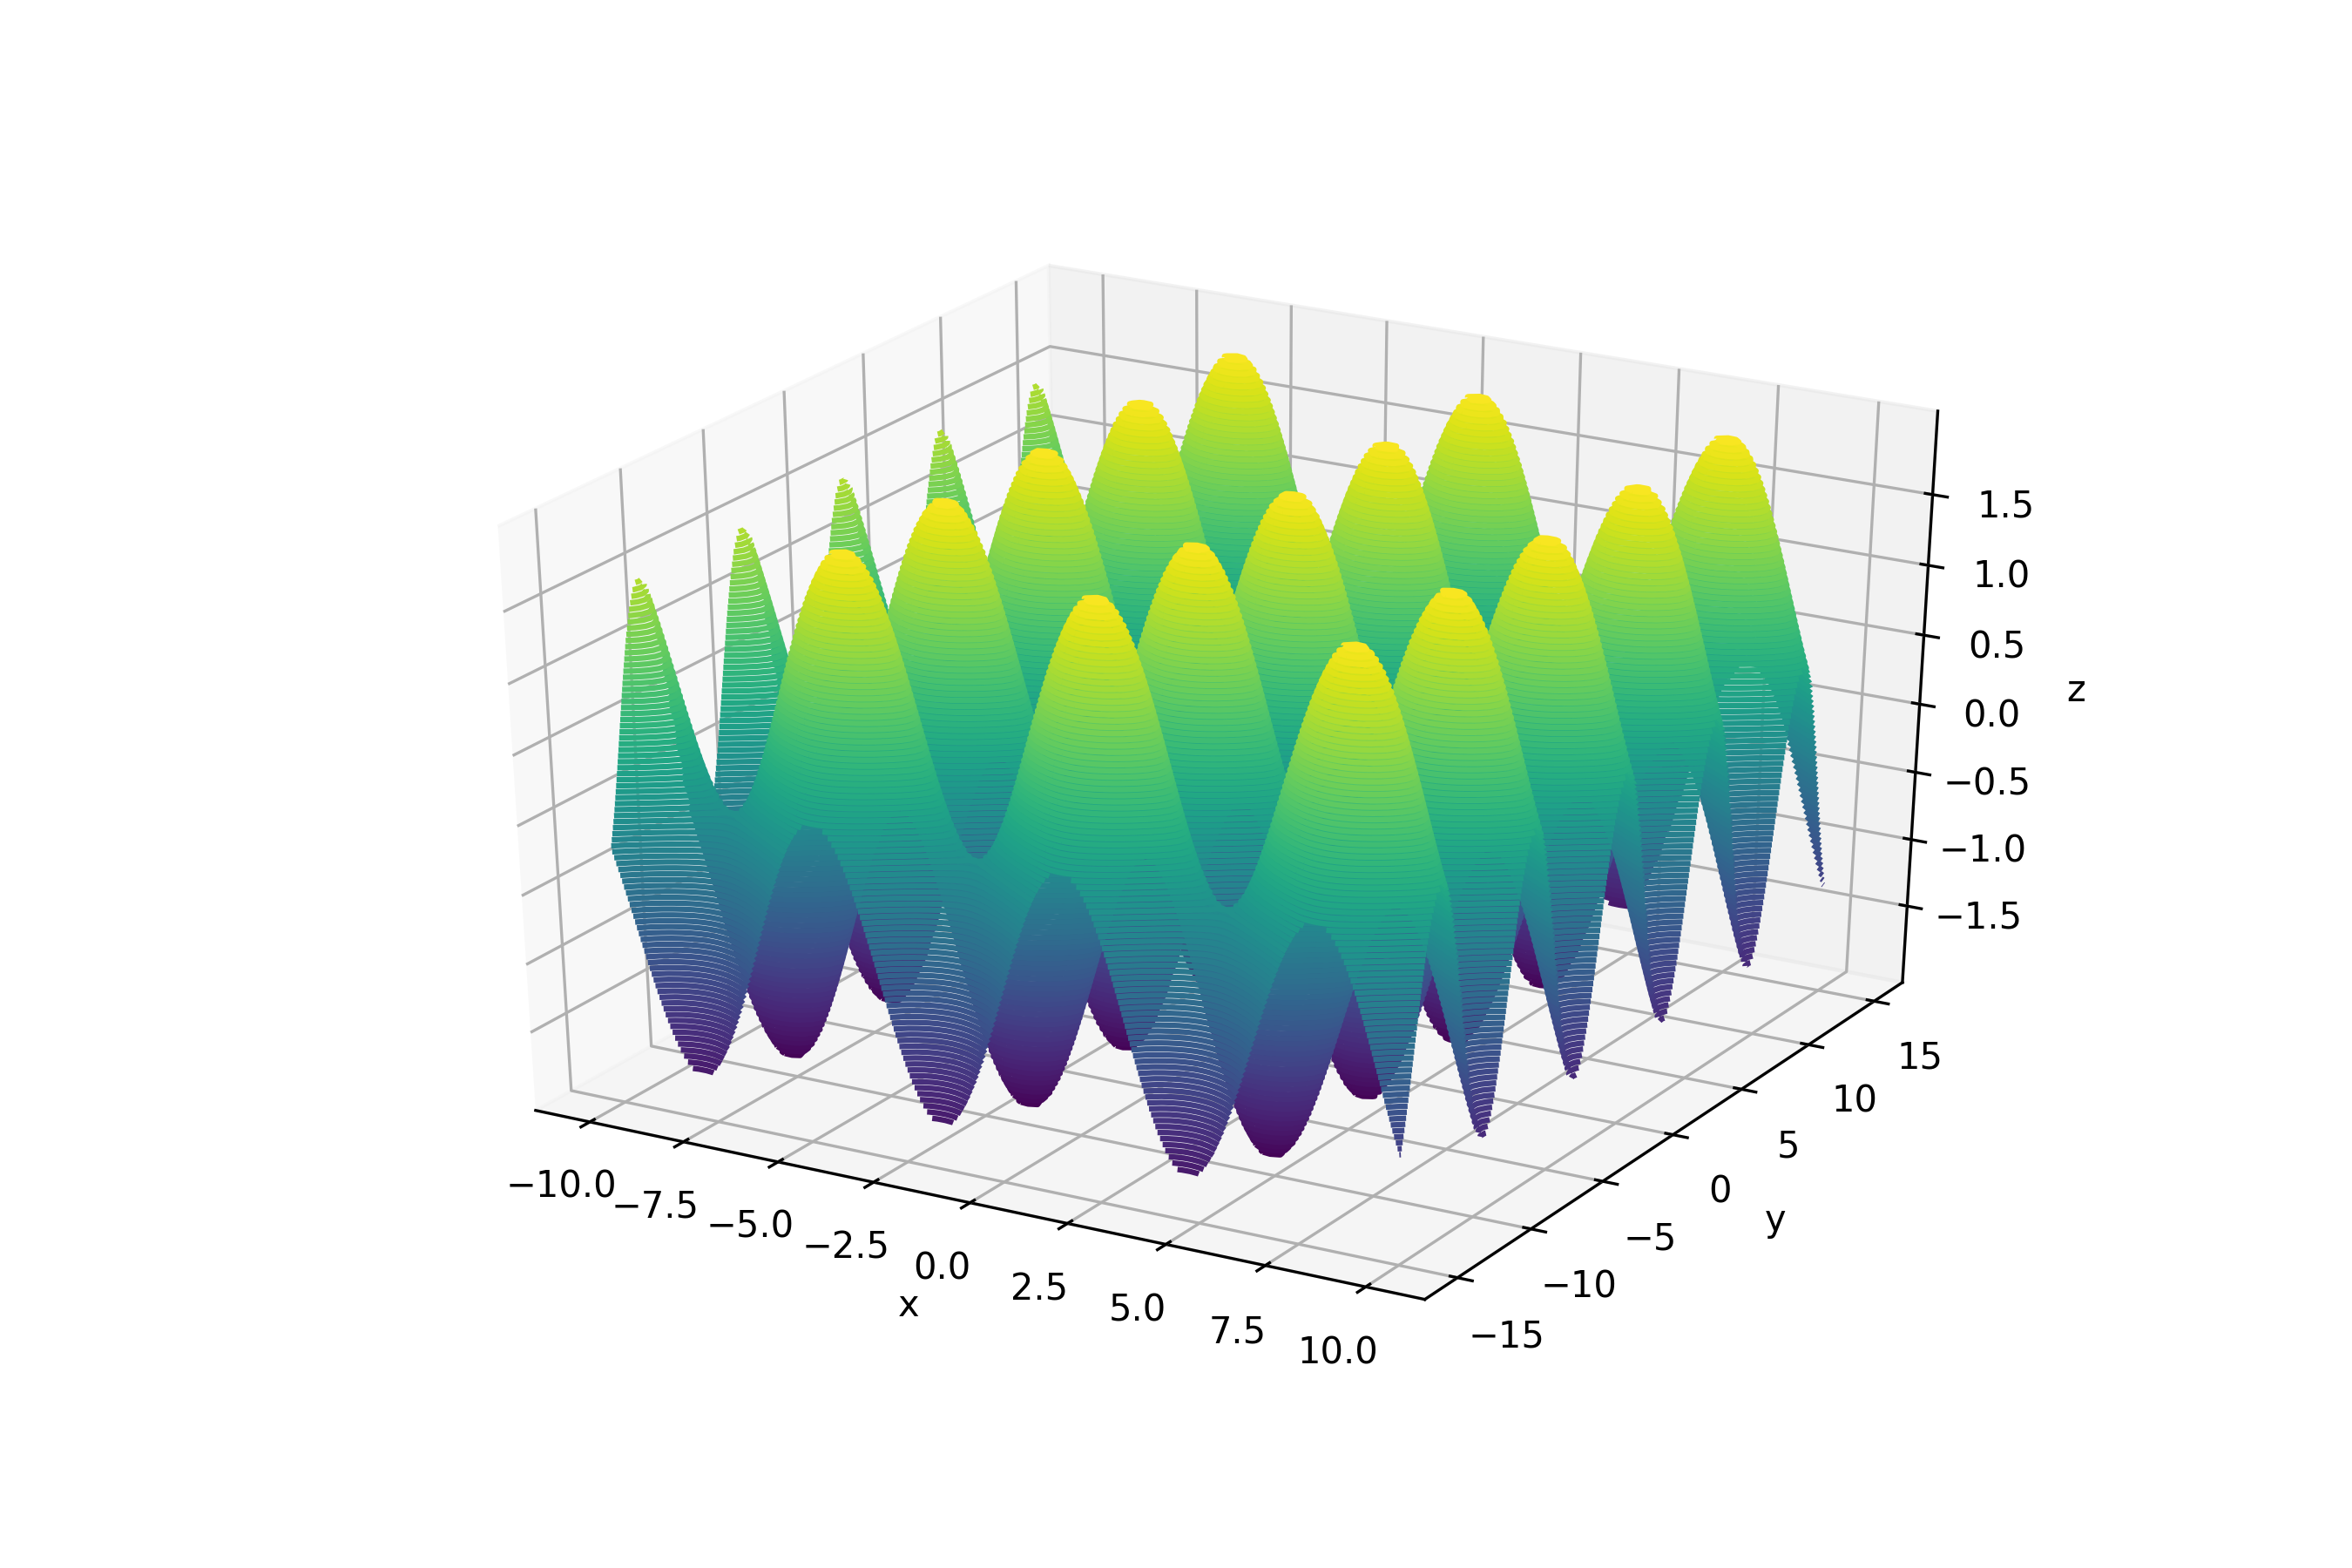
The code ax.contour3D() needs some of the arguments. They are data in x, y, z-axis, the number of contours, and the colormaps. The grid we created consists of 100 x 100 data points in the x and y-axis. In the x-axis, there are 100 points from -10 to 10 and from -15 to 15 on the y-axis. The number of data in the z-axis is 10,000 because Z is in a function of X and Y.
代码ax.contour3D()需要一些参数。 它们是x,y,z轴,等高线数和色图的数据。 我们创建的网格在x和y轴上包含100 x 100数据点。 在x轴上,y轴上有从-10到10和从-15到15的100个点。 由于Z是X和Y的函数,因此z轴上的数据数为10,000。
In the figure above, we use 100 different contours. Try to compare it with the following figure, which uses 50 different contours.
在上图中,我们使用100个不同的轮廓。 尝试将其与使用50个不同轮廓的下图进行比较。
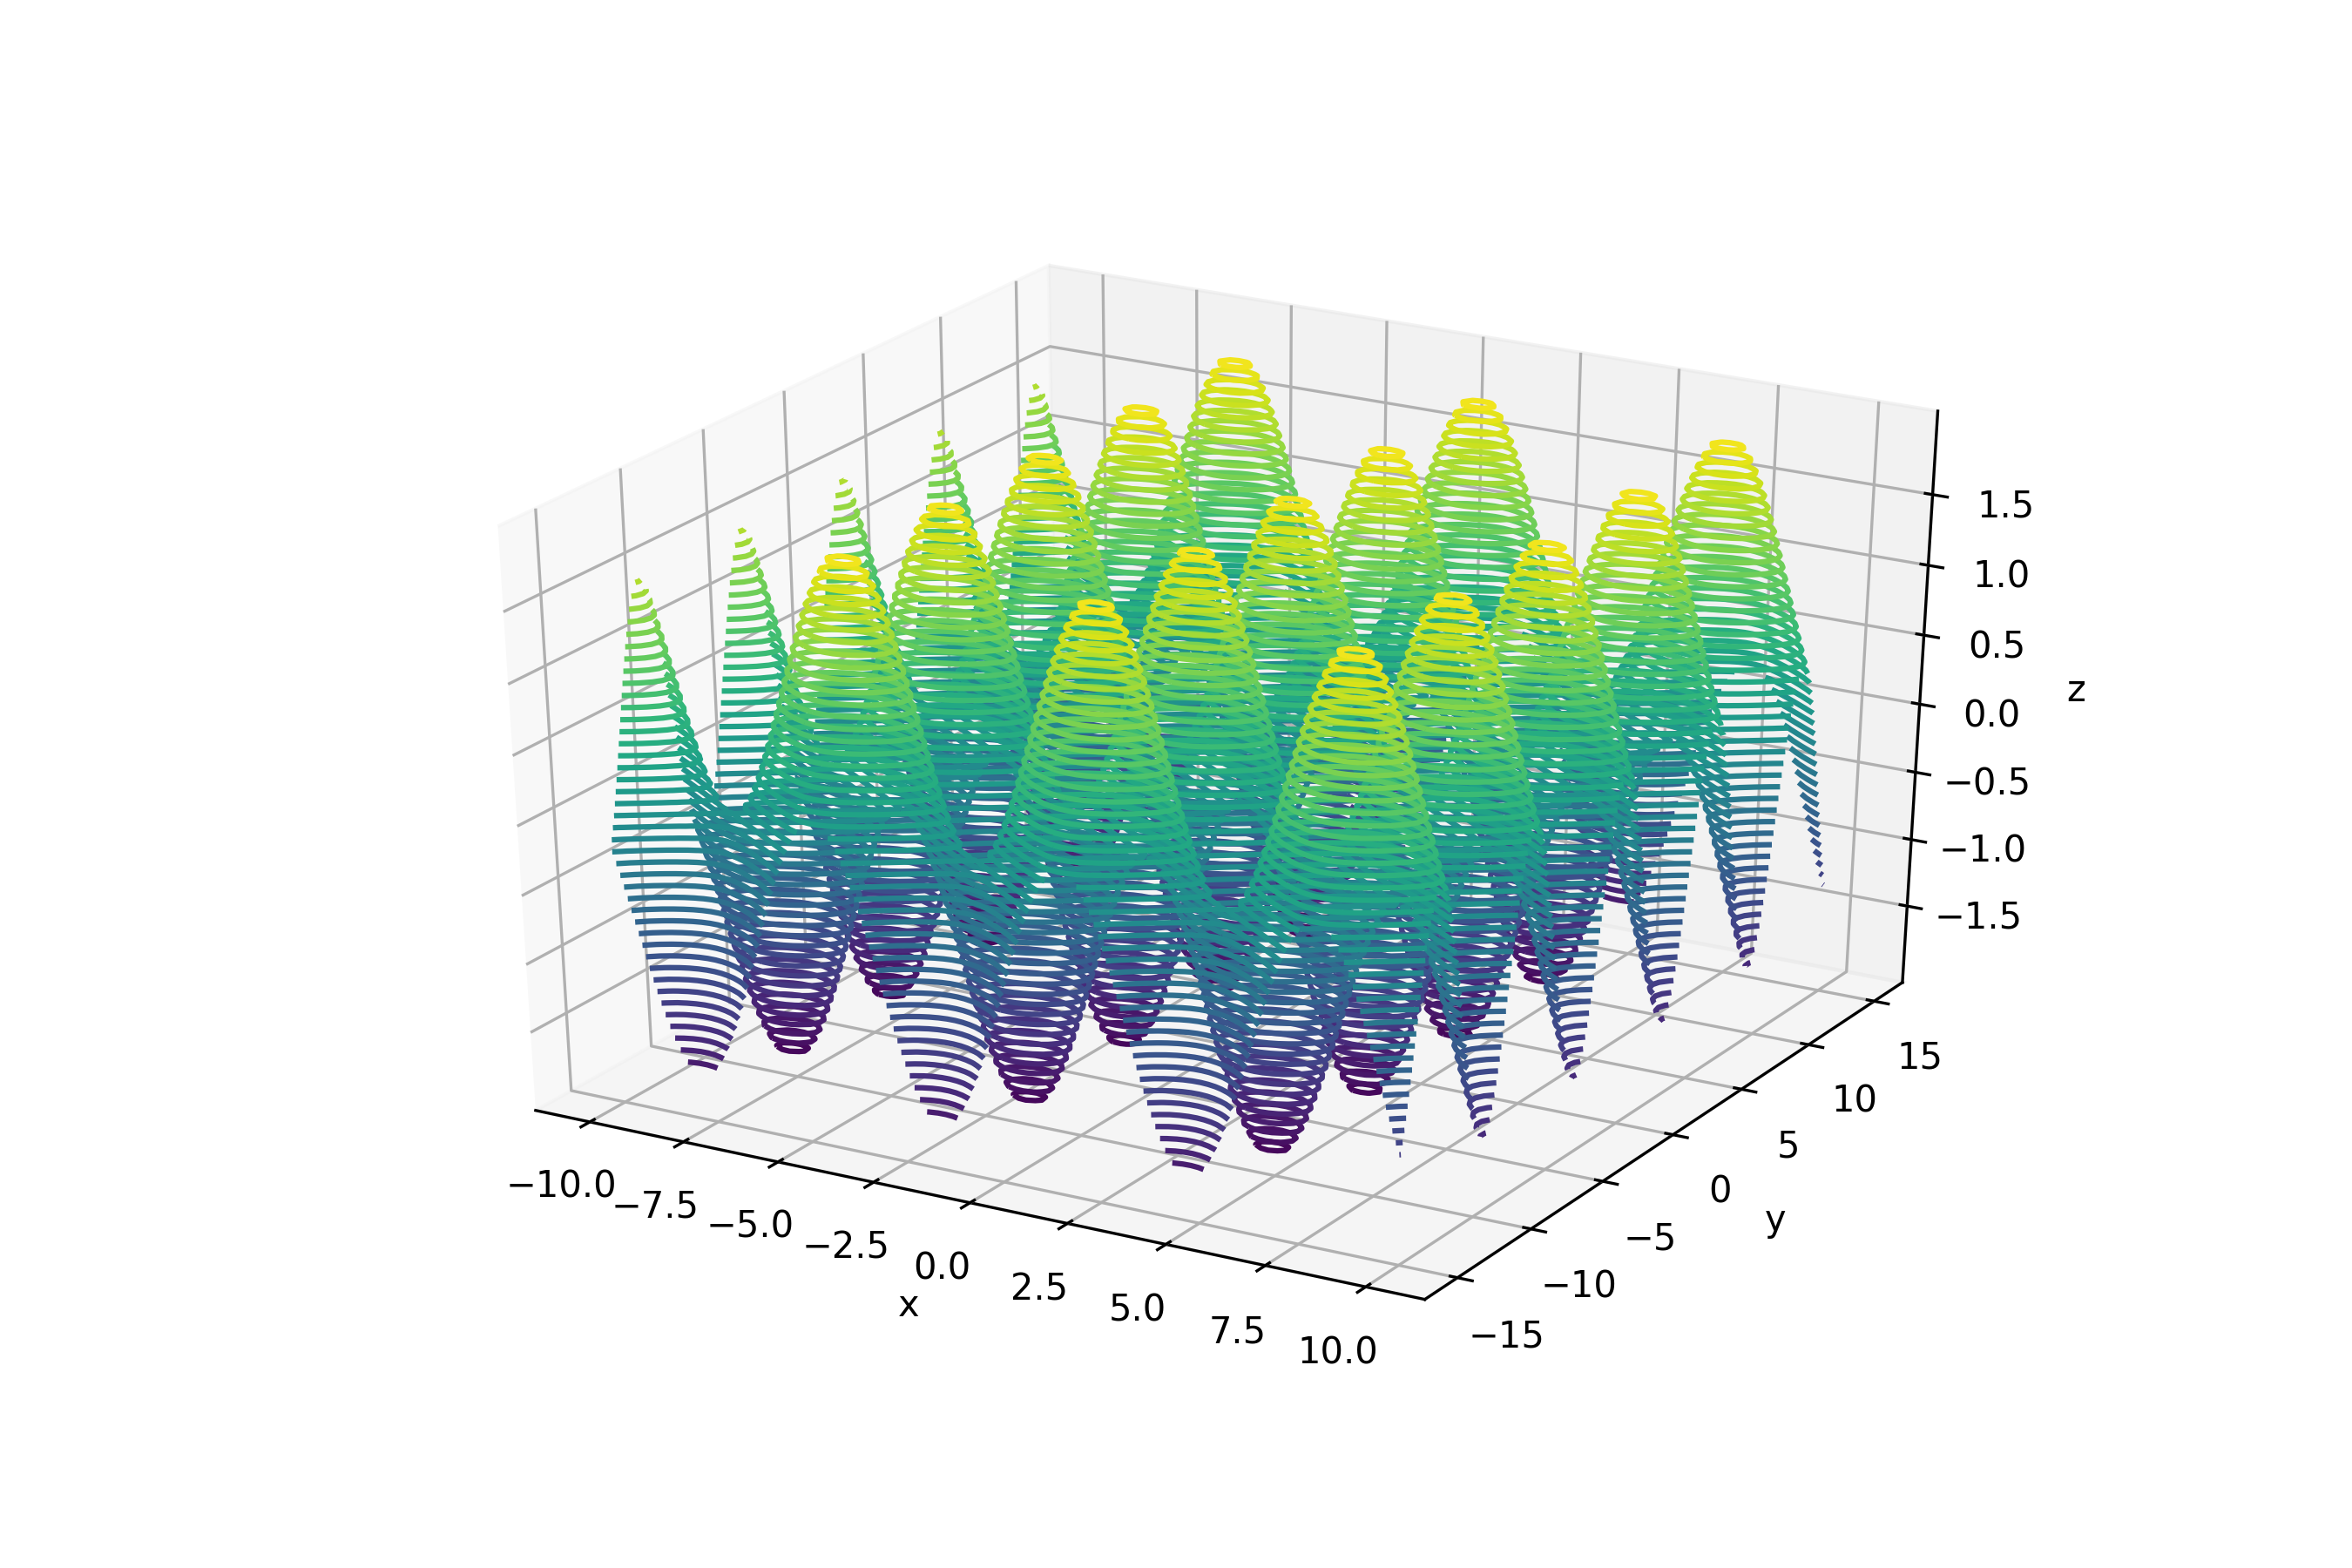
You can also use different colormaps like this use ‘inferno’ colormaps.
您也可以使用不同的颜色图,例如使用“地狱”颜色图。
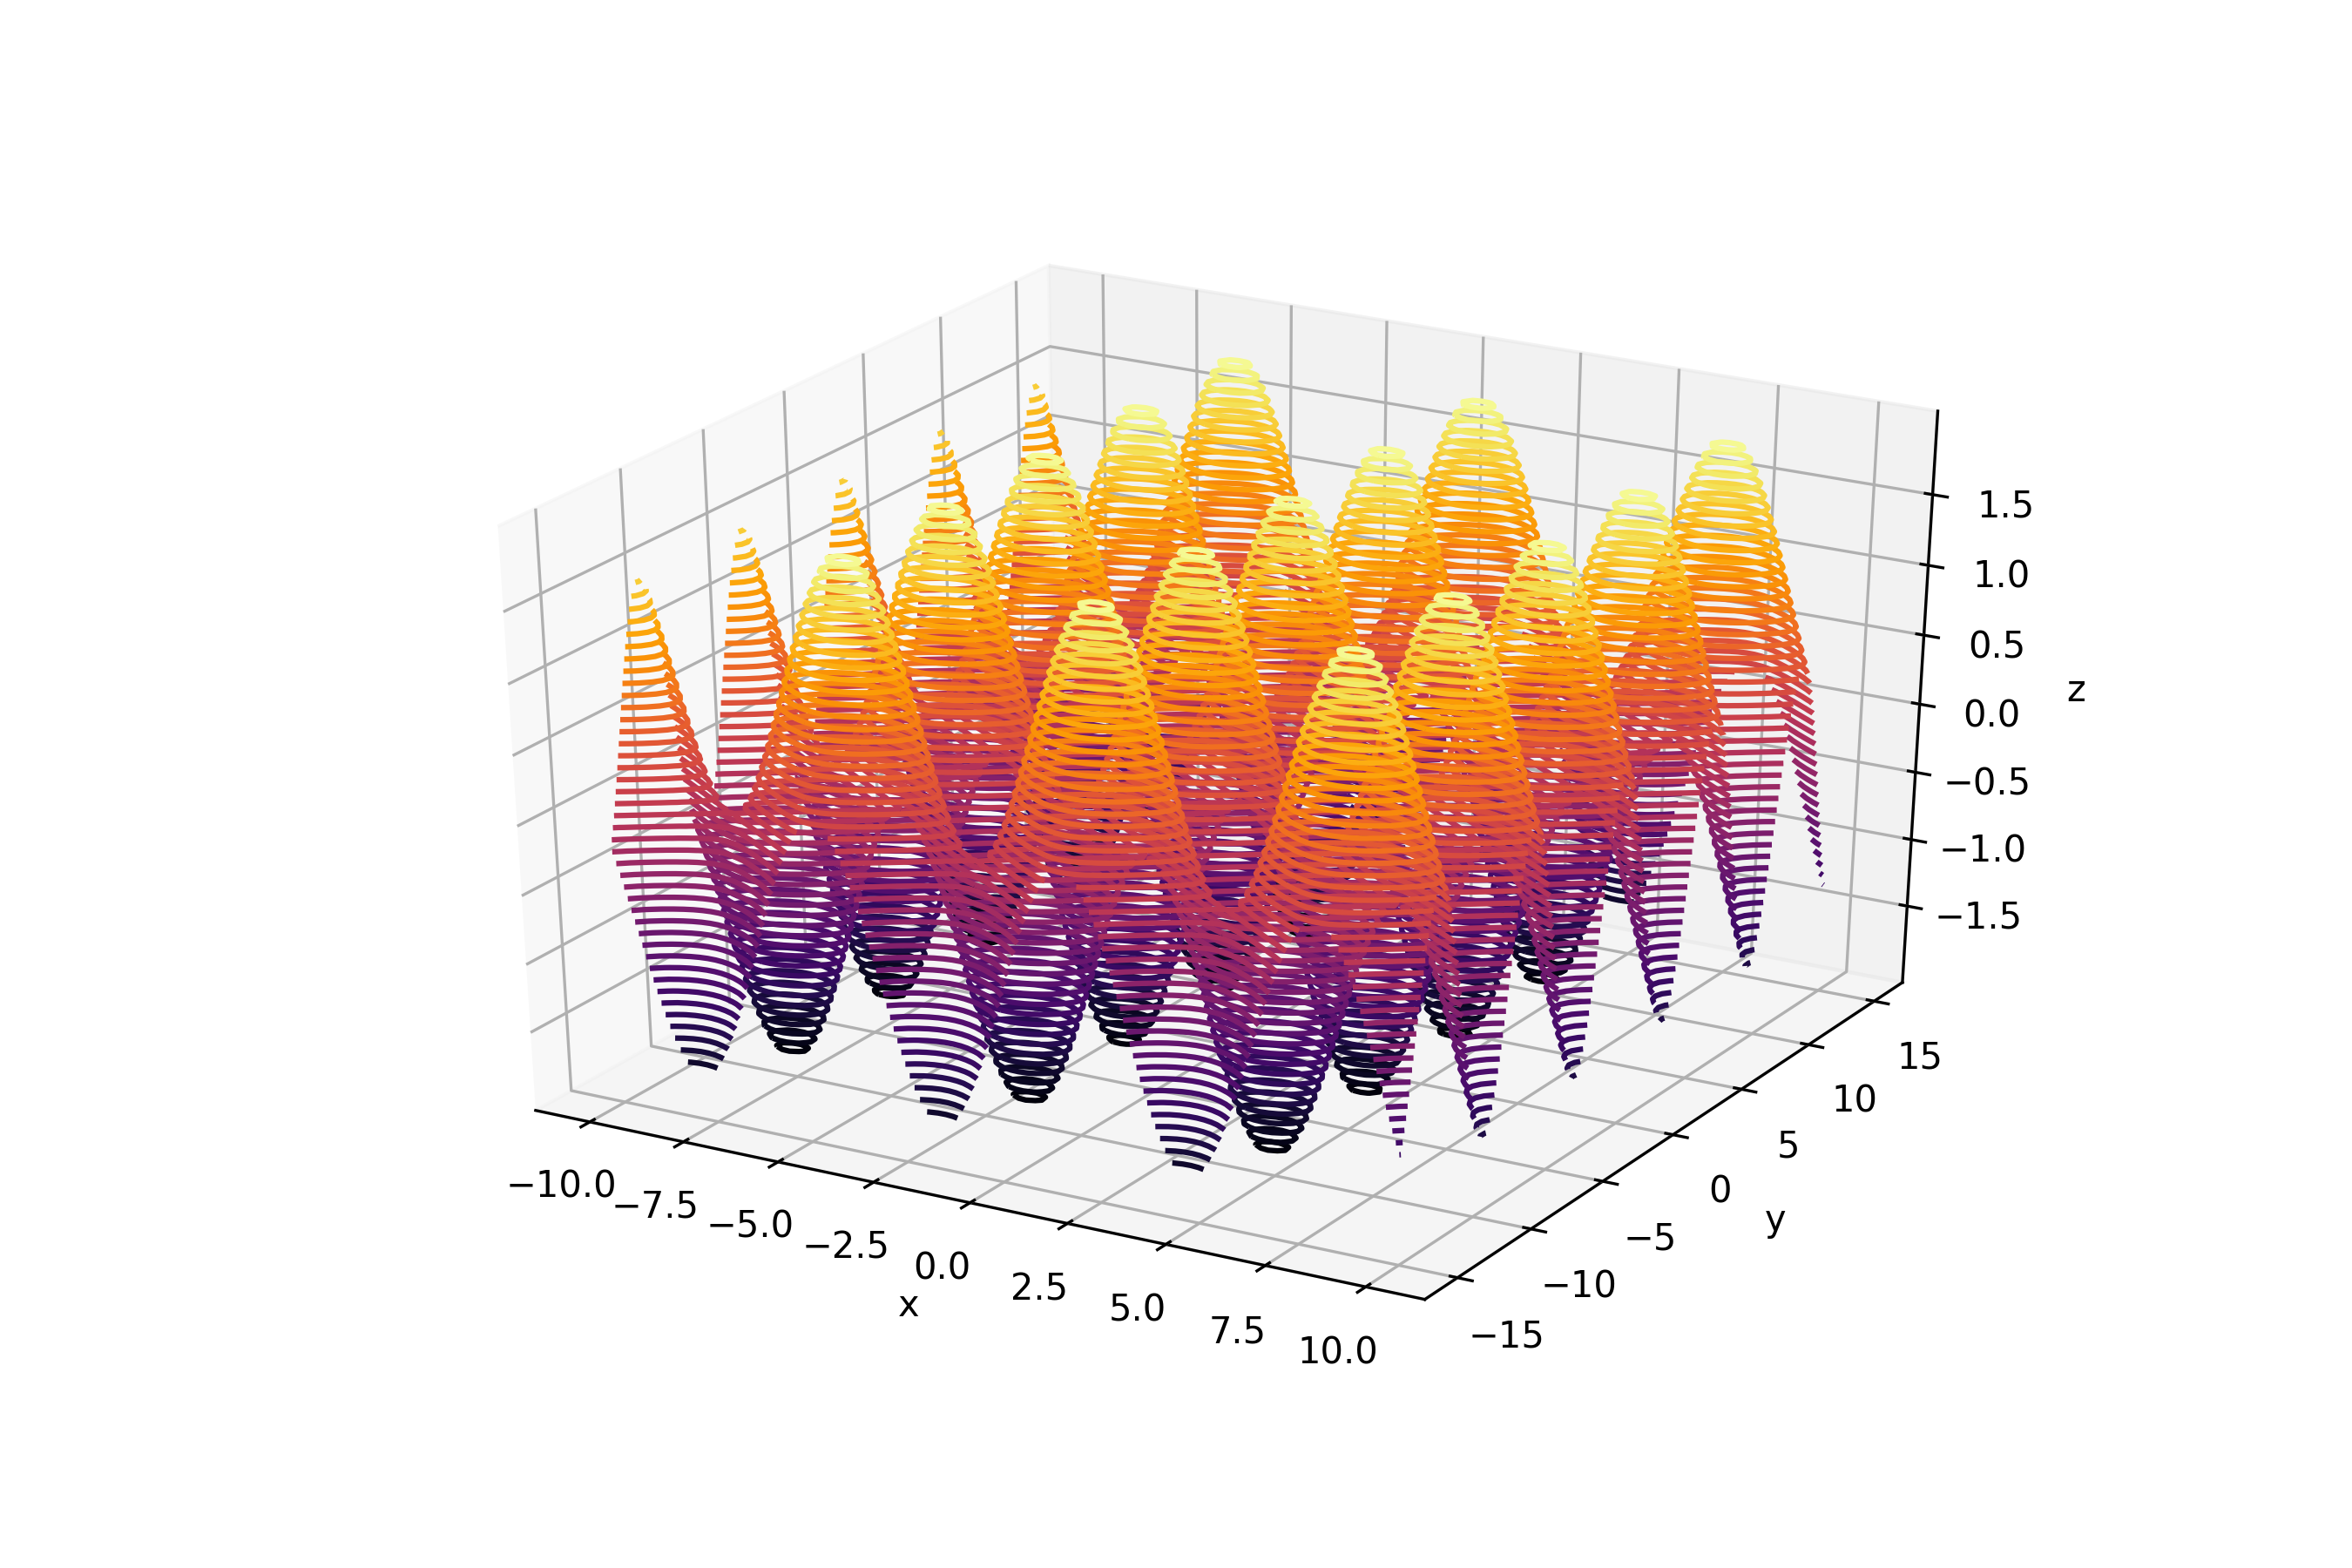
You can visit matplotlib websites to check colormaps you can use
您可以访问matplotlib网站检查可以使用的颜色图
4. 3D Wireframe Plot
4. 3D线框图
The idea of creating wireframe plots is the same as the contour plot. Here we present the code to create it.
创建线框图的想法与轮廓图相同。 在这里,我们介绍创建代码。
# create data points
x = np.linspace(-10, 10, 100)
y = np.linspace(-15, 15, 100)# create grid
X, Y = np.meshgrid(x, y)Z = np.sin(X) + np.cos(Y)# create figure container
fig = plt.figure(figsize=(9, 6))
ax = plt.axes(projection = '3d')# 3d contour plot
ax.plot_wireframe(X, Y, Z, 2, color = 'black', alpha = .2)# set labels
ax.set_xlabel('x')
ax.set_ylabel('y')
ax.set_zlabel('z')# save figure
plt.savefig('3d_wireframe.png', dpi = 300)
You will see a figure like this
您会看到这样的身影
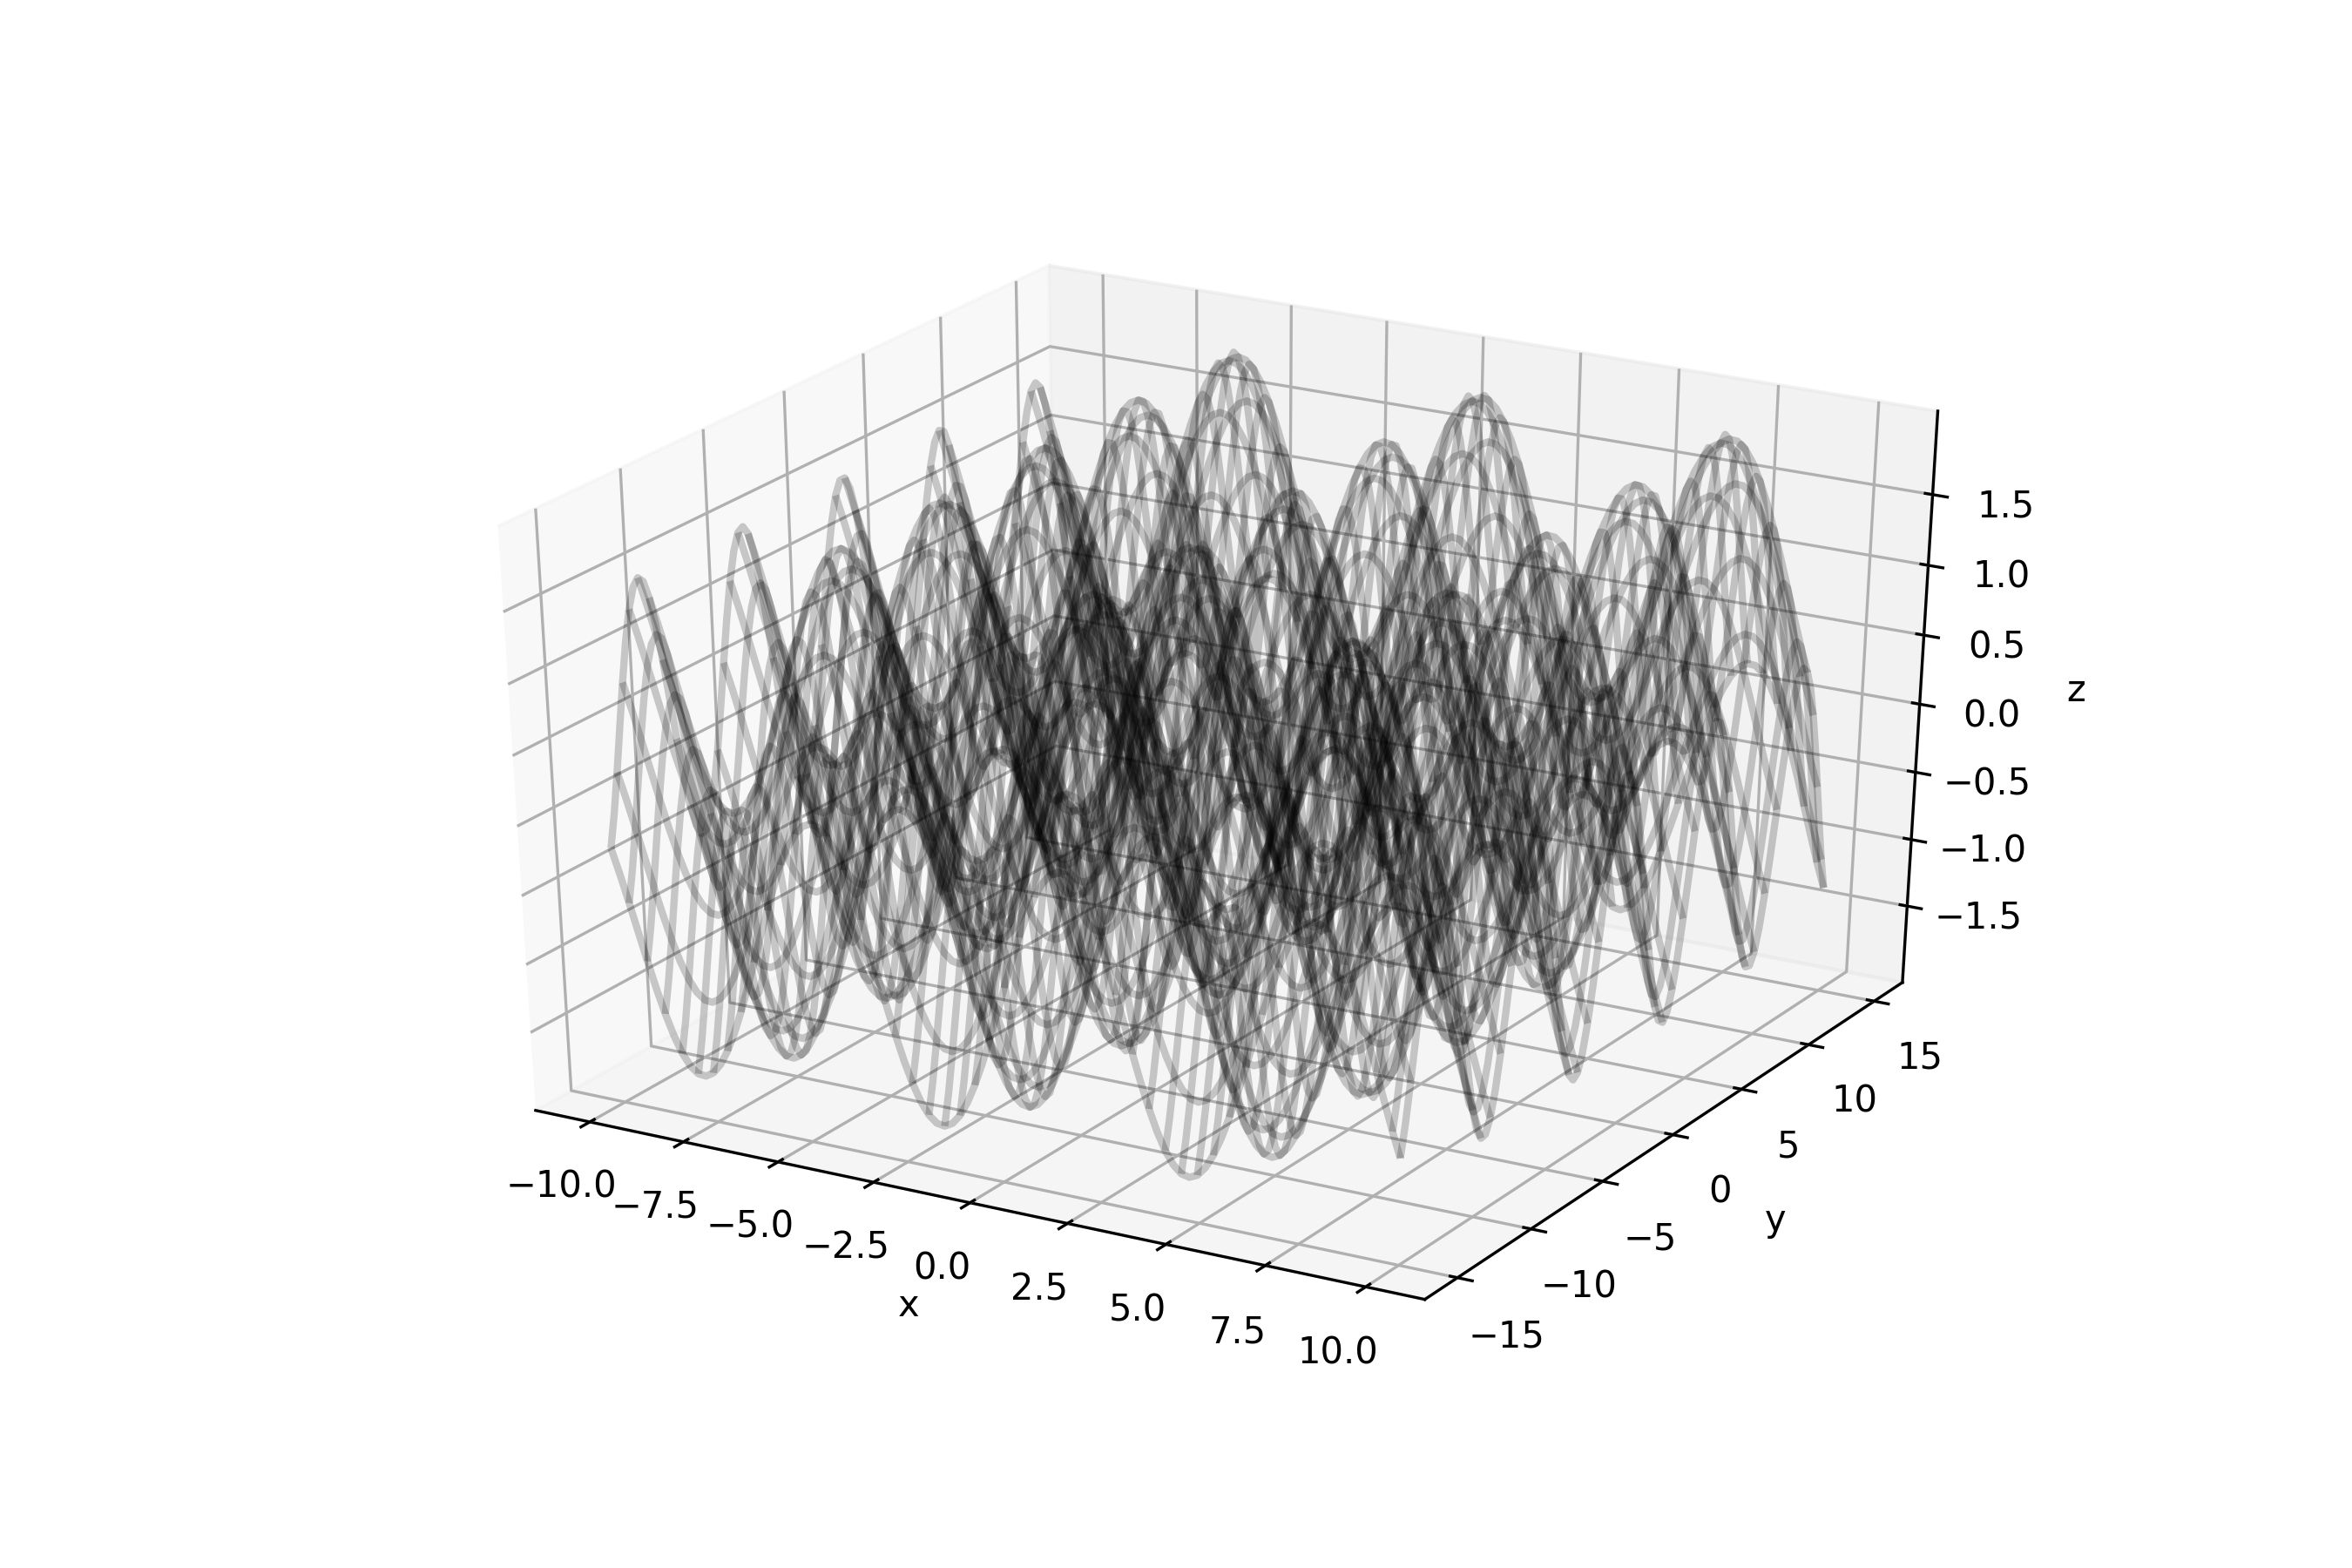
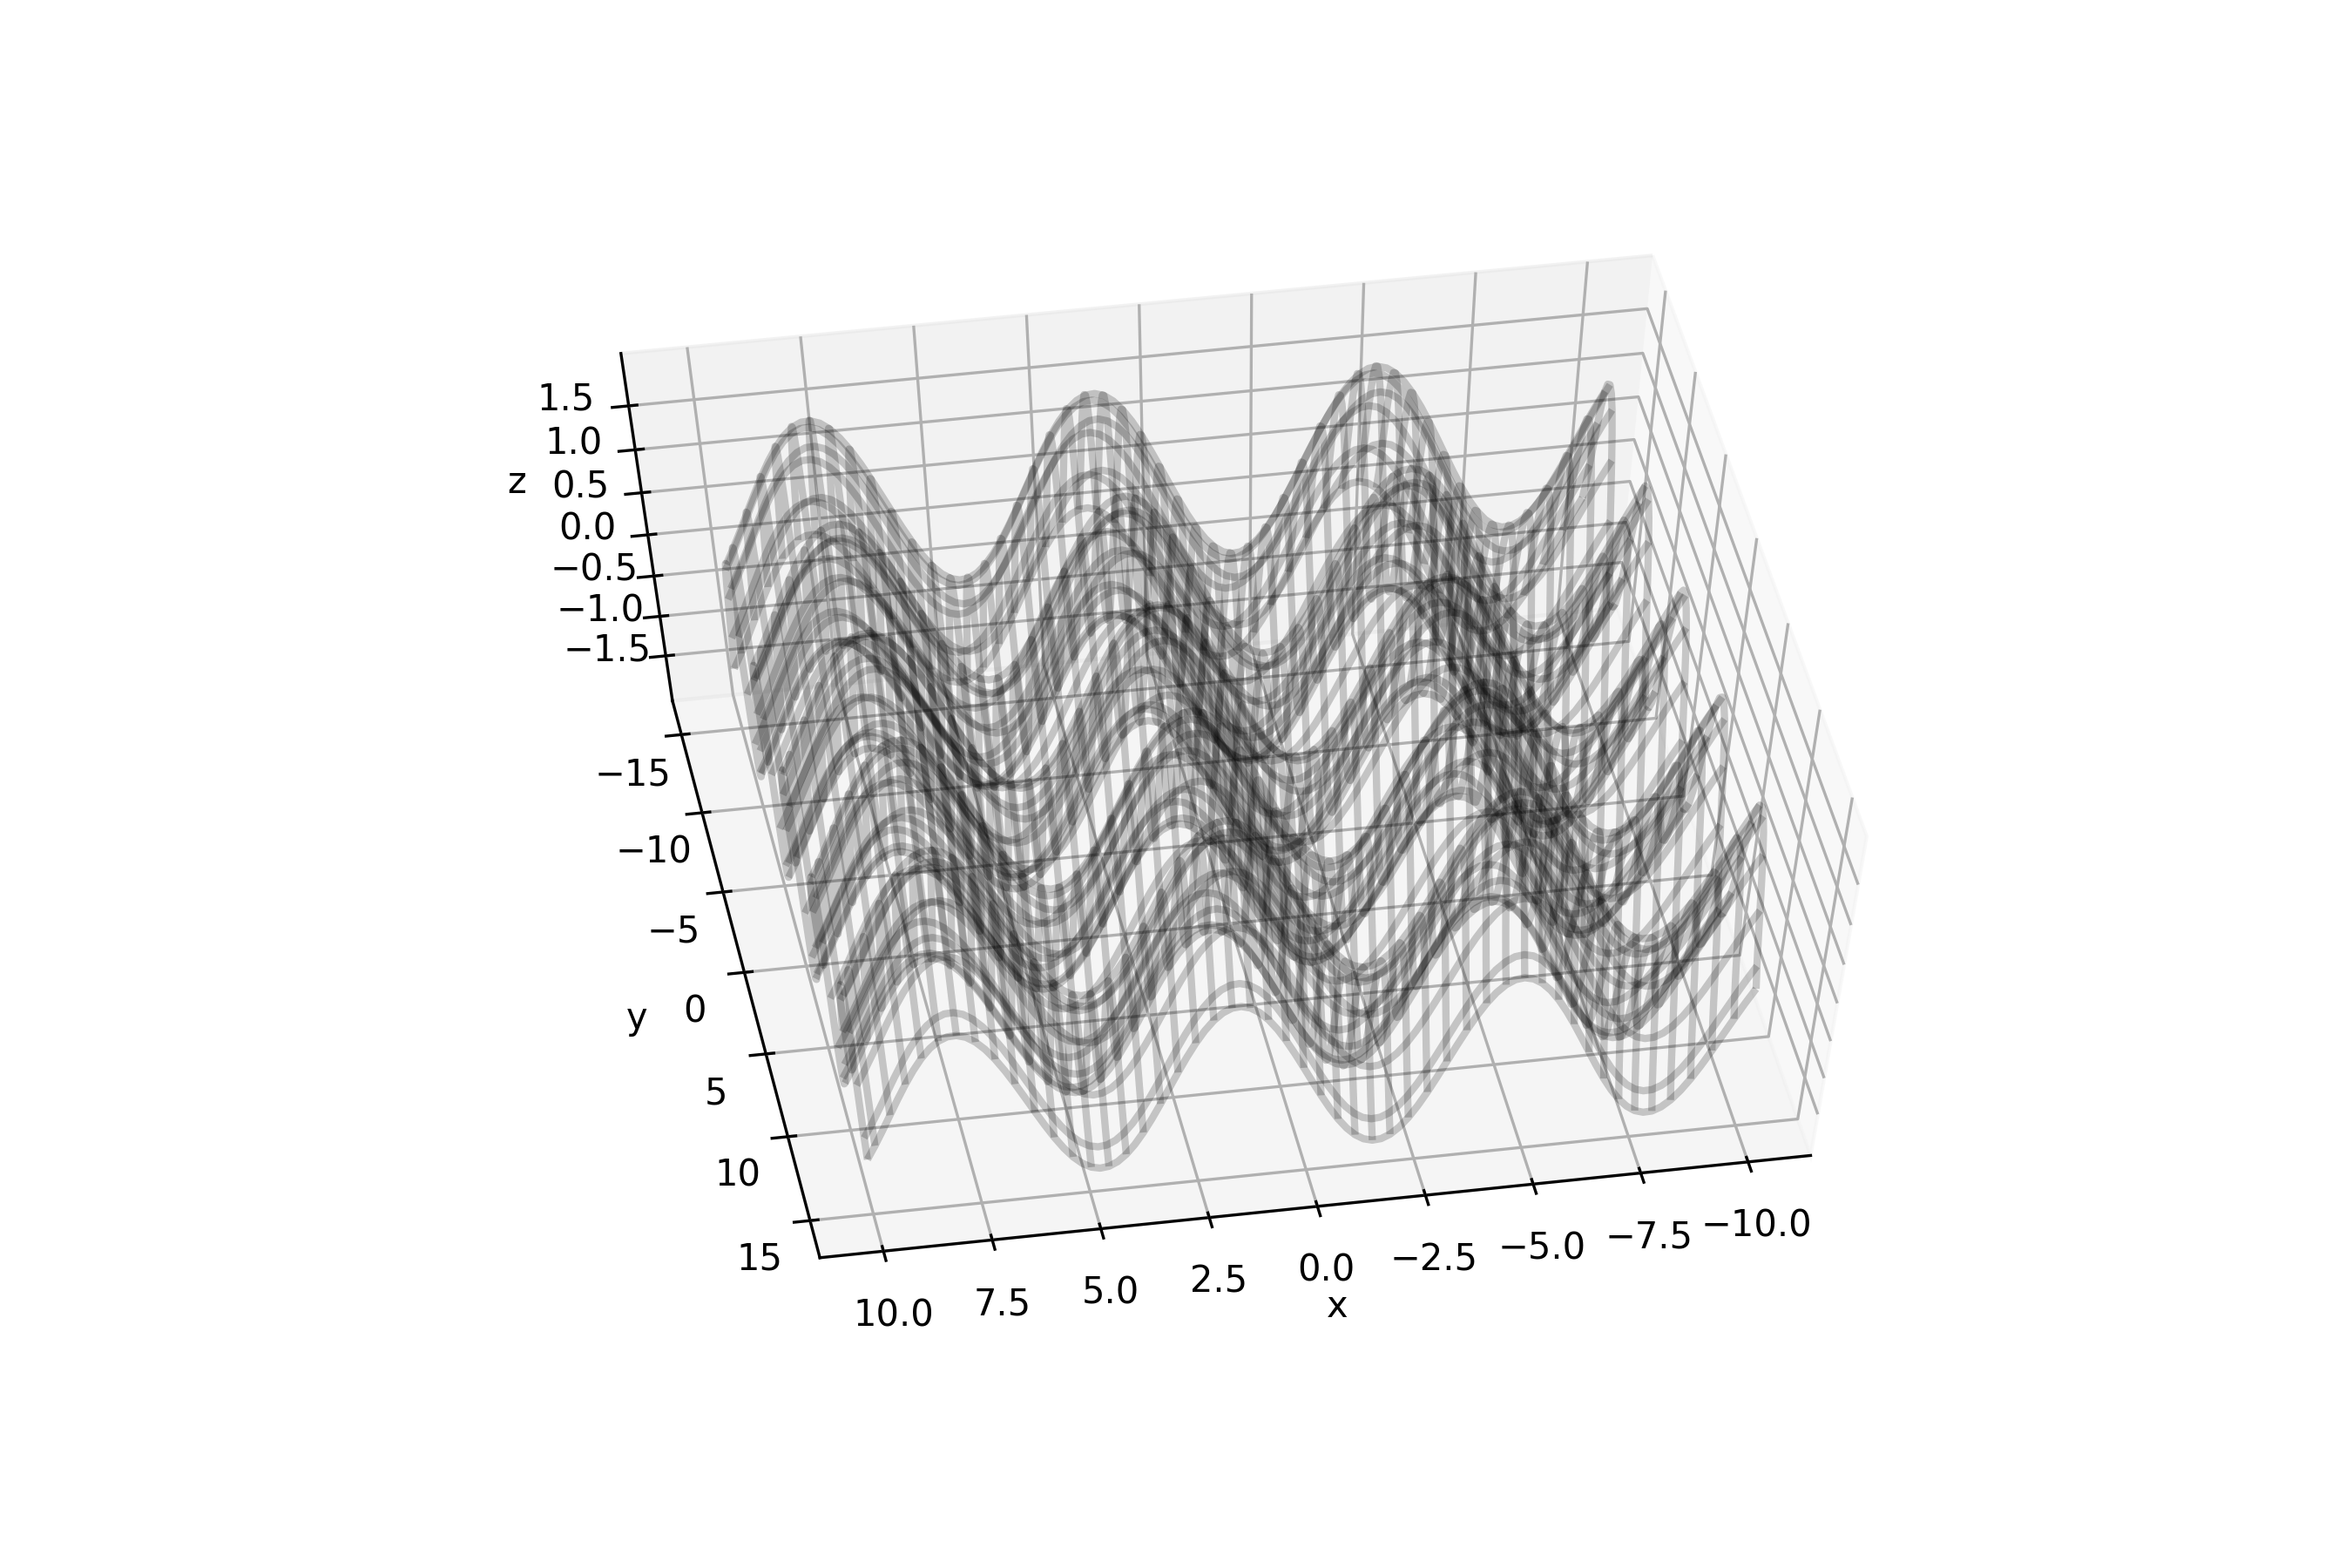
I think you will be confused and can not imagine that figure. I suggest you change the point of view using this code before you save the figure.
我认为您会感到困惑,无法想象这个数字。 建议您在保存图形之前使用此代码更改观点。
# set point of view, altitude and azimuth axis
ax.view_init(60, 80)
The code will show figure as the following figure
该代码将显示如下图所示
5. 3D Surface Plot
5. 3D表面图
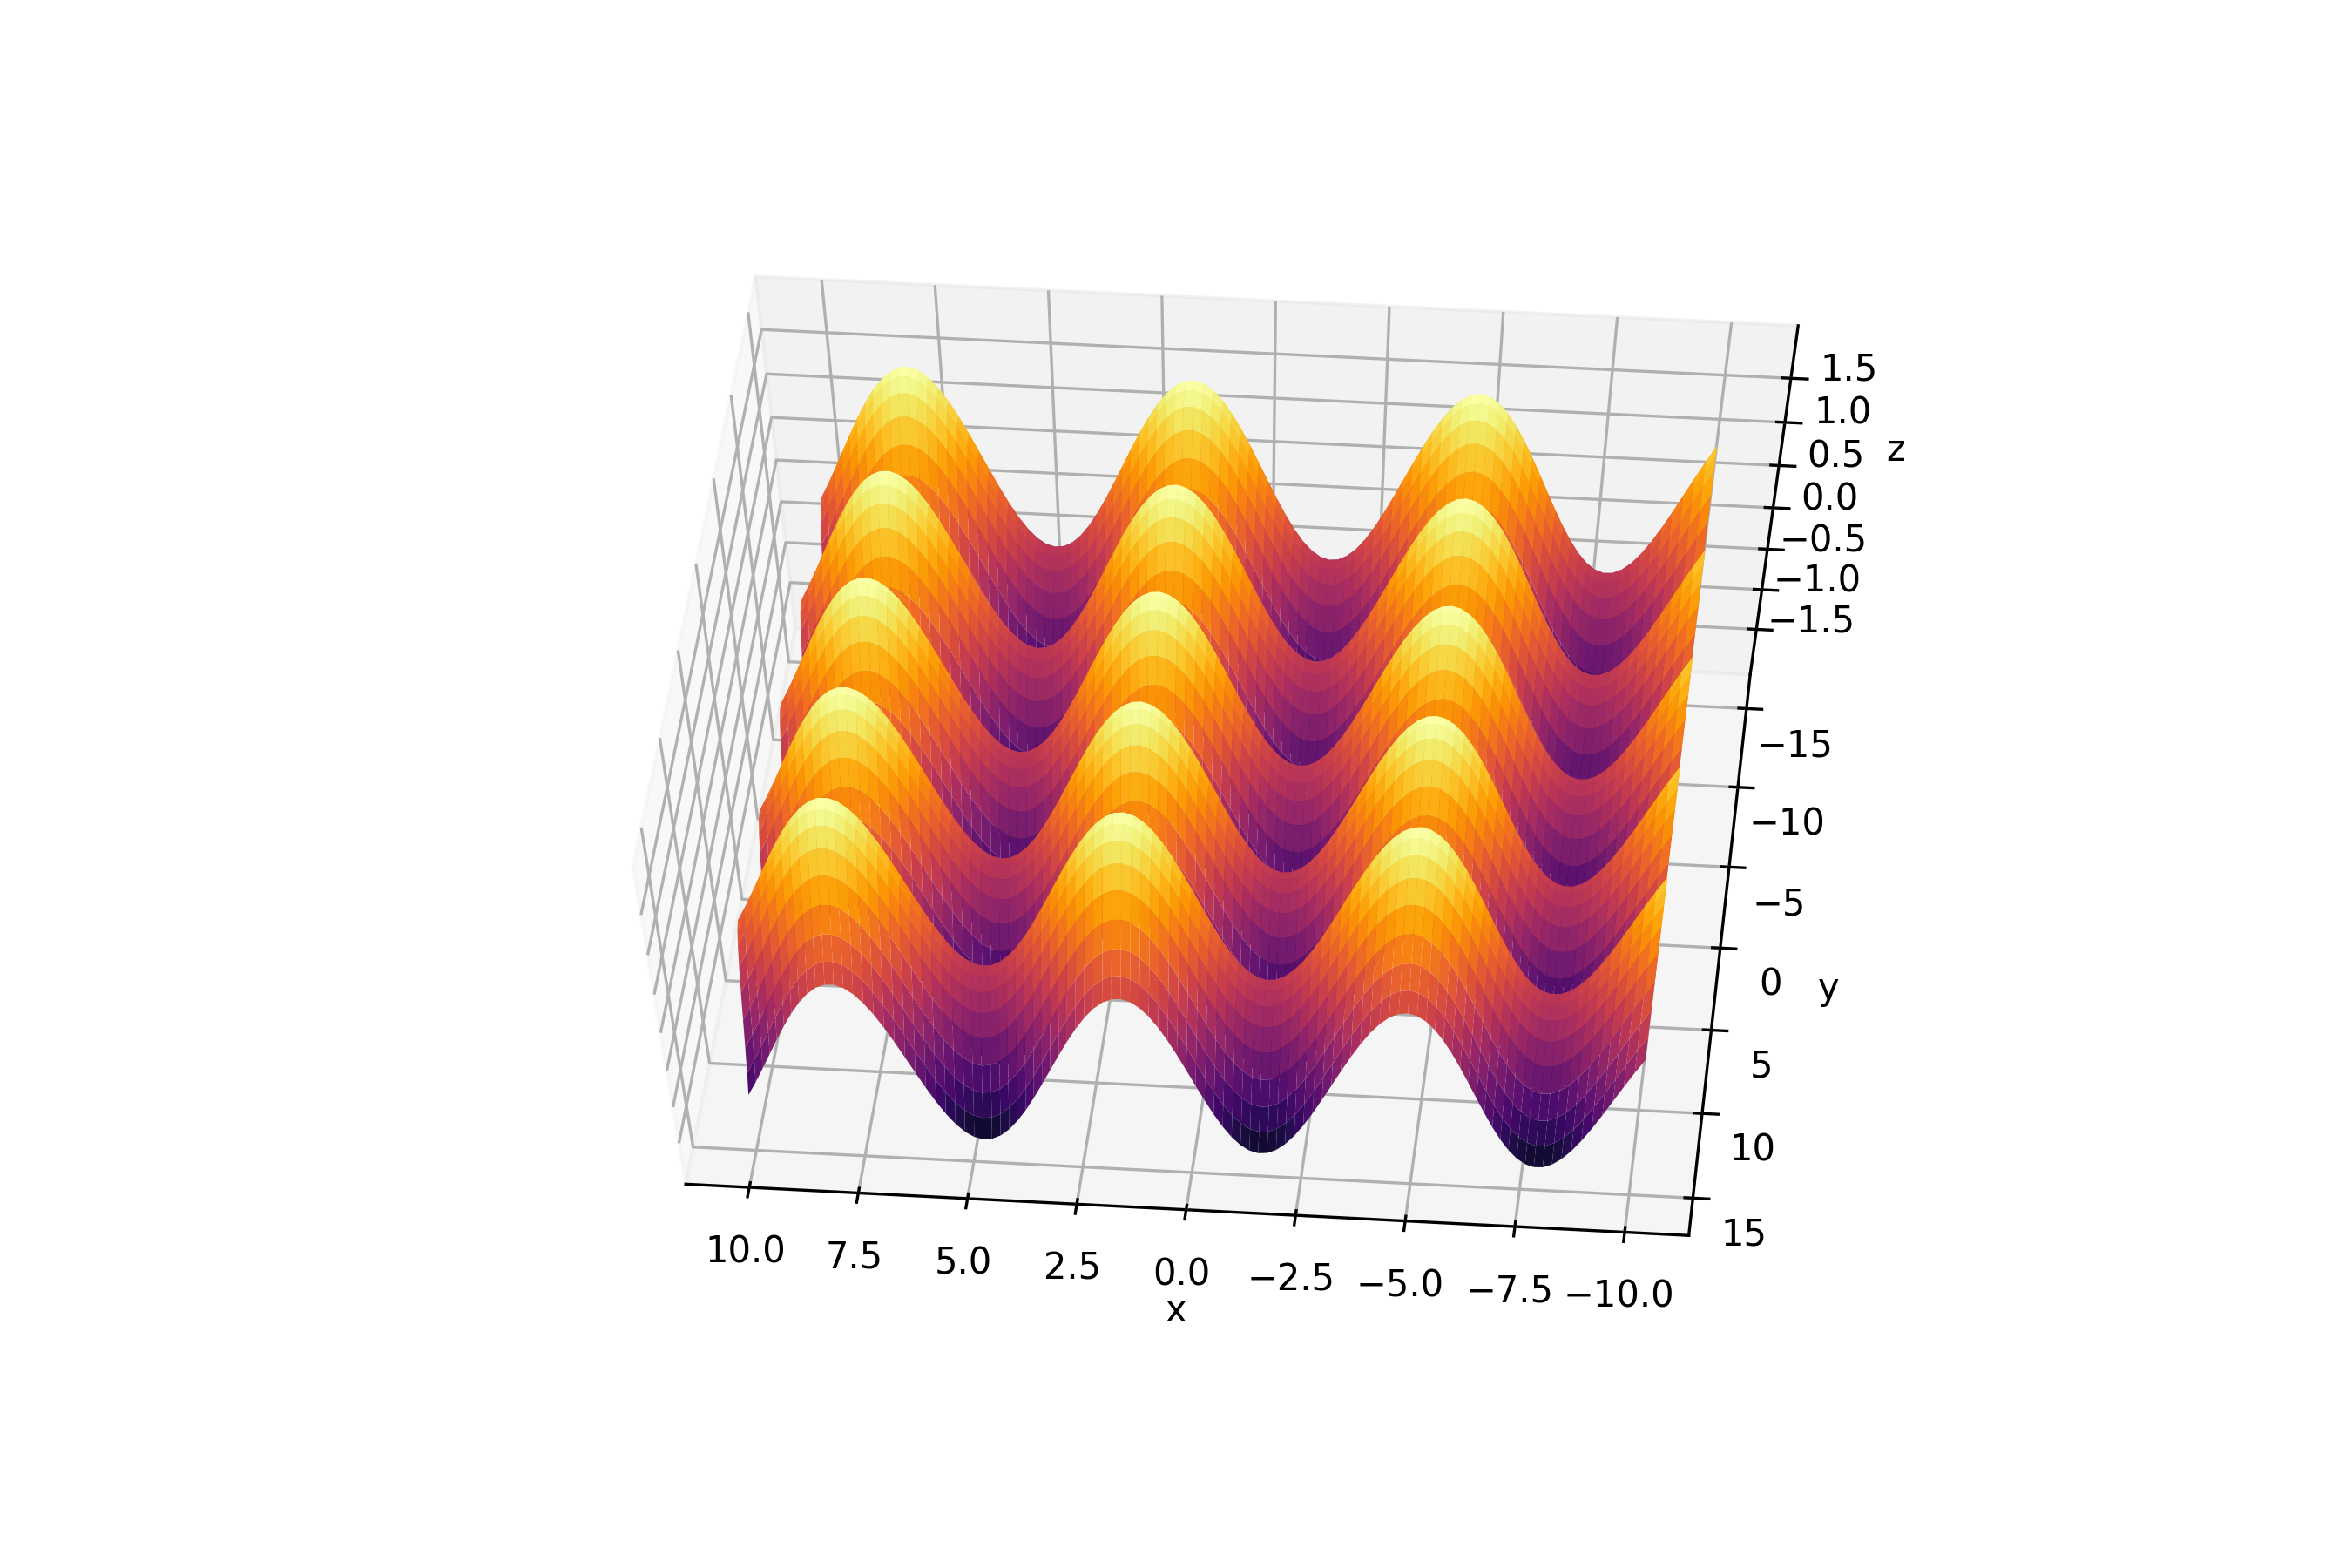
You can create 3D surface plot with this code
您可以使用此代码创建3D表面图
# create data points
x = np.linspace(-10, 10, 100)
y = np.linspace(-15, 15, 100)# create grid
X, Y = np.meshgrid(x, y)Z = np.sin(X) + np.cos(Y)# create figure container
fig = plt.figure(figsize=(9, 6))
ax = plt.axes(projection = '3d')# 3d contour plot
ax.plot_surface(X, Y, Z, rstride = 1, cstride = 1, cmap = 'inferno')# set labels
ax.set_xlabel('x')
ax.set_ylabel('y')
ax.set_zlabel('z')# set point of view, altitude and azimuthal axis
ax.view_init(60, 95)# save figure
plt.savefig('3d_surface.png', dpi = 300)
The result is
结果是
6. 3D Surface Triangulation Plot
6. 3D表面三角剖分图
To show a figure like this
为了显示这样的数字
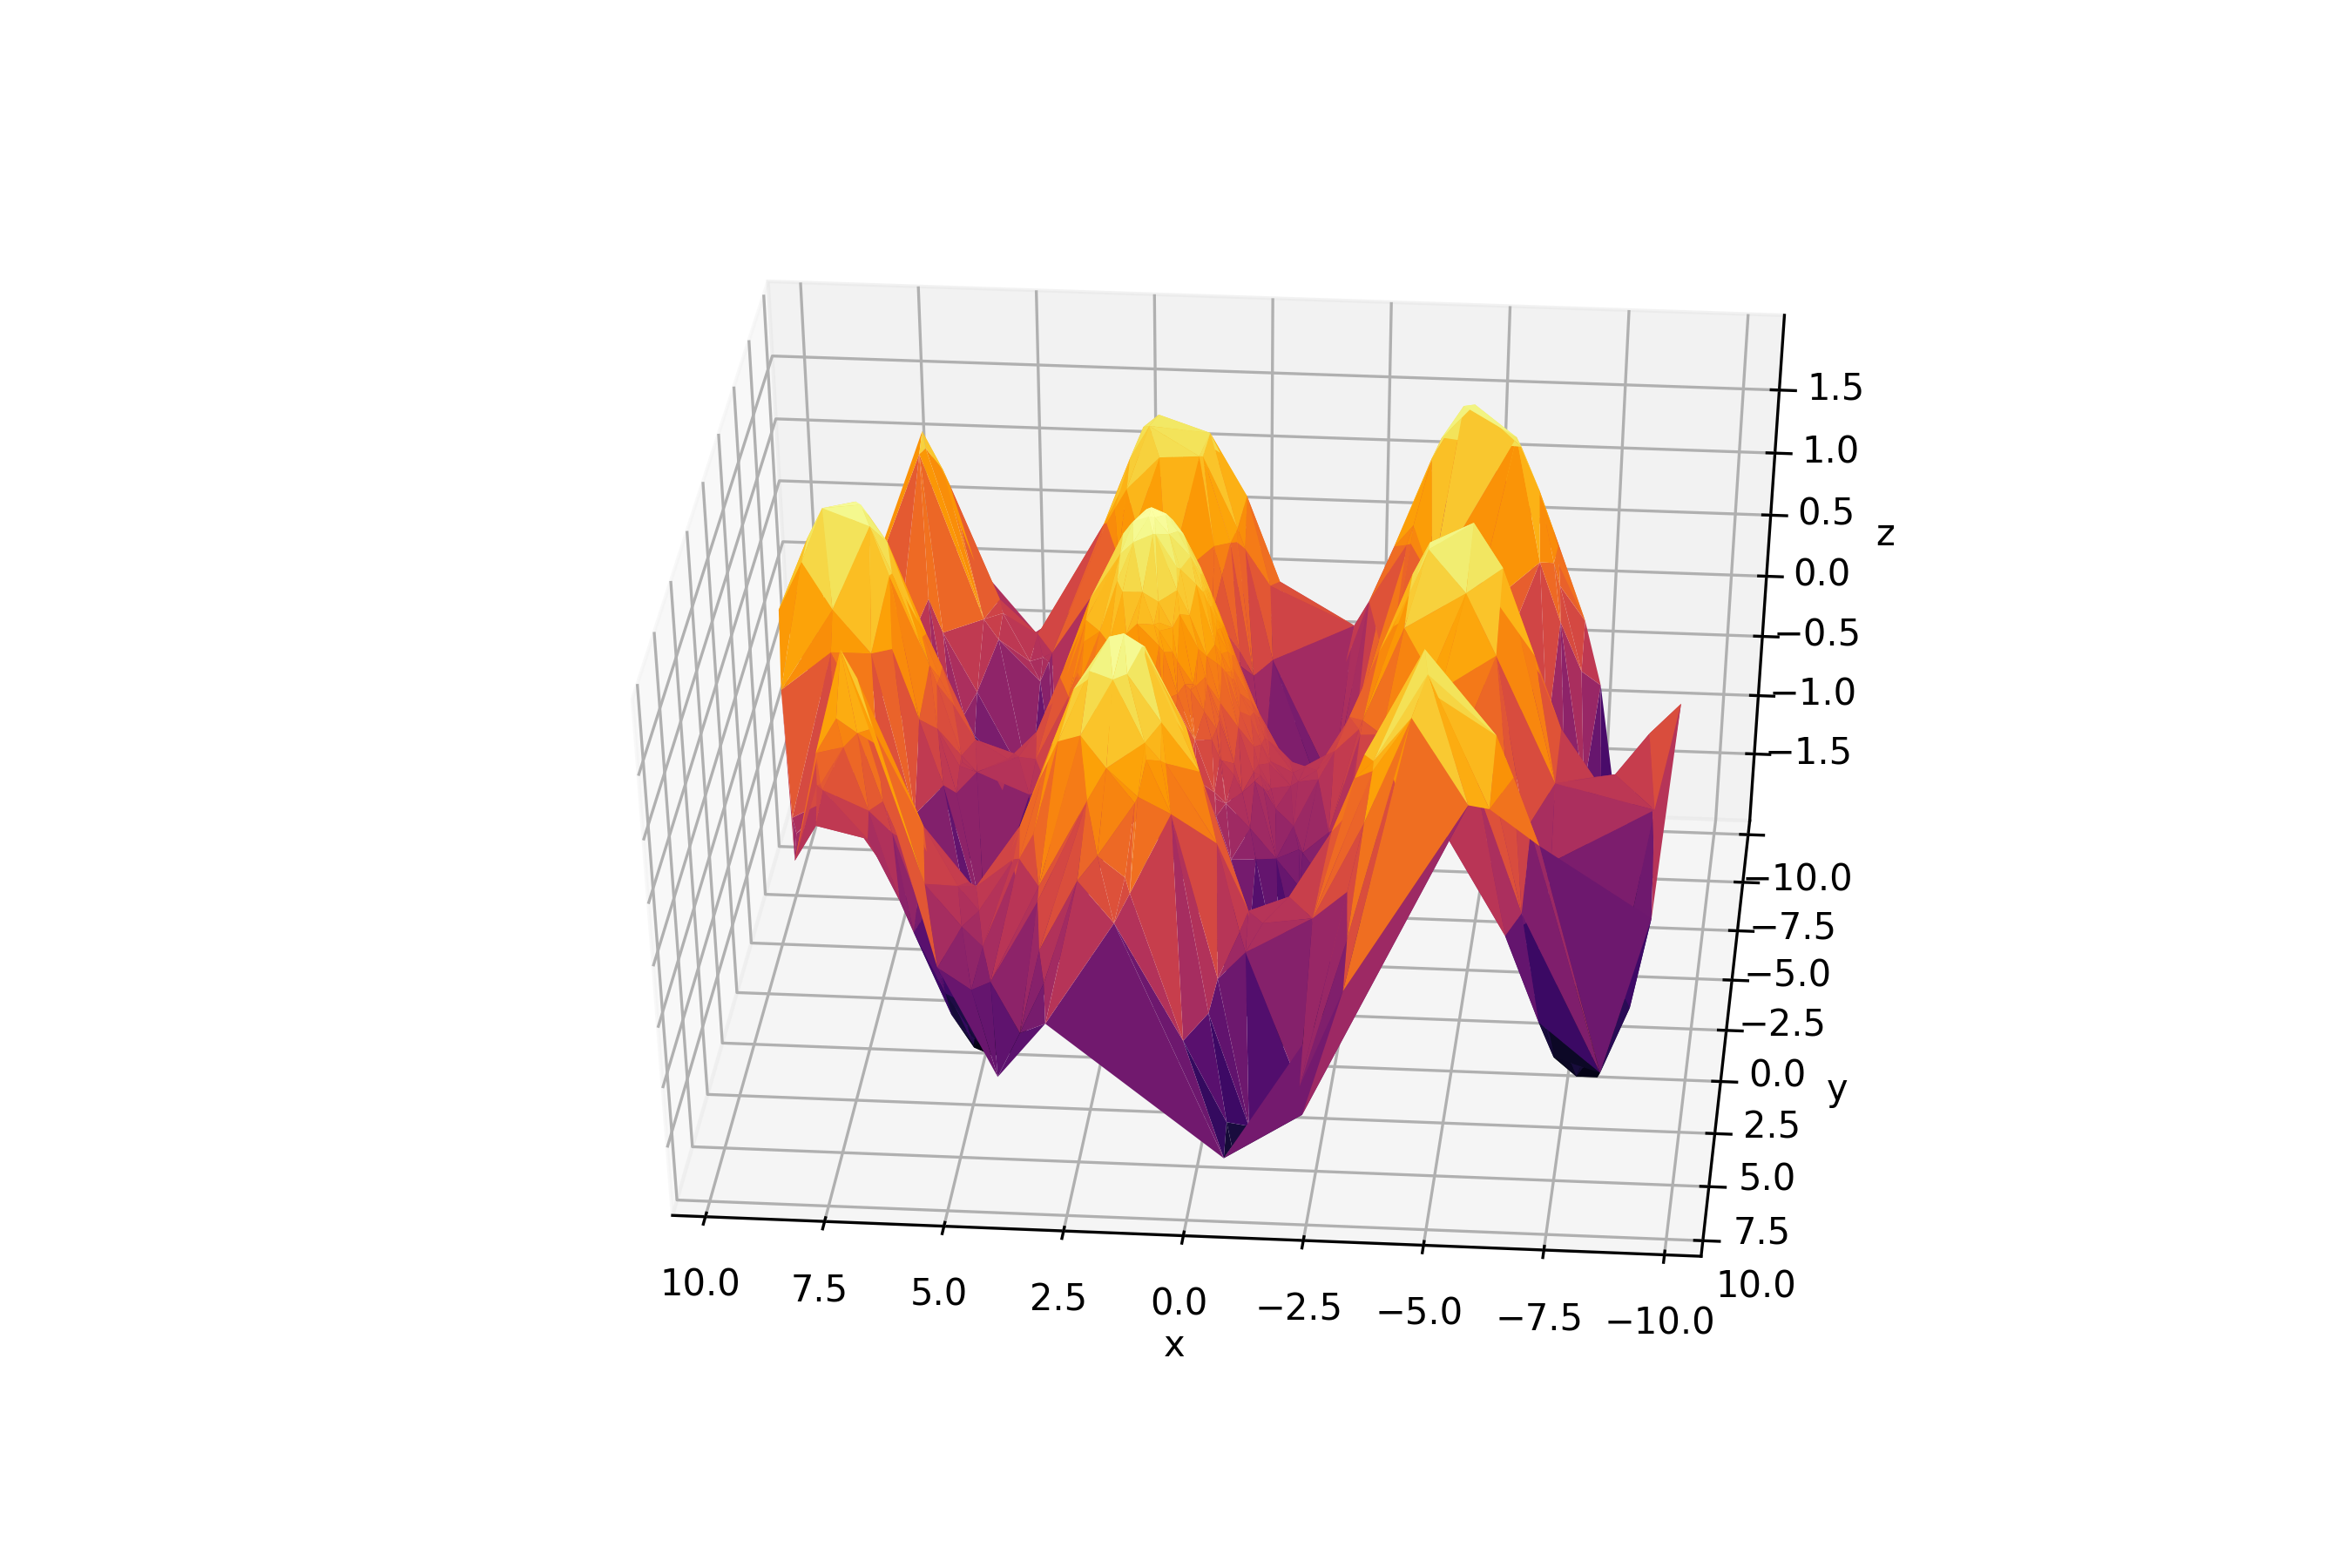
you can use this code
您可以使用此代码
r = 3 * np.pi * np.random.random(1000)
theta = 5 * np.pi * np.random.random(1000)xdata = np.ravel(r * np.sin(theta))
ydata = np.ravel(r * np.cos(theta))
zdata = np.sin(xdata) + np.cos(ydata)fig = plt.figure(figsize=(9, 6))
ax = plt.axes(projection = '3d')# 3d contour plot
ax.plot_trisurf(xdata, ydata, zdata, cmap = 'inferno')# set labels
ax.set_xlabel('x')
ax.set_ylabel('y')
ax.set_zlabel('z')# set point of view, altitude and azimuthal axis
ax.view_init(40, 95)# save figure
plt.savefig('3d_trisurf.png', dpi = 300)
That’s all. Leave a comment below to gimme suggestions.
就这样。 在下面留下评论,给我一些建议。


 442
442

 被折叠的 条评论
为什么被折叠?


