


Do you like graphs? I really like it because it looks like a real-world for me. Didn’t you? I hope you feel the same thing. Graphs can be anything, it can be protein, human, animal, molecule, machine, and anything you can imagine. In this post, we will learn some techniques based on graphs to visualize the data.
你喜欢图吗? 我真的很喜欢它,因为它对我来说就像一个现实世界。 不是吗 我希望你也有同样的感觉。 图形可以是任何东西,可以是蛋白质,人类,动物,分子,机器以及您可以想象的任何东西。 在这篇文章中,我们将学习一些基于图形的技术来可视化数据。
力导向图布局 (Force-directed Graph Layouts)
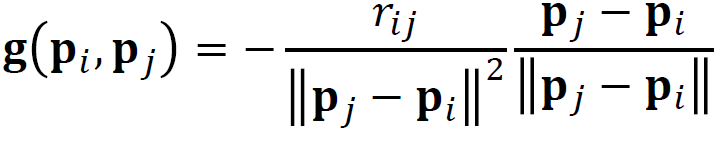
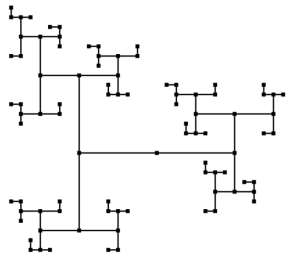
The goal of this technique is to place groups of strongly connected nodes close to each other, preserve the minimum distance between nodes. How can we achieve this, we will take the idea from nature. The idea is to model the graph as a spring system. Edges are modeled as springs and we need to avoid the overlaps between nodes, we model nodes to electrically repel each other. The final positions are selected by simulating the resulting forces, finding equilibrium between spring force and electrical force.
该技术的目的是将紧密连接的节点组彼此靠近放置,并保持节点之间的最小距离。 我们如何实现这一目标,我们将从自然中汲取灵感。 想法是将图形建模为弹簧系统。 边缘被建模为弹簧,我们需要避免节点之间的重叠,我们对节点进行建模以使其相互排斥。 通过模拟合力来选择最终位置,并在弹簧力和电场力之间找到平衡。
Let’s define both forces:
让我们定义两个力:
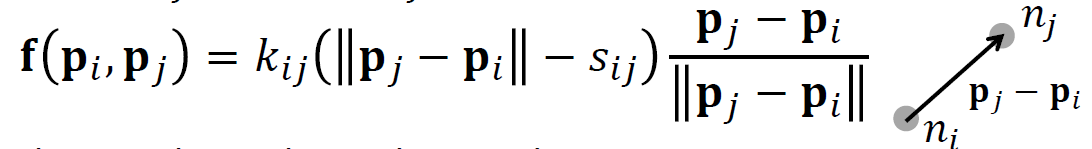
The Spring force is calculated for the connected nodes. pj-pi is the vector from ni to nj. We normalize this vector and s is the natural spring length, the normal length when there are no external forces. k is the tension of the spring.
计算连接节点的弹力。 pj-pi是从ni到nj的向量。 我们对该向量进行归一化,并且s是自然弹簧长度,即没有外力时的法线长度。 k是弹簧的张力。
Electrical repulsion is calculated for every node. It is defined by the above equation. r is repulsion strength.
计算每个节点的电斥力。 由上式定义。 r是排斥强度。
General Algorithm
通用算法
The idea is to find out the equilibrium point where the distances of the nodes make the forces zero.
想法是找出平衡点,在该平衡点处节点的距离使力为零。
- Initialize randomly the position of nodes or through a heuristic 随机初始化节点的位置或通过启发式
- Iterate: 重复:
Sum all attractive and repulsive forces => Multiply overall force by stepsize (people call it temperature, you can think learning rate in deep learning) => Impose a maximum displacement=> move nodes => Adjust temperature(this step can be skipped)
将所有吸引力和排斥力相加=>将整体力乘以步长(人们称其为温度,您可以认为深度学习中的学习率)=>施加最大位移=>移动节点=>调节温度(可以跳过此步骤)
Do this till the forces are going to zero.
这样做直到力趋于零。
Quenching and Simmering
淬火和immer

We can separate the iteration into two parts. The first part is quenching, its temperature is high and the nodes are fastly relocated. The second part is simmering, its temperature is low and the nodes are slowly relocated and find the precise positions.
我们可以将迭代分为两部分。 第一部分是淬火,其温度很高,节点快速重定位。 第二部分是慢炖,温度低,节点缓慢地重新定位并找到精确的位置。
Grid Variant
网格变体
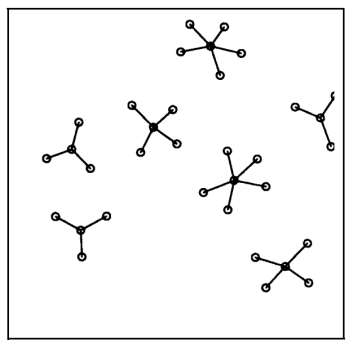
It is hard to calculate the repulsion forces for every node. To speed up the algorithm, we divide the plane into grid cells and only compute repulsive forces between nodes in the same cell. It also gives better informative results as you can see above.
很难计算每个节点的排斥力。 为了加快算法的速度,我们将平面划分为网格单元,并且仅计算同一单元中节点之间的排斥力。 如上所示,它还提供了更好的信息量。
可视化树 (Visualizing Trees)
The rooted trees, it has a root of a tree, have many techniques to visualize the data. In this post, I will introduce three techniques. Maybe, you already know the some of techniques.
有根的树,它有树的根,有许多可视化数据的技术。 在本文中,我将介绍三种技术。 也许,您已经知道一些技巧。
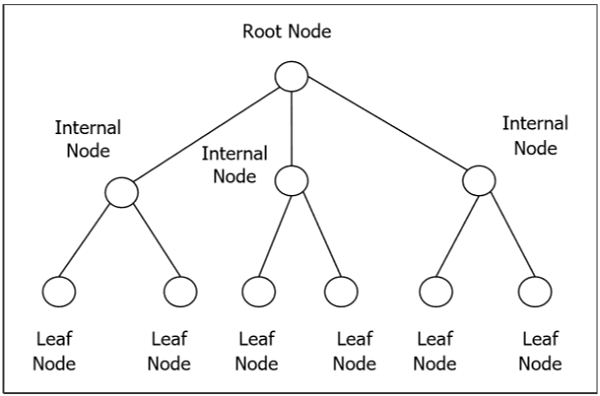
节点链接图 (Node-Link Diagrams)
This technique just uses a rooted tree itself with design goals. Common design goals:
该技术仅使用具有设计目标的有根树本身。 共同的设计目标:
- Nodes at the same depth share the same vertical position 相同深度的节点共享相同的垂直位置
- Horizontal whitespace communicates hierarchy 水平空白传达层次结构
- Minimize the required area 最小化所需面积
- Minimize the total length of edges 最小化边缘的总长度
- Achieve a good aspect ratio 实现良好的宽高比
莱因戈尔德-蒂尔福德 (Reingold-Tilford)
Reingold and Tilford,[Reingold/Tilford 1981], formulate how to draw the binary trees for visualization. Its rule can be generalized.
Reingold和Tilford,[Reingold / Tilford 1981]提出了如何绘制二叉树以进行可视化的方法。 它的规则可以推广。
Aesthetic Goals:
审美目标:
- Nodes at the same level should be aligned 同一级别的节点应对齐
- Maintain the relative ordering of left and right subtrees 保持左右子树的相对顺序
- The parent should be centered over the children 父母应以孩子为中心
- A tree and its mirror image should be drawn as reflections of each other 一棵树及其镜像应作为彼此的反射来绘制
- A subtree should be drawn the same way regardless of where it occurs in the tree 无论子树在树中的什么位置,都应以相同的方式绘制子树
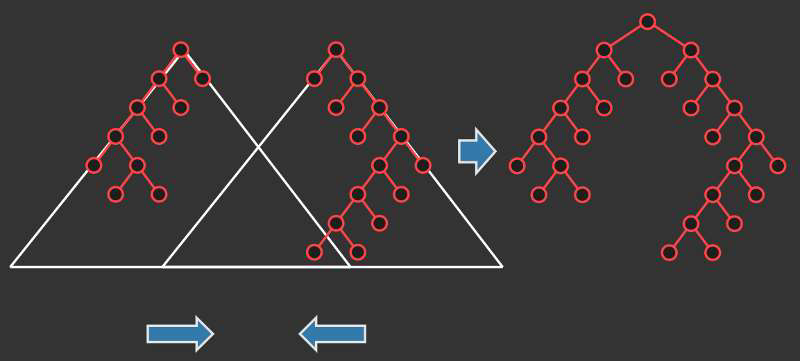
The process recursively constructs the subtree and finds the rightmost point in the left subtree and the leftmost point in the right subtree. It defines the distance, users can choose, between the points and make the center point of it to connect the subtrees.
该过程以递归方式构造子树,并在左侧子树中找到最右边的点,在右侧子树中找到最左边的点。 它定义了用户可以选择的点之间的距离,并使它的中心点连接子树。
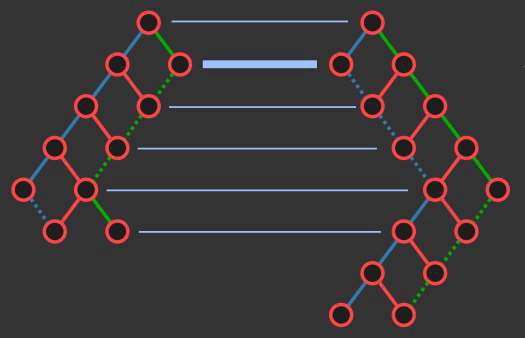
If we are trying to find the rightmost point and the leftmost point, we need to traverse the whole graph every time. Thus, we define the thread, the connection of the contour for left and right. You can check the dotted line in the above picture. Thread is defined when there are no children even if it is right or left contour, it just hops to the next depth.
如果我们试图找到最右边的点和最左边的点,则需要每次遍历整个图。 因此,我们定义了螺纹,即左右轮廓的连接。 您可以检查上图中的虚线。 在没有子项的情况下定义了线程,即使它是右轮廓或左轮廓,也只是跳到下一个深度。
Pros and Cons
利弊

It is easy to understand and implement but there is a significant drawback, it can lead to poor aspect ratios. To solve this problem, there are many alternatives. The above picture shows you one of the alternatives, it gives up width and hierarchy.
它易于理解和实施,但是存在一个明显的缺点,它可能导致不良的宽高比。 为了解决这个问题,有很多选择。 上图为您提供了一种替代方案,它放弃了宽度和层次结构。
径向布局和气泡树布局 (Radial Layout & Bubble Tree Layout)
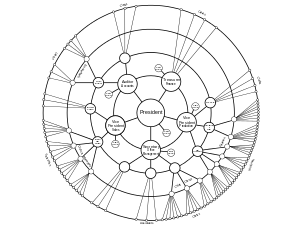
You can check other methods like these.
您可以检查其他类似的方法。
缩进 (Indentation)
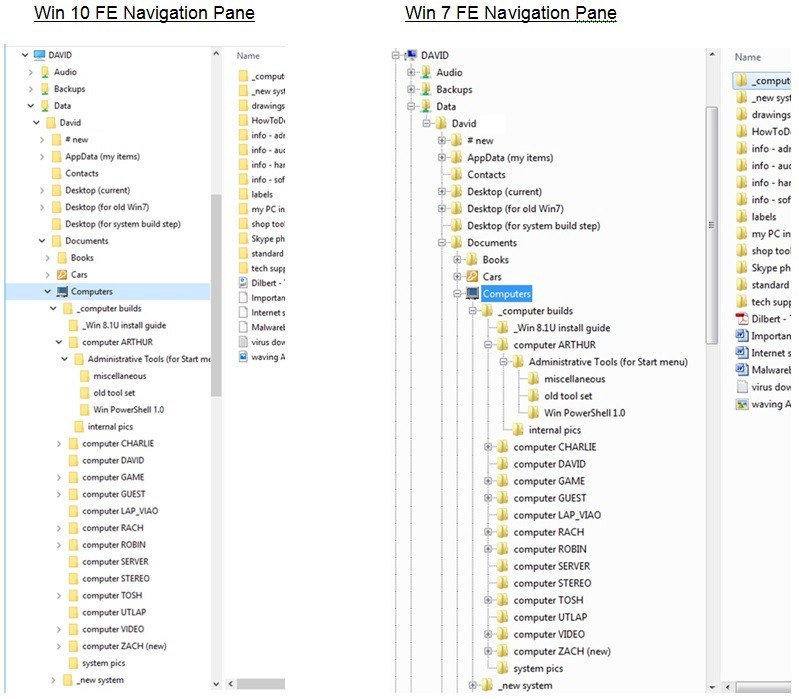
Indentation is a well-known visualization method. You can open your file manager and check it. It places all items along vertically spaced rows. Indentation used to show parent/child relationships. The drawback is that it needs a great deal of scrolling to represent the files.
缩进是一种众所周知的可视化方法。 您可以打开文件管理器并进行检查。 它将所有项目沿垂直间隔的行放置。 缩进用来显示父母/孩子的关系。 缺点是它需要大量滚动来表示文件。
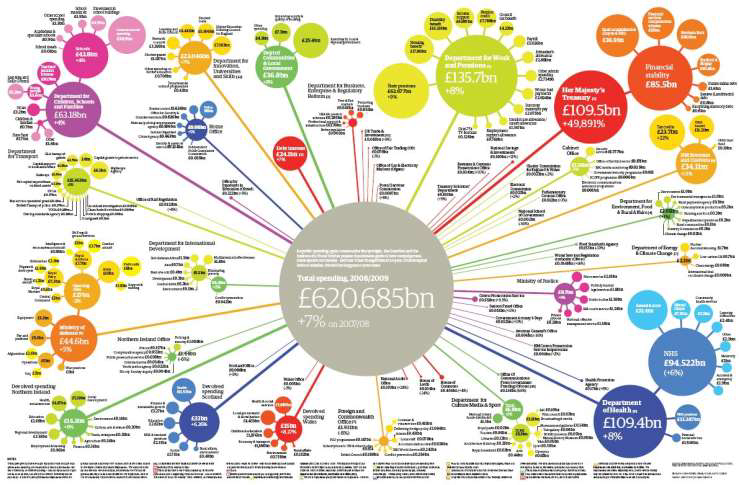
树状图 (Treemaps)
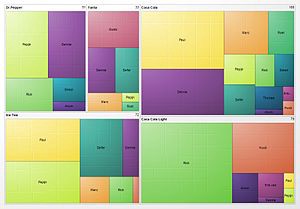
To solve the problem of indentation, treemaps encode structure using a spatial enclosure. It provides a single view of the entire tree and it is easy to tell the size of the node, encode additional attributes. However, it is difficult to accurately read depth.
为了解决缩进的问题,树图使用空间包围对结构进行编码。 它提供了整个树的单一视图,很容易分辨出节点的大小,对其他属性进行编码。 但是,难以准确读取深度。
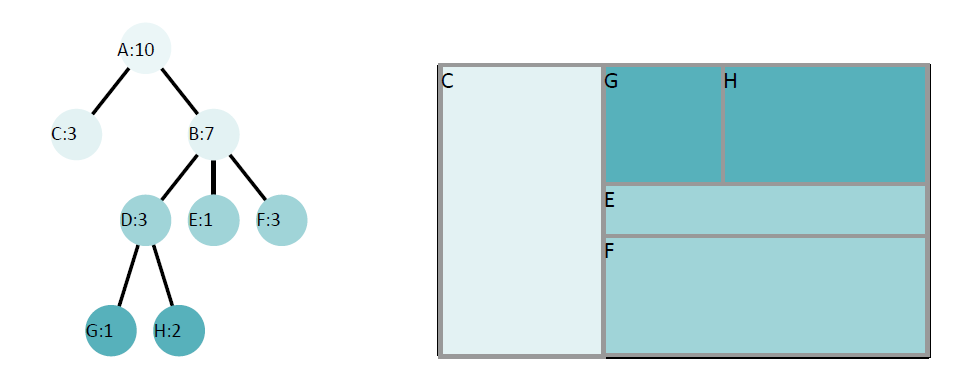
The basic algorithm of treemap recursively fills available space based on a size metric for nodes. The naive application of this algorithm leads to poor aspect ratios.
树形图的基本算法基于节点的大小度量递归填充可用空间。 该算法的幼稚应用导致较差的宽高比。
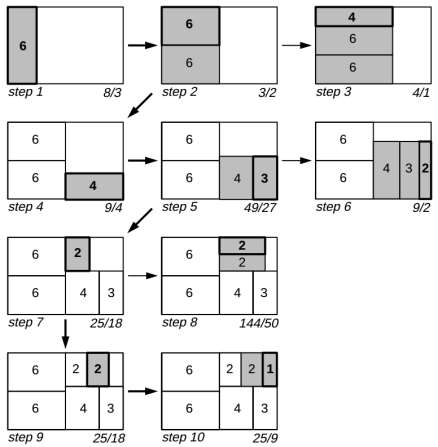
When we divide the space, we check the aspect ration every step and pick the best one by the greedy search, calculating every possible case is np problem.
当我们划分空间时,我们会检查每一步的宽高比,并通过贪婪搜索选择最佳的宽高比,计算出每种可能的情况都是np问题。
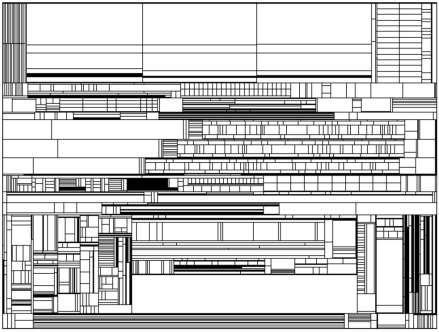

You can check the difference but it becomes harder to perceive hierarchical structure.
您可以检查差异,但是很难理解层次结构。
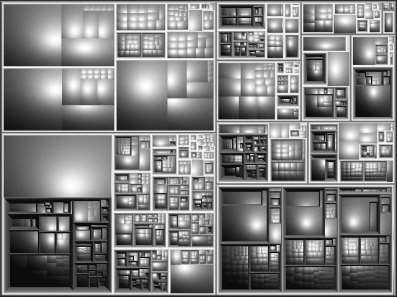
Cushion shading can solve this problem.
垫子阴影可以解决此问题。
This post is published on 9/12/2020
此帖发布于9/12/2020
翻译自: https://medium.com/swlh/vc-trees-and-graphs-ae31b8e842e8


 2049
2049


 被折叠的 条评论
为什么被折叠?
被折叠的 条评论
为什么被折叠?
 到【灌水乐园】发言


