


K means clustering is another simplified algorithm in machine learning. It is categorized into unsupervised learning because here we don’t know the result already (no idea about which cluster will be formed). This algorithm is used for vector quantization of the data and has been taken from signal processing methodology. Here the data is divided into several groups, data points in each group have similar characteristics. These clusters are decided by calculating the distance between data points. This distance is a measure of the relationship among numerous data points lying unclaimed.
K表示聚类是机器学习中的另一种简化算法。 它被归类为无监督学习,因为在这里我们还不知道结果(不知道将形成哪个集群)。 该算法用于数据的矢量量化 ,并取自信号处理方法。 这里的数据分为几组,每组中的数据点具有相似的特征。 通过计算数据点之间的距离来确定这些聚类。 该距离是无人认领的众多数据点之间关系的量度。
K means should not be confused with KNN algorithm as both use the same distance measurement technique. There is a basic difference between the two popular machine learning algorithms. K means works on data and divides it into various clusters/groups whereas KNN works on new data points and places them into the groups by calculating the nearest neighbor method. Data point will move to a cluster having a maximum number of neighbors.
K均值不应与KNN算法混淆 因为两者都使用相同的距离测量技术。 两种流行的机器学习算法之间有一个基本区别。 K Mean处理数据并将其划分为不同的簇/组,而KNN处理新数据点并通过计算最近邻方法将其放入组中。 数据点将移动到具有最大邻居数的群集。
K means clustering algorithm steps
K表示聚类算法步骤
- Choose a random number of centroids in the data. i.e k=3. 在数据中选择随机数量的质心。 即k = 3。
- Choose the same number of random points on the 2D canvas as centroids. 在2D画布上选择与质心相同数量的随机点。
- Calculate the distance of each data point from the centroids. 计算每个数据点到质心的距离。
- Allocate the data point to a cluster where its distance from the centroid is minimum. 将数据点分配给群集,该群集与质心的距离最小。
- Recalculate the new centroids. 重新计算新的质心。
- Recalculate the distance between each data point and new centroids. 重新计算每个数据点和新质心之间的距离。
- Repeat the steps from point 3, till no data point change its cluster. 重复从点3开始的步骤,直到没有数据点更改其群集。
K means divides the data into various clusters and the number of clusters is equal to the value of k i.e. if k=3 then the data will be divided into 3 clusters. each value of k is a centroid around which the data points will gather.
K表示将数据划分为多个簇,簇的数量等于k的值,即,如果k = 3,则数据将被划分为3个簇。 k的每个值都是一个质心,数据点将围绕该质心聚集。

Distance calculation can be done by any of the four methods i.e. Euclidean, Manhattan, Correlation, and Eisen. Here we are using the Euclidean method for distance measurement i.e. distance between two points (x1,y1) and (x2,y2) will be
距离计算可以通过四种方法中的任何一种来完成,即欧几里得,曼哈顿,相关和艾森。 这里我们使用欧几里得方法进行距离测量,即两点(x1,y1)和(x2,y2)之间的距离为

Here are some pros and cons for using k means clustering algorithm in machine learning
这是在机器学习中使用k均值聚类算法的一些优缺点
Pros:
优点:
- A relatively simple algorithm to apply 适用的相对简单的算法
- Flexible and work well with large data 灵活并能很好地处理大数据
- Convergence is guaranteed 保证融合
Cons:
缺点:
- We have to manually define the number of centroids 我们必须手动定义质心的数量
- Not immune to outliers 无法不受异常影响
- Depends on initial values of centroid chosen 取决于所选质心的初始值
Now, we will try to create an algorithm in python language. Here, we will call some basic and important libraries to work.
现在,我们将尝试使用python语言创建一个算法。 在这里,我们将调用一些基本且重要的库来工作。
import pandas as pd
import numpy as np
import matplotlib.pyplot as plt
from sklearn.cluster import KMeans
sklearn is one of the most important packages in machine learning and it provides the maximum number of functions and algorithms. To use k means clustering we need to call it from sklearn package.
sklearn是机器学习中最重要的软件包之一,它提供了最大数量的功能和算法。 要使用k表示聚类,我们需要从sklearn包中调用它。
To get a sample dataset, we can generate a random sequence by using numpy
要获取样本数据集,我们可以使用numpy生成随机序列
x1=10*np.random.rand(100,2)By the above line, we get a random code having 100 points and they are into an array of shape (100,2), we can check it by using this command
在上面的代码行中,我们获得了一个随机的代码,该代码具有100个点,并且它们都位于形状数组(100,2)中,我们可以使用以下命令对其进行检查
x1.shapeNow, we will train our algorithm by processing all the data. Here the number of clusters will be 3. This number is given arbitrarily by us. we can choose any number to define the number of clusters
现在,我们将通过处理所有数据来训练算法。 这里的簇数将为3。该数由我们任意指定。 我们可以选择任何数字来定义集群数
kmean=KMeans(n_clusters=3)
kmean.fit(x1)
we can see our three centers by using the following command
我们可以使用以下命令查看三个中心
kmean.cluster_centers_To check the labels created, we can use the following command. It gives the labels created for our data
要检查创建的标签,我们可以使用以下命令。 它提供了为我们的数据创建的标签
kmean.labels_
We can see that because of manually choosing the number of centroids our clusters are not very much segregated. A cluster have a similar set of information and our aim is to make the cluster as unique as they could. It helps in extracting more information from our given dataset. Thus we can plot an elbow curve which can clearly depict a trade-off between the number of centroids and information gain.
我们可以看到,由于手动选择了质心的数量,因此群集之间的分离程度不是很高。 集群具有相似的信息集,我们的目标是使集群尽可能地唯一。 它有助于从给定的数据集中提取更多信息。 因此,我们可以绘制一条肘部曲线 ,该曲线可以清楚地描述形心数量和信息增益之间的折衷。
wcss = []
for i in range(1,20):
 kmeans = KMeans(n_clusters=i,init=’k-means++’,max_iter=300,n_init=10,random_state=0)
 kmeans.fit(x1)
 wcss.append(kmeans.inertia_)
 print(“Cluster”, i, “Inertia”, kmeans.inertia_)
plt.plot(range(1,20),wcss)
plt.title(‘The Elbow Curve’)
plt.xlabel(‘Number of clusters’)
plt.ylabel(‘WCSS’) ##WCSS stands for total within-cluster sum of square
plt.show()
You can see there is K-means++ as the method than conventional k-means. The former method overcomes the disadvantage of wrong selection of centroids which usually happens because of manual selection. Sometimes the centroids chosen are too far away from the points that they don’t have any data points in their cluster.
您可以看到,与传统的k-means相比, K-means ++作为方法。 前一种方法克服了质心选择错误的缺点,质心选择错误通常是由于手动选择而发生的。 有时选择的质心离它们的群集中没有任何数据点的点太远。
The output graph can help us in determining the number of centroids to be chosen for a better clustering.
输出图可以帮助我们确定为更好的聚类选择的质心数。

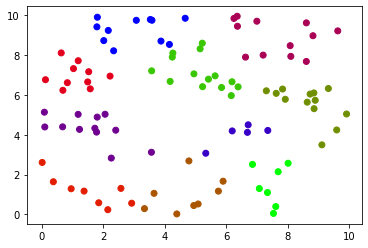
The curve clearly states that if we choose the number of centroids as 7, 8, 9, or 10 then we have a better chance of fine clustering. The data is so scattered that we can even select 14 as the number of centroids. This curve helps in deciding between computational expense and knowledge gain from a dataset. Now, let us select the centroids as 10 so that we have 10 separate clusters.
曲线清楚地表明,如果我们选择质心的数量为7、8、9或10,那么我们就有更好的机会进行精细聚类。 数据非常分散,我们甚至可以选择14个质心。 该曲线有助于确定计算费用和从数据集中获取的知识。 现在,让我们将质心选择为10,这样我们就有10个单独的簇。
Conclusion:
结论:
We have successfully created three clusters from our random data set. All data clusters are shown in different colors. We can use the same code for making clusters on other data also and can even change the number of clusters in the algorithm. Then by using the elbow method we predicted that more centroids can improve the clustering. So after choosing more clusters we get better clusters with improved information gain.
我们已经从随机数据集中成功创建了三个聚类。 所有数据集群均以不同的颜色显示。 我们也可以使用相同的代码在其他数据上建立聚类,甚至可以更改算法中的聚类数量。 然后,通过使用弯头方法,我们预测出更多的质心可以改善聚类。 因此,在选择更多的集群之后,我们将获得具有更好信息获取的更好的集群。
翻译自: https://towardsdatascience.com/k-means-clustering-with-python-code-explained-5a792bd19548


 4078
4078


 被折叠的 条评论
为什么被折叠?
被折叠的 条评论
为什么被折叠?
 到【灌水乐园】发言


