


splunk 监视文件目录
介绍 (Introduction)
Creating a great CorDapp doesn’t stop at writing elaborate contract and flow tests; the continuous improvement must proceed beyond that by monitoring the Corda nodes and supply a feed of metrics to developers and dev-ops, enabling them to make changes that push the performance to its optimum level.
创建出色的CorDapp不仅要编写详尽的合同和流程测试; 持续的改进必须超越此范围,方法是监视Corda节点,并向开发人员和开发人员提供指标提要,使他们能够进行更改以将性能提升到最佳水平。
I recently got introduced to Splunk, which is a very powerful tool to index any source of data; allowing you to search, analyze, and visualize that data. So I started thinking immediately: How can I use Splunk with Corda?
最近向我介绍了Splunk,它是索引任何数据源的非常强大的工具。 允许您搜索,分析和可视化该数据。 因此,我立即开始思考:如何在Corda中使用Splunk?
科尔达指标 (Corda Metrics)
Corda nodes can be enabled to expose different metrics through JMX, which is a Java technology that provides API’s to access MBeans; the latter are system objects that have readable attributes and invokable operations that export those attributes (i.e. metrics).
可以使Corda节点通过JMX公开不同的指标,JMX是一种Java技术,提供访问MBean的API。 后者是具有可读属性和导出这些属性(即指标)的可调用操作的系统对象。
科技栈 (Tech Stack)
Splunk can’t access Corda’s MBeans directly, in fact we will use several technologies and tools to link the two. Below is a diagram showing you how it’s achieved, and follows is a description of that diagram.
Splunk无法直接访问Corda的MBean,实际上,我们将使用多种技术和工具将两者链接在一起。 下面的图表显示了它的实现方式,下面是对该图表的描述。

Jolokia is an agent that can be deployed on JVMs to expose their MBeans through a REST-like HTTP endpoint.
Jolokia是一种代理,可以部署在JVM上,以通过类似REST的HTTP端点公开其MBean。
Hawtio is a web console that exposes Jolokia end points in a nice dashboard, giving you access to their attributes and operations.
Hawtio是一个Web控制台,可在一个漂亮的仪表板中显示Jolokia端点,使您可以访问其属性和操作。
REST API Modular Input is an app that can be installed inside of Splunk to poll data from REST APIs and index the responses.
REST API Modular Input是一个应用程序,可以安装在Splunk内部以轮询REST API的数据并为响应建立索引。
准备样例项目 (Preparation for the Sample Project)
You will run Splunk in a docker container, so make sure that you install Docker (including post-installation steps for Linux), and Docker Compose.
您将在Docker容器中运行Splunk,因此请确保安装Docker (包括Linux 的安装后步骤 )和Docker Compose 。
A Splunk account is required to install the
REST API Modular Inputapp; so head to splunk.com and sign up for a free account (don’t worry, they only ask for your name and email; no credit card details are required).需要Splunk帐户才能安装
REST API Modular Input应用程序; 因此,请前往splunk.com并注册一个免费帐户(不用担心,他们只要求您提供姓名和电子邮件;不需要信用卡详细信息)。An activation key is also required for the
REST API Modular Inputapp, so head to https://www.baboonbones.com/, click onApps->Activation Keyin the top menu, inside theApp Namefield selectREST API Modular Input, fill the rest of the details and choose Get Free 14 Day Trial Key (obviously you’ll need to buy a non-expiring key if you plan on using this setup for production).REST API Modular Input应用程序还需要激活密钥,因此请转到https://www.baboonbones.com/ ,单击顶部菜单中的“App NameApps->Activation Key”,在“App Name字段内选择REST API Modular Input,填写其余详细信息,然后选择“ 获取免费的14天试用密钥” (显然,如果您计划使用此设置进行生产,则需要购买未过期的密钥)。Optional: If you’re using Ubuntu (or Linux in general); I like to use
Terminatoras a command line prompt, it allows me to split vertically and horizontally and have multiple windows in one prompt. You can install it with:可选:如果您使用的是Ubuntu(或通常的Linux); 我喜欢将
Terminator用作命令行提示符,它使我可以垂直和水平拆分,并在一个提示符中具有多个窗口。 您可以使用以下方法安装它:
sudo add-apt-repository ppa:gnome-terminator
sudo apt-get update
sudo apt-get install terminator
样本项目结构 (Sample Project Structure)
You can find the full implementation of the sample project here.
您可以在此处找到示例项目的完整实现。
Below is the explanation of the folder structure:
下面是文件夹结构的说明:

contracts-javaandworkflows-java: I based the sample project off R3’scordapp-example(i.e. the famous IOU CorDapp) which can be found here.contracts-java和workflows-java:我基于R3的cordapp-example(即著名的IOU CorDapp)cordapp-example示例项目,可以在此处找到。splunk-dockercontains thedocker-composefile which you’ll use to start Splunk in a Docker container.splunk-docker包含splunk-dockerdocker-compose文件,您将使用该文件在Docker容器中启动Splunk。corda-monitoris a Splunk app that I created; think of a Splunk app as a package that can bundle your dashboards, saved searches, alerts, etc…corda-monitor是我创建的Splunk应用; 将Splunk应用程序视为可以捆绑仪表板,保存的搜索,警报等的软件包…rest_tais theREST API Modular Inputapp folder.rest_ta是REST API Modular Input应用程序文件夹。hawtiocontains the jar file to run Hawtio.hawtio包含运行Hawtio的jar文件。
Let’s explore the docker-compose.yaml file which is inside splunk-docker folder:
让我们研究一下docker-compose.yaml文件夹中的splunk-docker文件:
SPLUNK_APPS_URL=https://splunkbase.splunk.com/app/1546/release/1.8.7/download: This will install theREST API Modular Inputapp inside of Splunk.SPLUNK_APPS_URL=https://splunkbase.splunk.com/app/1546/release/1.8.7/download这将在Splunk内部安装REST API Modular Input应用程序。SPLUNKBASE_USERNAMEandSPLUNKBASE_PASSWORD: Those are required to install the above app. Remember you created an account on splunk.com? Use your username and password in those fields.SPLUNKBASE_USERNAME和SPLUNKBASE_PASSWORD:安装上述应用程序需要这些。 还记得您在splunk.com上创建了一个帐户吗? 在这些字段中使用您的用户名和密码。../corda-monitor:/opt/splunk/etc/apps/corda-monitor: This will mount thecorda-monitorapp folder (an app that I created), so we don’t lose its data when we rundocker-compose down.../corda-monitor:/opt/splunk/etc/apps/corda-monitor:这将挂载corda-monitor应用程序文件夹(我创建的应用程序),因此在运行docker-compose down时我们不会丢失其数据docker-compose down。../rest_ta:/opt/splunk/etc/apps/rest_ta: This will mount theREST API Modular Inputapp folder, so we don’t lost its data when we rundocker-compose down.../rest_ta:/opt/splunk/etc/apps/rest_ta:这将挂载REST API Modular Input应用程序文件夹,因此当我们运行docker-compose down时,我们不会丢失其数据。../workflows-java/build/nodes/PartyA/logs:/opt/splunk/etc/partya-logs: This will mount thelogsfolder ofPartyAnode, so we can access it inside of Splunk.../workflows-java/build/nodes/PartyA/logs:/opt/splunk/etc/partya-logs:这将安装logs文件夹中的PartyA节点,所以我们可以在里面访问Splunk的吧。
Now open build.gradle which is inside of workflows-java, scroll down to deployNodes Gradle task; you’ll notice that I added the below configuration to PartyA node, which exposes its Jolokia agent end-points on port 7777:
现在开放build.gradle这是内部workflows-java ,向下滚动到deployNodesGradle任务; 您会注意到,我在PartyA节点上添加了以下配置,该配置公开了其在端口7777上的Jolokia代理端点:
extraConfig = [
    jmxReporterType : "JOLOKIA",
    jmxMonitoringHttpPort : 7777
]
运行示例项目 (Running the Sample Project)
1. Clone the repo from here, then browse to the root folder of the project: cd splunk-corda-monitor.
1.从此处克隆存储库,然后浏览到项目的根文件夹: cd splunk-corda-monitor 。
2. Build the Corda nodes: ./gradlew deployNodes (make sure it says BUILD SUCCESSFUL at the end).
2.构建Corda节点: ./gradlew deployNodes (确保最后显示“ BUILD SUCCESSFUL ”)。
3. Open a new terminal and browse to the Notary node: cd splunk-corda-monitor/workflows-java/build/nodes/Notary then start the node with java -jar corda.jar.
3.打开一个新的终端并浏览到Notary节点: cd splunk-corda-monitor/workflows-java/build/nodes/Notary然后启动与节点java -jar corda.jar 。
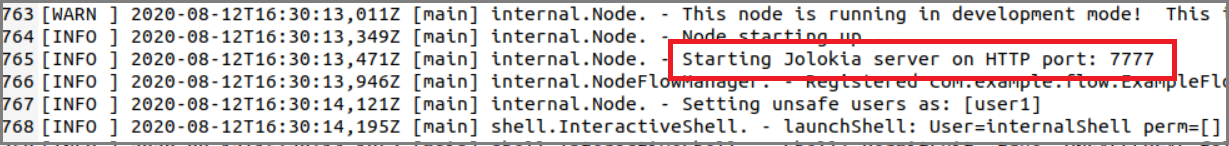
4. Open a new terminal and browse to PartyA node: cd splunk-corda-monitor/workflows-java/build/nodes/PartyA then start the node with java -jar corda.jar. If you open the log file that is located inside of PartyA/logs folder, you’ll see that Jolokia agent started on port 7777 as per the configuration in build.gradle's deployNode task:
4.打开一个新的终端并浏览到PartyA节点: cd splunk-corda-monitor/workflows-java/build/nodes/PartyA然后启动与节点java -jar corda.jar 。 如果打开位于PartyA/logs文件夹内的PartyA/logs文件,您将看到Jolokia代理按照build.gradle的deployNode任务中的配置在端口7777上启动:
5. Open a new terminal and browse to PartyB node: cd splunk-corda-monitor/workflows-java/build/nodes/PartyB then start the node with java -jar corda.jar.
5.打开一个新的终端并浏览到PartyB节点: cd splunk-corda-monitor/workflows-java/build/nodes/PartyB然后启动与节点java -jar corda.jar 。
6. Now you should have 3 nodes running (Notary, PartyA, and PartyB).
6.现在您应该有3个正在运行的节点( Notary , PartyA和PartyB )。
7. Open a new terminal and browse to hawtio folder, then start it with: java -jar hawtio-app-2.10.1.jar.
7.打开一个新终端并浏览到hawtio文件夹,然后使用以下命令启动它: java -jar hawtio-app-2.10.1.jar 。
8. Open your favorite Internet browser and go to localhost:8080/hawtio/jvm/connect.
8.打开您喜欢的Internet浏览器,然后转到localhost:8080/hawtio/jvm/connect 。
9. Create a connection to PartyA’s Jolokia agent: Click on Add Connection and enter the below details (make sure that you test the connection):
9.创建与PartyA的Jolokia代理的Add Connection :单击“ Add Connection然后输入以下详细信息(确保测试连接):

10. Click on connect:
10.单击connect :

11. A new tab will open showing all of the end-points that Jolokia agent of PartyA has; expand the net.corda ones:
11.一种新的标签将打开,显示所有的端点即的椒剂PartyA具有; 扩展net.corda的:

12. Click on the Started end-point, you’ll get value 0; that’s because you didn’t run any flows yet:
12.单击Started端点,您将获得0值; 那是因为您还没有运行任何流:

13. Start a flow in PartyA’s terminal: flow start ExampleFlow$Initiator iouValue: 50, otherParty: "O=PartyB,L=New York,C=US".
13.在PartyA的终端中启动流: flow start ExampleFlow$Initiator iouValue: 50, otherParty: "O=PartyB,L=New York,C=US" 。
14. Back to Started end-point in Hawtio, now the Count shows value 1:
14.返回到Hawtio中的Started端点,现在Count显示值1:

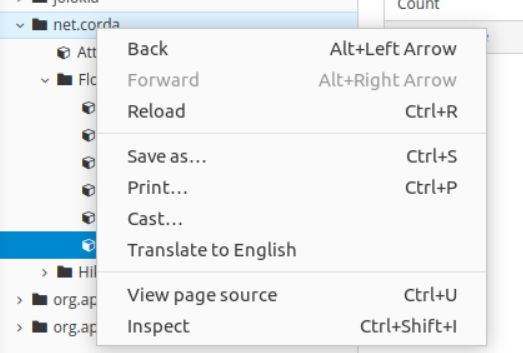
15. Right click on net.corda in Hawtio tree, then click reload:
15.右键单击net.corda在Hawtio树,然后单击reload :
16. Now you get a new metric FlowDuration, you will get a separate end-point for each flow type that you run:
16.现在,您将获得一个新的指标FlowDuration ,您将为所运行的每种流类型获得一个单独的端点:

17. Feel free to explore the remaining end-points; if you want to test the InFlight end-point, stop PartyB node (type bye in its terminal); run the same flow again in PartyA, it will get stuck on the Collecting Signatures step (because PartyB is down); then you can test the InFlight end-point. Start PartyB node again (java -jar corda.jar), the flow will complete and InFlight will show count = 0 again.
17.随意探索其余的终点; 如果要测试InFlight端点,请停止PartyB节点(在其终端中键入bye ); 在PartyA再次运行相同的流程,它将卡在“ Collecting Signatures步骤中(因为PartyB关闭); 然后您可以测试InFlight端点。 再次启动PartyB节点( java -jar corda.jar ),流程将完成,并且InFlight将再次显示count = 0 。
Now that you have access to all of the available Corda node metrics, it’s time to feed them into Splunk.
现在您已经可以访问所有可用的Corda节点指标,是时候将它们馈送到Splunk中了。
18. Open docker-compose file inside splunk-docker and replace **** in SPLUNKBASE_USERNAME and SPLUNKBASE_PASSWORD with your credentials (the account that you created on splunk.com).
18.在splunk-docker内部打开splunk-docker docker-compose文件,并用您的凭据(您在splunk.com上创建的帐户)替换SPLUNKBASE_USERNAME和SPLUNKBASE_PASSWORD **** 。
19. While your nodes and Hawtio are still running, open a new terminal and browse to splunk-docker folder; then start the Splunk container with docker-compose up -d (wait until the container finishes starting, you can check on its status with docker ps; it should show healthy under status). First time you start the container it will take a long time because it will download the Splunk image and install theREST API Modular Input app.
19.当您的节点和Hawtio仍在运行时,打开一个新终端并浏览到splunk-docker文件夹; 然后使用docker-compose up -d启动Splunk容器(等到容器完成启动后,您可以使用docker ps检查其状态;在status下它应该显示healthy )。 首次启动容器时,将花费很长时间,因为它将下载Splunk映像并安装REST API Modular Input应用程序。
20. Open your favorite Internet browser and go to localhost:18000, login with admin/changeme as username/password.
20.打开您喜欢的Internet浏览器,然后转到localhost:18000 ,以admin/changeme作为用户名/密码登录。
21. On the left pane, click on rest_ta (REST API Modular Input app):
21.在左窗格上,单击rest_ta ( REST API Modular Input应用程序):

22. So what does that app do? It allows Splunk to periodically poll REST API’s and index their responses.
22.那该应用程序做什么? 它允许Splunk定期轮询REST API并为其响应编制索引。
23. You will see 2 predefined REST API inputs; the configurations were saved to the local rest_ta folder (i.e. the rest_ta folder inside the project) because I mounted the REST API Modular Input app inside the docker-compose file, and since you cloned the repo, you inherited those configurations:
23.您将看到2个预定义的REST API输入。 这些配置已保存到本地rest_ta文件夹(即项目内的rest_ta文件夹),因为我在rest_ta docker-compose文件中安装了REST API Modular Input应用程序,并且由于您克隆了存储库,因此您继承了这些配置:

24. Before you start using those inputs in your Splunk instance, you need to replace my activation key with the one that you got earlier (the 14 days free activation key).
24.在您的Splunk实例中开始使用这些输入之前,您需要将我的激活密钥替换为您之前获得的激活密钥(14天免费激活密钥)。
25. Click on PartyA/Flows/Started, change the activation key value with your key (I’m counting on you to do this step as common courtesy).
25.单击PartyA/Flows/Started ,用您的密钥更改激活密钥值( PartyA/Flows/Started普遍的礼貌,我希望您执行此步骤)。
26. Now explore the remaining attributes, most importantly Endpoint URL:
26.现在,探索其余属性,最重要的是Endpoint URL :
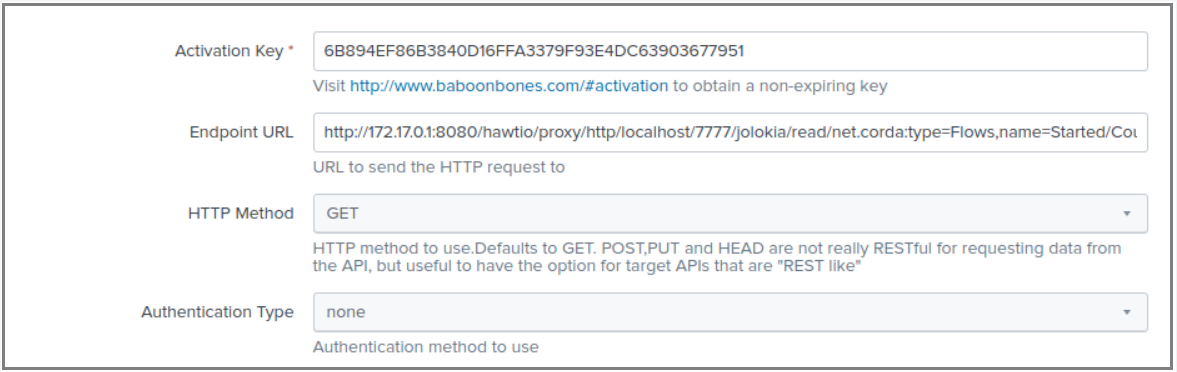
27. Where did I get that value from? Well if you go back to Hawtio and click on the Started end-point, then in the right pane click on the Count word; a pop-up will appear, inside that pop-up you will see the Jolokia URL for that end-point:
27.我从哪里获得价值? 好吧,如果您回到Hawtio并单击Started端点,则在右窗格中单击Count字; 将出现一个弹出窗口,在该弹出窗口内,您将看到该端点的Jolokia URL :


28. Notice in the above URL that the host is localhost, because Hawtio is indeed running locally; but when you paste that URL inside Splunk (which is running inside a Docker container); you can’t use localhost, because in that case locahost is the container itself, not the host machine (i.e. your VM where Docker is running); so in my case where I’m using Ubuntu, the default IP of the host machine is 172.17.0.1, that’s why you’ll see inside Splunk that I’m using the Jolokia URL that I got from Hawtio but using 172.17.0.1 instead of localhost:
28.在上面的URL中注意主机是localhost ,因为Hawtio确实在本地运行; 但是,当您将该URL粘贴到Splunk(在Docker容器中运行)时; 您不能使用localhost ,因为在这种情况下, locahost是容器本身,而不是host (即运行Docker的VM); 因此,在我使用Ubuntu的情况下, host的默认IP为172.17.0.1 ,这就是为什么您会在Splunk中看到我使用的是我从Hawtio获得的Jolokia URL ,而是使用172.17.0.1的localhost :

29. Now moving on to the remaining properties of the REST API input in Splunk, the HTTP Method is Get, and there is no authentication.
29.现在转到Splunk中REST API输入的其余属性, HTTP Method为Get ,并且没有身份验证。
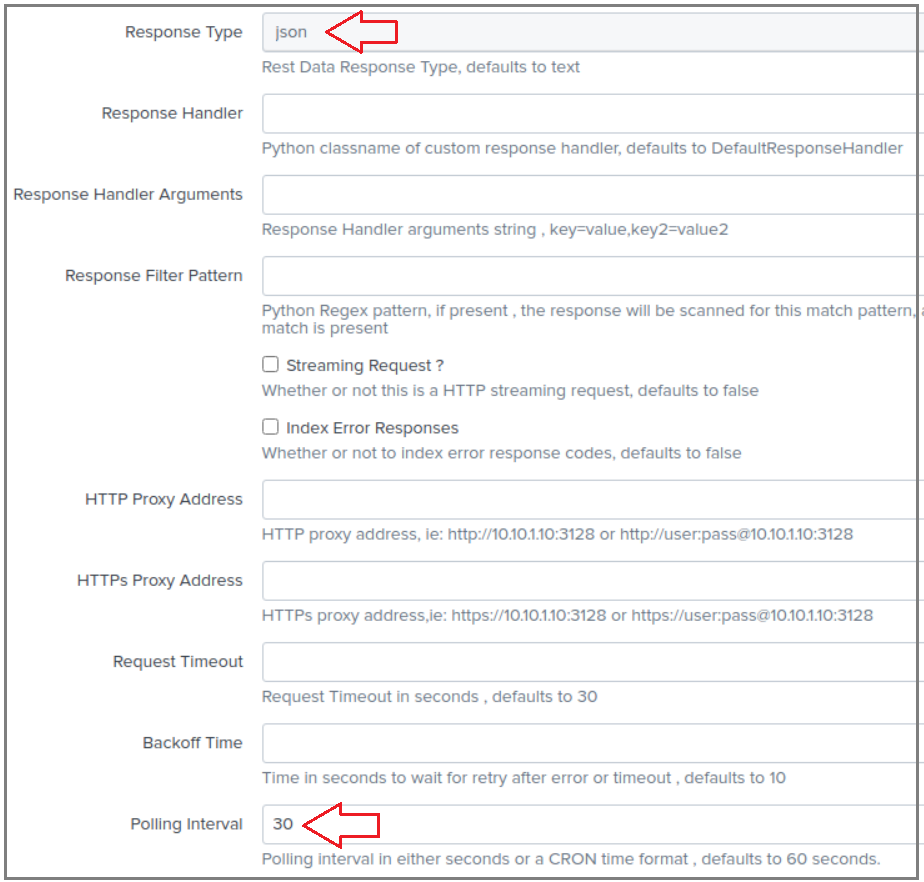
30. The response is set to JSON and Polling Interval to 30 seconds; this is how frequent Splunk will call that REST API, obviously you need to find better values for the interval, 30 seconds is good for demo purposes:
30.响应设置为JSON , Polling Interval为30秒; 这就是Splunk调用REST API的频率,很显然,您需要为该间隔找到更好的值,30秒钟对于演示目的是好的:
31. The Source type is set to partya_flows_started; this is a unique value that will allow you to search for this API’s events by sourcetype:
31. Source type设置为partya_flows_started ; 这是一个唯一值,可让您按sourcetype搜索此API的事件:

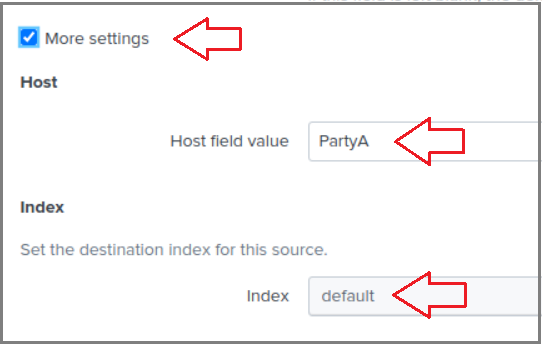
32. Click on More Settings checkbox, Host field value is set to PartyA; this value will allow searching for events by host. index is set to default (which is the main index):
32.单击“ More Settings复选框,“ Host field value设置为PartyA ; 此值将允许按host搜索事件。 index设置为default (这是main索引):
33. Please change the activation key for the second REST API input (i.e. PartyA/Flows/Finished).
33.请更改第二个REST API输入的激活密钥(即PartyA/Flows/Finished )。
34. You’re done exploring REST API Modular Input app which allows Splunk to poll REST API’s and index their responses; next you’ll explore a different type of inputs (text file inputs).
34.您已经完成了REST API Modular Input应用程序的研究,该应用程序允许Splunk轮询REST API并为其响应编制索引; 接下来,您将探索另一种类型的输入(文本文件输入)。
35. Click on Settings -> Data inputs; then select Files & Directories:
35.单击Settings -> Data inputs ; 然后选择Files & Directories :


36. Click on opt/splunk/etc/partya-logs:
36.单击opt/splunk/etc/partya-logs :

37. The pop-up only shows the Host field value which is set to PartyA; again this will allow to search events by host value.
37.弹出窗口仅显示Host field value ,该Host field value设置为PartyA ; 同样,这将允许按host值搜索事件。
38. To see the full list of attributes of a file input, click on New Local File & Directory:
38.要查看文件输入的属性的完整列表,请单击“ New Local File & Directory :

39. Click on Browse, you will see partya-logs in the file tree; remember that I mapped that folder inside the docker-compose file to PartyA's logs folder? This mapping will allow Splunk to access those logs and index them:
39.单击Browse ,您将在文件树中看到partya-logs ; 还记得我将docker-compose文件中的那个文件夹映射到PartyA的logs文件夹吗? 该映射将允许Splunk访问这些日志并为其编制索引:


Click Cancel; I just wanted to show you how you map a local folder to a file input in Splunk.
点击Cancel ; 我只是想向您展示如何将本地文件夹映射到Splunk中输入的文件。
Now that you have your REST API and file inputs setup, time to explore Splunk capabilities; and this is where corda-monitor app comes into place; again, a Splunk app is like a package that has pre-defined searches, dashboards, alerts, etc…Because I mapped corda-monitor app (which I created) to a local drive inside my project, all my settings are preserved to that local folder, and they’re loaded into the app when Splunk container starts.
现在您已经设置了REST API和文件输入,接下来可以探索Splunk功能了。 这就是corda-monitor应用程序出现的地方; 同样,Splunk应用程序就像一个具有预定义搜索,仪表板,警报等的程序包……因为我将corda-monitor应用程序(我创建的)映射到了项目内部的本地驱动器,所以我所有的设置都保存在该本地驱动器中文件夹,并在Splunk容器启动时将它们加载到应用程序中。
40. Open corda-monitor app:
40.打开corda-monitor应用程序:

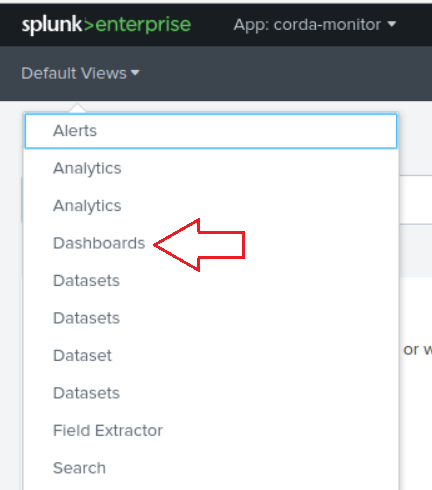
41. Under Default Views, click on Dashboards:
41.在“ Default Views ,单击“ Dashboards :
42. I defined only one dashboard, click on PartyA Dashboard; it has only one saved search (PartyA Started Flows); this saved search is in fact based on the Jolokia end-point for PartyA started flows, remember we defined in REST API Modular Input a REST API input that poll that end-point every 30 seconds? I will show you next where and how I defined that search:
42.我只定义了一个仪表板,单击PartyA Dashboard ; 它只有一个保存的搜索( PartyA Started Flows ); 该保存的搜索实际上是基于PartyA启动流的Jolokia端点的,还记得我们在REST API Modular Input定义的REST API输入每30秒轮询一次该端点吗? 接下来,我将向您展示如何定义搜索的位置和方式:

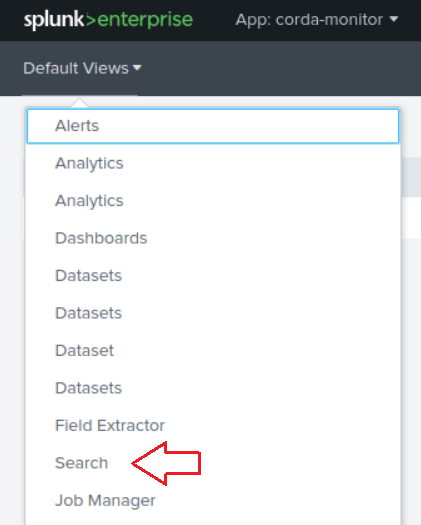
43. Under Default View click on Search:
43.在Default View单击Search :
44. Finally we get to the guts of Splunk, again Splunk can consume any input (in our case we have a REST API and a file input), it will then index it; and its Machine Learning algorithms will intelligently extract the important fields (in key/value pairs) so you can conduct searches, run statistics, and visualize that data. Splunk has many indexes, for instance you can search the _internal index to see if there are any error messages inside Splunk logs.
44.最后,我们了解了Splunk的精髓,再次,Splunk可以使用任何输入(在我们的例子中,我们有REST API和文件输入),然后它将对其进行索引; 它的机器学习算法将智能地提取重要字段(在键/值对中),因此您可以进行搜索,运行统计信息并可视化该数据。 Splunk有许多索引,例如,您可以搜索_internal索引以查看Splunk日志中是否有任何错误消息。
45. When we defined the REST API and file inputs, we kept the index value to default, which is the main index; so inside the Search text box, type index="main" then press Enter:
45.在定义REST API和文件输入时,我们将index值保留为default ,这是main索引; 因此,在“ Search文本框中,输入index="main"然后按Enter :

46. Splunk will magically show you all of the events (i.e. search results) that are stored in that index; notice on the left side the Selected Fields pane; this is were Splunk’s AI extracts all the key/value pairs and shows you a list of values for each key when you click on it:
46. Splunk将神奇地向您显示该索引中存储的所有事件(即搜索结果); 注意左侧的“ Selected Fields窗格; 这是Splunk的AI提取所有键/值对并在您单击时为您显示每个键的值的列表:

47. Click on host, notice that there is only has one value PartyA; and indeed, if you remember, when we defined the REST API and file inputs; we set the host value to PartyA:
47.单击host ,注意PartyA只有一个值; 确实,如果您还记得的话,当我们定义REST API和文件输入时; 我们将host值设置为PartyA :

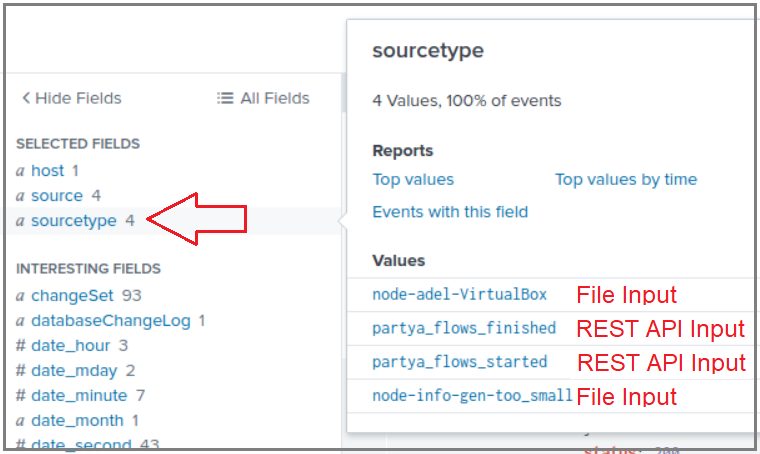
48. Now click on sourcetype, notice that it has 4 values; 2 of them are the files that exist inside the logs folder of PartyA node (those 2 files come from the file input that we defined earlier, which points to the mapped logs volume), the remaining 2 come from the REST API inputs; remember we set the source type value in their properties?
48.现在单击sourcetype ,注意它有4个值; 其中2个是存在于PartyA节点的logs文件夹中的文件(这2个文件来自我们之前定义的文件输入,该文件输入指向映射的logs卷),其余2个来自REST API输入。 还记得我们在其属性中设置source type值吗?
49. So now you can search by host (you can define inputs for PartyA, PartyB, Notary, etc…); and you can also search by sourcetype (PartyA logs, or PartyB finished workflows, etc…).
49.现在,您可以按主持人搜索(可以为PartyA , PartyB , Notary等定义输入); 你也可以通过搜索sourcetype ( PartyA日志,或PartyB完成的工作流程,等...)。
50. Inside of Search text box type index="main" sourcetype=partya_flows_started | stats latest(value) as "PartyA Started Flows", this syntax is what is known as SPL (Search Processing Language); think of it as SQL on steroids. You will notice that the command that we wrote is separated by the | operator, what that operator does is pass the results of the left-hand side command to the right-hand side command. So first we search the main index for all partya_flows_started events, and since the REST API input is polling every 30 seconds, we want the latest results; that’s why we pass the search results to stats latest(value) and we give it a meaningful name:
50.在“ Search文本框中,键入index="main" sourcetype=partya_flows_started | stats latest(value) as "PartyA Started Flows" index="main" sourcetype=partya_flows_started | stats latest(value) as "PartyA Started Flows" ,此语法称为SPL(搜索处理语言); 将其视为类固醇上SQL。 您会注意到,我们编写的命令由|分隔| 运算符,该运算符所做的就是将左侧命令的结果传递给右侧命令。 因此,首先我们在main索引中搜索所有partya_flows_started事件,并且由于REST API输入每30秒轮询一次,因此我们需要最新的结果。 这就是为什么我们将搜索结果传递给stats latest(value)并为其赋予一个有意义的名称的原因:

50. Now you can save that search so you don’t have to type it every time, and in fact that’s how I saved it to the PartyA Dashboard; I chose Save As -> Dashboard Panel, then created a new dashboard:
50.现在您可以保存该搜索,因此您不必每次都键入它,实际上,这就是我将其保存到PartyA Dashboard ; 我选择Save As -> Dashboard Panel ,然后创建一个新的仪表板:

51. Another thing that you can do is save a search as an alert, type the below command in the Search text box:
51.您可以做的另一件事是将搜索保存为警报,在“ Search文本框中键入以下命令:
index="main" sourcetype="partya_flows_started" | stats latest(value) as started
| appendcols [search index="main" sourcetype="partya_flows_finished" | stats latest(value) as finished]
| eval difference=started - finished
In the above command, first we search for the number of started flows, then the number of finished flows, and lastly calculate the difference:
在上面的命令中,首先我们搜索开始的流数,然后搜索完成的流数,最后计算差:

52. Now you can save that search as an alert, let’s say you want the alert to trigger when the difference is greater than 1; meaning there is at least one flow that started and didn’t finish:
52.现在您可以将该搜索另存为警报,假设您希望警报在差值大于1时触发; 意味着至少有一个流开始并且没有结束:

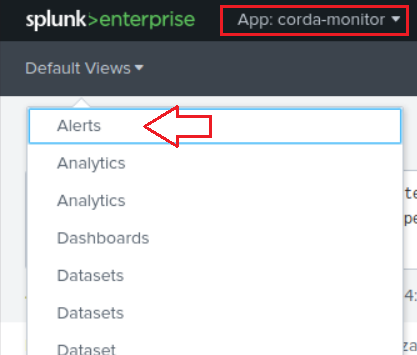
53. Actually, I already have that alert predefined in the corda-monitor app; under Default View click on Alerts then click Edit -> Edit Alert:
53.实际上,我已经在corda-monitor应用程序中预定义了该警报; 在Default View单击Alerts然后单击Edit -> Edit Alert :
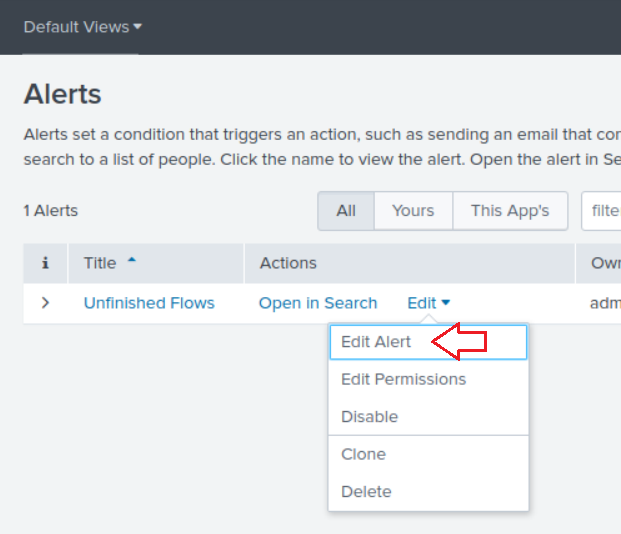
I gave the alert the name Unfinished Flows, I scheduled it to run once an hour (i.e. it will run that search once an hour) at hour:30 (e.g. 1:30, 2:30, etc…) and I set the trigger to a custom condition eval difference >= 1. You can choose many actions for the alert (e.g. send an email); I chose adding the alert to the Triggered Alerts dashboard with severity Medium:
我给警报命名为“ Unfinished Flows ,我计划将其每小时运行一次(即每小时一次运行一次搜索),时间为每小时30:30(例如1:30、2:30等),然后设置触发器到自定义条件, eval difference >= 1 。 您可以为警报选择许多操作(例如,发送电子邮件); 我选择将严重性为Medium的警报添加到Triggered Alerts仪表板:

You can test the alert by stopping PartyB node (type bye in its terminal) then run flow start ExampleFlow$Initiator iouValue: 50, otherParty: "O=PartyB,L=New York,C=US" inside of PartyA terminal; the flow will hang on Collecting Signatures step because PartyB is not reachable, so now you have a flow that started and didn’t finish; run that test closer to the 30 minutes mark of the hour because that’s when the alert is scheduled to run; once the alert runs you should be able to see it in the Triggered Alerts dashboard:
您可以通过停止测试的警报PartyB节点(类型bye在其终端),然后运行flow start ExampleFlow$Initiator iouValue: 50, otherParty: "O=PartyB,L=New York,C=US"的内部PartyA终端; 由于无法访问PartyB该流程将挂在“ Collecting Signatures步骤上,因此现在您有了一个已经开始但尚未完成的流程; 将测试运行到接近每小时30分钟的时间,因为这是警报预定运行的时间; 警报运行后,您应该能够在“ Triggered Alerts仪表板中看到它:


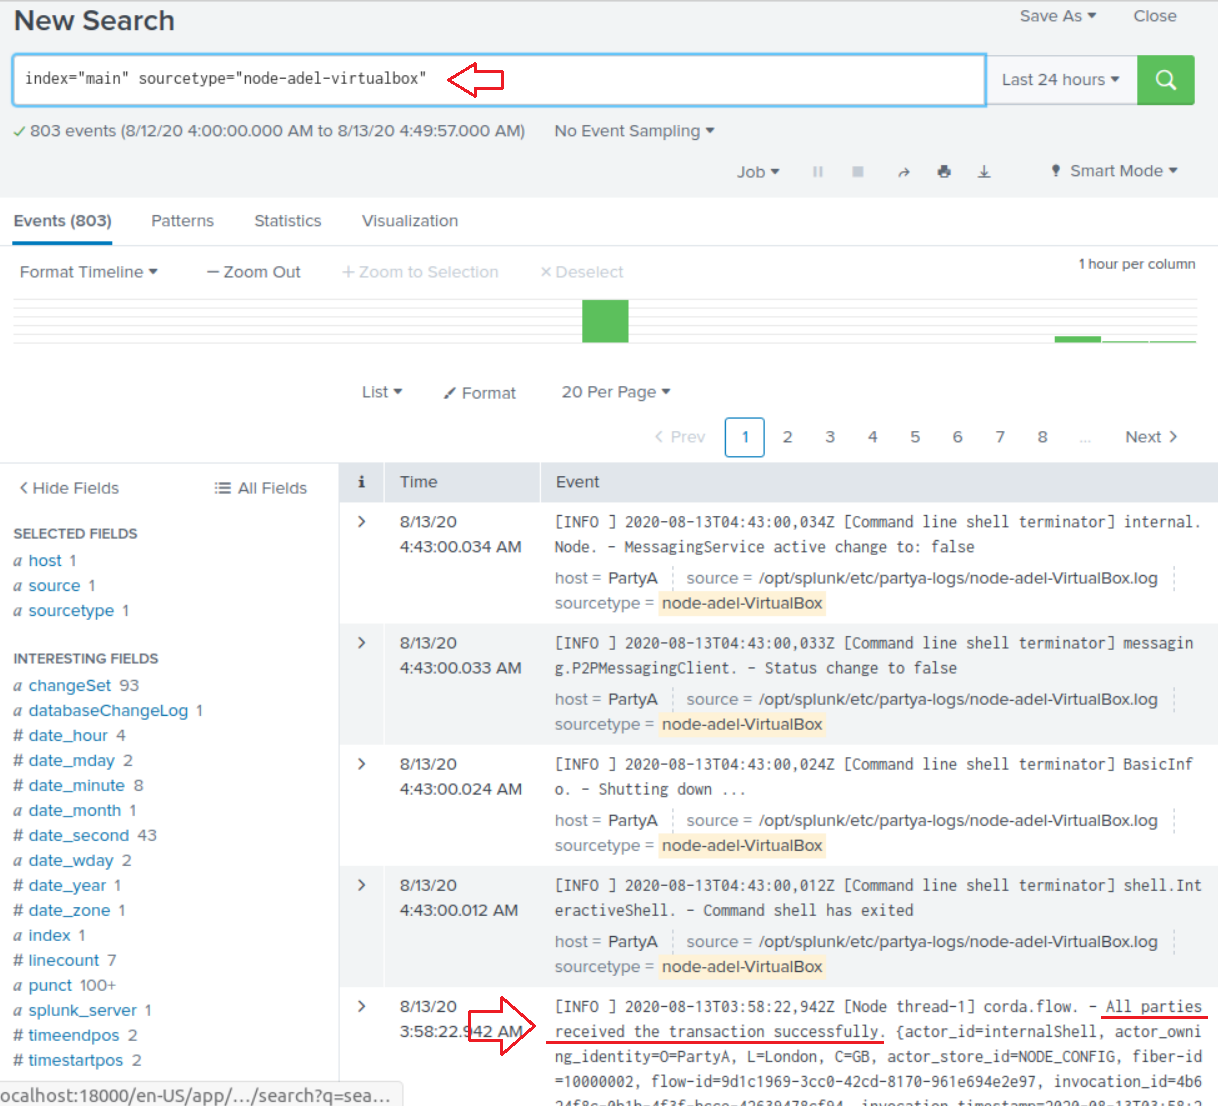
54. We focused on searching the REST API inputs, but you can also search PartyA logs (i.e the file inputs that we defined for the logs folder); for instance you can search index="main" sourcetype="node-adel-virtualbox" (the node’s log file name will be different on your machine; notice mine has adel in it), and you’ll see all the logs of PartyA node; for instance I ran a flow and I can see that all parties received the transaction successfully. Obviously you can run searches on that data, create alerts, create statistics, or visualize it:
54.我们专注于搜索REST API输入,但是您也可以搜索PartyA日志(即我们为logs文件夹定义的文件输入); 例如,您可以搜索index="main" sourcetype="node-adel-virtualbox" (该节点的日志文件名称在您的计算机上将有所不同;请注意我的其中有adel ),然后您会看到PartyA所有日志节点; 例如,我进行了一个流程,可以看到所有各方都成功收到了交易。 显然,您可以对该数据进行搜索,创建警报,创建统计信息或将其可视化:
The last step concludes exploring Splunk!
最后一步是探索Splunk!
清理 (Cleanup)
Make sure that you shutdown every Corda node properly by typing
byein its terminal.通过在终端中键入
bye,确保正确关闭每个Corda节点。Stop
Hawtioby pressingCtrl+cin its terminal.通过在终端中按
Ctrl+c来停止Hawtio。Stop Splunk by typing
docker-compose downin its terminal.通过在终端中键入
docker-compose down停止Splunk。Splunk generates a lot of files on your host machine, so make sure that you delete the generated volumes when you’re done running the demo with
docker volume prune:Splunk在主机上生成大量文件,因此请确保在使用
docker volume prune运行演示后,删除生成的卷:

结论 (Conclusion)
Corda nodes come predefined with many metrics that you can export with Jolokia and consume in Splunk.
Corda节点预定义了许多指标,您可以使用Jolokia导出这些指标并在Splunk中使用。
The purpose of this article was to show you how to connect Corda and Splunk.
本文的目的是向您展示如何连接Corda和Splunk。
Splunk is a very advanced product with many features; I’m not an expert, I merely scratched the surface of its capabilities. You can create some elaborate dashboards for the data that you pull from Corda nodes.
Splunk是具有许多功能的非常先进的产品。 我不是专家,我只是简单地介绍了它的功能。 您可以为从Corda节点提取的数据创建一些精心设计的仪表板。
翻译自: https://blog.b9lab.com/monitoring-corda-nodes-with-splunk-1ab61be38e7c
splunk 监视文件目录


 182
182

 被折叠的 条评论
为什么被折叠?
被折叠的 条评论
为什么被折叠?
 到【灌水乐园】发言


