


jone
one (Hone.jl)
Last time we left off on the work with Hone.jl, a modular, object-oriented graphing library that uses meta-programming to provide an extendable platform, we had run into quite a large sum of issues. Firstly, the grids were drawing incredibly inaccurately, making them virtually useless. This also created an additional blocker in that labels cannot be added to such a grid. Our resulting plots looked something like this:
上一次我们停止使用Hone.jl的工作时,这是一个模块化的,面向对象的图形库,该库使用元编程来提供可扩展的平台,我们遇到了很多问题。 首先,网格绘制得非常不准确,几乎没有用。 这还创建了一个附加的阻止程序,因为不能将标签添加到这样的网格中。 我们得出的图看起来像这样:
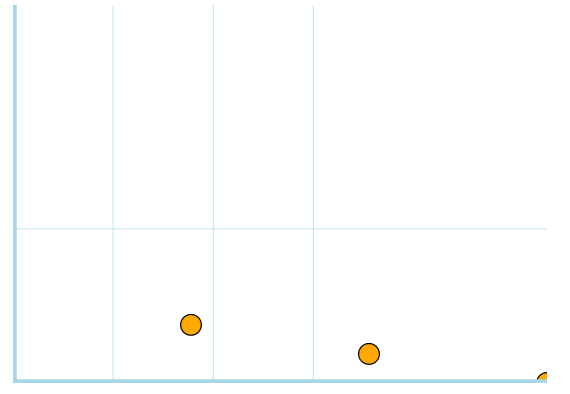
Additionally, although the points were lining up correctly with our coordinates plotted, they were certainly not lining up with our axis and grid. This is because the origin point of Compose illustrations is not where a Data-Scientist would typically think that the origin point of their graph would be. Instead, the origin of the Y axis is actually in the top left-hand corner. As a result, a point plotted for example at (5,5) would be in the top left rather than the bottom left.
另外,尽管这些点与我们绘制的坐标正确对齐,但它们肯定没有与我们的轴和网格对齐。 这是因为Compose插图的起点不在数据科学家通常认为其图形的起点所在的位置。 相反,Y轴的原点实际上在左上角。 结果,例如在(5,5)处绘制的点将在左上角而不是左下角。
Another thing that I wanted to dramatically alter about Hone is the entire way that plots are assembled. Previously, meta-expressions would be thrown together and parsed in a long and messy meta-programming mess. I wanted to change this. The entire idea of Hone revolves around being modular. In a pinch, you should easily be able to add a different grid from somewhere else, or even run a different coordinate parser for some different results. However, with the way the scatter functions are now this is simply not possible.
我想对Hone进行重大更改的另一件事是地块的组装方式。 以前,元表达式将被组合在一起,并在冗长且混乱的元编程混乱中进行解析。 我想改变这个。 Hone的整个思想围绕着模块化。 紧要关头,您应该可以轻松地从其他位置添加不同的网格,甚至可以运行不同的坐标解析器以获得一些不同的结果。 但是,现在无法使用散布函数了。
修复网格 (Fixing our grids)
Probably the most prominent and horrible issues I have been facing with Hone is the grid. The grid is drawn based on divisions of measurements with the frame, which one would suppose would be pretty simple. Here’s the math:
我在Hone面临的最突出和最可怕的问题可能就是网格。 网格是根据测量与框架的划分绘制的,这可能会非常简单。 这是数学:
function Grid(divisions,frame=Frame(1280,720,0mm,0mm,0mm,0mm),colorx=:lightblue,colory=:lightblue,thickness=.2)
    xlen = frame.width
    ylen = frame.height
    division_amountx = xlen / divisions
    division_amounty = ylen / divisions
    total = 0
    Xexpression = "(context(), "
    while total < xlen
        total = total + division_amountx
        linedraw = Line([(0,total),(xlen,total)],:lightblue,thickness)
        exp = linedraw.update(:This_symbol_means_nothing)
        Xexpression = string(Xexpression,string(exp))
    end
This is certainly code that would appear to work at first glance. First, we get the frame’s width and height and divide it by our number of divisions. After that, we iteratively add each expression for each line until we reach the width or height of the frame. We do this in a while loop, of course, which holds the control flow while the total is less than the width or height of the corresponding frame.
乍一看,这肯定是可行的代码。 首先,我们获取框架的宽度和高度,然后将其除以划分数。 在那之后,我们迭代地为每行添加每个表达式,直到达到框架的宽度或高度。 当然,我们在while循环中执行此操作,该循环保留控制流,而总数小于相应框架的宽度或高度。
So what’s the issue?
那是什么问题呢?
I think the real problem here really goes to demonstrate how a very minor inconsistency or issue can create a really big problem in the future. The division amount for the X axis is calculated by dividing the width by the number of divisions in the grid. The problem here is that the X grid lines correspond with the lines that would represent values on the Y axis, and exactly the opposite is true for the Y lines. How could we fix this? Although it might be confusing at times, this can be fixed by simply reversing our X’s and Y’s
我认为,这里真正的问题确实是要证明一个很小的矛盾或问题将来会如何造成一个很大的问题。 X轴的分割量是通过将宽度除以网格中的分割数而得出的。 这里的问题是X网格线与代表Y轴上的值的线相对应,而Y线恰好相反。 我们该如何解决? 尽管有时可能会造成混淆,但可以通过简单地反转我们的X和Y来解决此问题。
function Grid(divisions,frame=Frame(1280,720,0mm,0mm,0mm,0mm),colorx=:lightblue,colory=:lightblue,thickness=.2)
xlen = frame.width
ylen = frame.height
division_amountx = ylen / divisions
division_amounty = xlen / divisions
total = 0
Xexpression = "(context(), "
while total < xlen
total = total + division_amountx
linedraw = Line([(0,total),(xlen,total)],:lightblue,thickness)
exp = linedraw.update(:This_symbol_means_nothing)
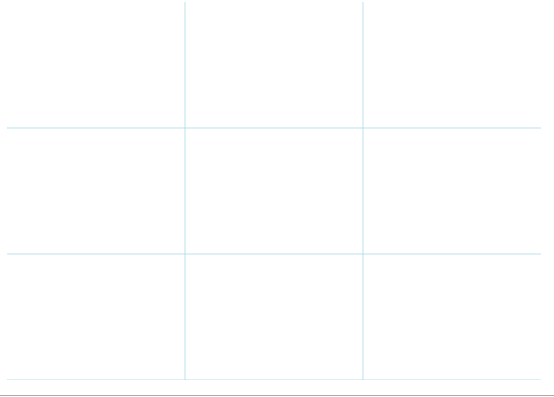
Xexpression = string(Xexpression,string(exp))Likewise, we will need to follow this idea when we approach the challenge of creating labels for the grid. All that is changed in this example is that the ylen is divided in the division_amount X, and the xlen is divided in the division_amount Y. As a result, we have a beautiful grid that looks like this:
同样,当我们面对为网格创建标签的挑战时,我们将需要遵循这个想法。 在此示例中所做的全部更改是,将ylen分为divide_amount X,将xlen分为divide_amountY。结果,我们得到了一个漂亮的网格,如下所示:
网格标签 (GridLabels)
The next type that I wanted to create, now that we have working Grids and Label types is of course labels for the X and Y axis. We will start with parameters. We have two choices for getting grid positions, we could either
现在我们要创建的下一个类型是网格和标签类型,当然是X和Y轴的标签。 我们将从参数开始。 我们有两种选择来获取网格位置,我们可以
- save them in the Grid type 将它们保存为网格类型
- or calculate them again. 或再次计算。
While saving them into the grid type might give us some ease of use in terms of parameters, I believe it will make it much more difficult to implement more custom features in the future. Part of the problem with doing something like that is that GridLabels isn’t meant to be a wrap-up function that combines many elements into a frame, but rather a feature that can be added or removed from a frame. In that regard, it is more similar to many of the methods that fall into the HDraw.jl file, rather than the HPlot.jl file. Our Grid Labels are also going to need our x and y values in order to generate the labels themselves.
尽管将它们保存为网格类型可能使我们在参数方面易于使用,但我相信将来将很难实现更多自定义功能。 这样做的部分问题是GridLabels并不是要作为将许多元素组合到框架中的包装函数,而是可以在框架中添加或删除的功能。 在这方面,它与属于HDraw.jl文件而不是HPlot.jl文件的许多方法更相似。 我们的网格标签还需要x和y值才能自行生成标签。
function GridLabels(x,y,grid,buffer=20)
    frame = grid.frame
    xvals = grid.xvals
    yvals = grid.yvals
    topy = maximum(y)
    topx = maximum(x)
    tag = "(context(), "
We can obtain the frame, which we will need for some calculations from the grid type. In my original version of this function, I decided to try and store the values for the grid’s positions in the type:
我们可以获得框架,我们需要根据网格类型进行一些计算。 在此函数的原始版本中,我决定尝试将网格位置的值存储为以下类型:
for value in xvals
        lbl = value / frame.height * topy
        grlbl = Label(string(lbl),buffer - 5, value)
        tag = string(tag,grlbl.tag)
    end
    for value in yvals
        lbl = value / frame.width * topx
        grlbl = Label(string(lbl),value, buffer - 5)
        tag = string(tag,grlbl.tag)
    end
    tag = string(tag,")),")
    composition = Meta.parse(tag)
    show() = eval(composition)
    ()->(tag;xtags;show)
This was done by getting the percentage of the value in reference to the frame’s height, which the grid’s mathematics are based off of. It’s important to remember that ever object’s position in Hone is directly proportional to the frame on top of it, just like in most graphics work. We then multiply this percentage by the highest value in topx. In the example of having four grid-lines, we would then have .25 incrementally up to 1 each multiplied by the maximum value in our data for the labels, and the highest value in our resolution for our position. However, I found that storing data like this in the Grid type created a lot more problems than solutions.
这是通过获取相对于框架高度的值的百分比来完成的,网格的数学基础是该高度。 重要的是要记住,就像在大多数图形作品中一样,对象在Hone中的位置与它上方的框架成正比。 然后,我们将该百分比乘以topx中的最大值。 在具有四个网格线的示例中,我们将以.25为增量递增至1,每个乘以标签数据中的最大值,再乘以位置分辨率中的最高值。 但是,我发现以Grid类型存储这样的数据比解决方案产生了更多的问题。
In my second revision, however, I revised that idea and created something a little better:
但是,在我的第二次修订中,我修改了这个想法并创建了一些更好的东西:
function GridLabels(x,y,grid,label = "X",buffer=20)
   frame = grid.frame
    divamountx = grid.division_amountx
    total = divamountx
    topx = maximum(x)
    topy = maximum(y)
    xlabels = []
    while total < (divamountx * grid.divisions)
        percentage = frame.height / total
        curr_label = topx * percentage
        push!(xlabels,(curr_label, total))
        total += divamountx
        print(total)
    end
    xtags = ""
    for (key,data) in xlabels
        textlabel = Label(string(round(key)), 40 , data, "", 3)
        xtags = string(xtags, textlabel.tag)
    end
    tag = xtags
    ()->(tag;xtags)
end
The final product will be revealed after I explain my frustration with one more issue with the Hone library…
在我对Hone库的另一个问题感到沮丧之后,最终产品将揭晓。
非模块化绘图 (Non-Modular Plotting)
If you’ve ever taken a small peek at the scatter functions in Hone, and understood that some of the code in them were directly contradictory to the methodology behind Hone, then you most certainly weren’t alone. Rather than having functions to do things like parse coordinates or add lines to plots, I thought it would be a brilliant idea to instead hard-code snippets into functions one at a time to do so. Visit exhibit A:
如果您曾经窥视过Hone中的分散函数,并且了解到其中的某些代码与Hone背后的方法直接矛盾,那么您肯定并不孤单。 我认为不是让函数执行诸如解析坐标或向绘图添加线之类的功能,而是一次将代码片段硬编码为一个函数,这是一个绝妙的主意。 参观展览品A:
The _arrayscatter function.
_arrayscatter函数。
function _arrayscatter(x,y,shape=Circle(.5,.5,25),
        features = [Grid(3), Axis(:X), Axis(:Y)],
        frame=Frame(1280,720,0mm,0mm,0mm,0mm),
        buffer = 90)
    fheight = frame.height - buffer
    fwidth = frame.width - buffer
    topx = maximum(x)
    topy = maximum(y)
    expression = string("")
    # Coordinate parsing -------
    for (i, w) in zip(x, y)
        inputx = (i / topx) * fwidth
        inputy = (w / topy) * fheight
        exp = shape.update(inputx,inputy)
        expression = string(expression,string(exp));
    end
    points = transfertype(expression);
    frame.add(points);
    for feature in features
        frame.add(feature);
    end
    composition = eval(expression);
    show() = frame.show()
    tree() = introspect(composition)
    save(name) = draw(SVG(name), composition);
    get_frame() = frame
    add(obj) = frame.add(obj)
    (var)->(show;composition;tree;save;get_frame;add;x;y;points)
end
Not only is this function a little ugly, it requires its own unique type in order to transmit its own tag into the frame. Rather than being a collection of objects generated automatically with inputs, it is itself some objects with a collection of objects serving alongside it. In the context of Hone.jl, and what the very idea of Hone.jl is; this just doesn’t make any sense. My first action took against such a thing was to create an entirely seperate function to create Axis types:
该功能不仅有点丑陋,而且还需要其自己的唯一类型才能将其自身的标签传输到帧中。 它本身不是一些通过输入自动生成的对象的集合,而是一些带有在其旁边服务的对象集合的对象。 在Hone.jl的上下文中,Hone.jl的真正思想是什么; 这只是没有任何意义。 我反对这种事情的第一步是创建一个完全独立的函数来创建Axis类型:
function Axis(orientation=:X, axiscolor = :gray, frame=Frame(1280,720,0mm,0mm,0mm,0mm), buffer = 90)
    if orientation == :X
        pairs = [(buffer,frame.height - buffer), (frame.width,frame.height - buffer)]
    else orientation == :Y
        pairs = [(buffer,0),(buffer, frame.height - buffer)]
    end
    axis = Line(pairs,axiscolor)
    tag = axis.update([pairs])
    (var)->(tag)
end
That was relatively straightforward! Next, I decided to do the same thing with the coordinates in order to slim down the function even further.
那是相对简单的! 接下来,我决定对坐标执行相同的操作,以进一步缩小功能。
function Points(x, y, frame=Frame(1280,720,0mm,0mm,0mm,0mm), buffer = 90, shape=Circle(.5, .5, 25))
    fheight = frame.height - buffer
    fwidth = frame.width - buffer
    topx = maximum(x)
    topy = maximum(y)
   tag = string("")
    # Coordinate parsing -------
    for (i, w) in zip(x, y)
        inputx = (i / topx) * fwidth
        inputy = (w / topy) * fheight
        exp = shape.update(inputx,inputy)
        tag = string(tag,string(exp))
    end
    tag = string(tag)
    show() = eval(Meta.parse(string("compose(context(), ", tag,")")))
    (var) -> (tag)
end
After all of that copy and pasting and slight refactoring, we have a cute little function that looks like this:
在完成所有复制粘贴和轻微重构之后,我们有了一个可爱的小函数,如下所示:
function _arrayscatter(x, y,
        shape=Circle(.5,.5,25),
        features = [Grid(3), Axis(:X), Axis(:Y)],
        buffer = 90,
        frame=Frame(1280,720,0mm,0mm,0mm,0mm),
        )
    points = Points(x, y, frame, buffer, shape)
    frame.add(points)
    for feature in features
        frame.add(feature);
    end
    show() = frame.show()
    tree() = introspect(composition)
    save(name) = draw(SVG(name), composition);
    get_frame() = frame
    add(obj) = frame.add(obj)
    (var)->(show;composition;tree;save;get_frame;add;x;y;points)
end
I like this because it focuses a lot more on the objects as objects and the frame as a holder for the objects, rather than the entire array scatter being our composition of objects smashed into meta-expressions with other types alongside it. With these solutions, I did also notice another issue revealing itself. If you recall, the origin point for Compose is most certainly not where you would expect it to be. Rather than being in the bottom left, it is in the top left. As a result, many of our y coordinates are reversed, and thus do not match up with our new grid labels.
我之所以喜欢它,是因为它把更多的精力放在作为对象的对象上以及作为对象保持器的框架上,而不是整个数组分散,因为我们将对象的组成与其他类型一起粉碎成元表达式。 有了这些解决方案,我也注意到了另一个暴露出来的问题。 如果您还记得的话,Compose的起点肯定不是您期望的起点。 而不是在左下方,它在左上方。 结果,我们的许多y坐标都被反转了,因此与我们的新网格标签不匹配。
To fix this, I simply subtracted our new value by the height and used it as our input y.
为了解决这个问题,我只用高度减去新值并将其用作输入y。
function Points(x, y, frame=Frame(1280,720,0mm,0mm,0mm,0mm), buffer = 90, shape=Circle(.5, .5, 25))
    fheight = frame.height - buffer
    fwidth = frame.width - buffer
    topx = maximum(x)
    topy = maximum(y)
   express = string("")
    # Coordinate parsing -------
    for (i, w) in zip(x, y)
        inputx = (i / topx) * fwidth
        inputy = (w / topy) * fheightinputy = fheight - inputy
        println(inputx)
        println(inputy)
        exp = shape.update(inputx,inputy)
        express = string(express,string(exp))
    end
    tag = express
    show() = eval(Meta.parse(string("compose(context(), ", tag,")")))
    (var)->(tag;show)
end
结论 (Conclusion)
After all of this great work done to the Hone library, I am excited to reveal to you the new default plot as of version 0.0.5!
在对Hone库进行了所有出色的工作之后,我很高兴向您展示从0.0.5版开始的新默认图!
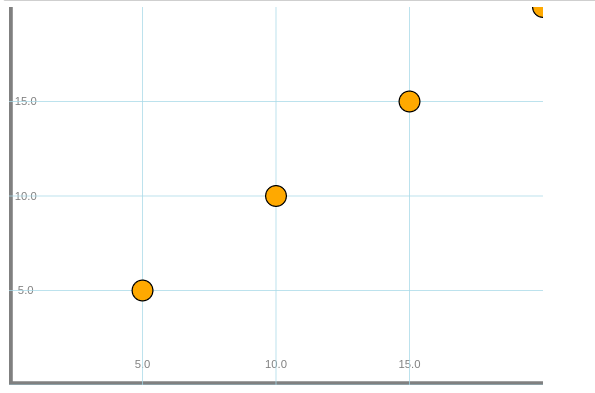
In my personal opinion, the improvement here is beyond dramatic. Firstly, we have data accurately represented, not upside-down, not in the wrong place. The X and Y for this visualization are both [5,10,15,20], which is precisely what the plot reads. On top of that, we can actually see where we are in location around the actual data with our new straight grid and grid-labels!
我个人认为,这里的改进是巨大的。 首先,我们可以准确地表示数据,而不是上下颠倒,而且位置不正确。 此可视化的X和Y均为[5,10,15,20],正好是该图读取的内容。 最重要的是,我们可以使用新的直线网格和网格标签实际看到我们在实际数据周围的位置!
I am incredibly excited with where Hone.jl is now, and where it is going to be very shortly! There is a lot of work to do, but I am hoping that the base of the graphing architecture is very near being done, and all of my work-around bug fixes aren’t going to need to exist anymore! (In a perfect world.) Regardless of the occasional difficulty, I have learned a lot from this project and I am very excited to see its effectiveness in mine as well as other’s usage of it!
我对Hone.jl现在的位置以及即将到来的位置感到非常兴奋! 有很多工作要做,但我希望图形架构的基础即将完成,并且不再需要解决所有解决方法的错误! (在一个完美的世界中。)尽管偶尔遇到困难,但我从该项目中学到了很多东西,我很高兴看到它在我的项目中的有效性以及其他人的使用!
翻译自: https://towardsdatascience.com/metaprogramming-grids-and-labels-for-hone-jl-f434c8dc24ad
jone


 885
885


 被折叠的 条评论
为什么被折叠?
被折叠的 条评论
为什么被折叠?
 到【灌水乐园】发言


