


数据探索性分析
As a part of the Flatiron School bootcamp requirements, we are required to complete a project at the end of each learning module that demonstrates our ability to apply what we’ve learned.
作为Flatiron学校训练营要求的一部分,我们需要在每个学习模块的末尾完成一个项目,以证明我们能够应用所学知识。
The prompt for the first project is as follows:
第一个项目的提示如下:
Microsoft希望进入电影行业,但是他们没有该行业的先验知识,因此需要帮助才能使他们的电影制片厂取得成功。 (Microsoft wants to enter into the movie industry, however they have no prior knowledge of the industry and they need help so that their movie studio can be successful.)
The primary skills that required to perform the exploratory data analysis (EDA) of the movie industry included: webscraping, storing and cleaning the data in a pandas dataframe, and visualization of data using seaborn and matplotlib. I’ll describe some of the methodology I used for webscraping and cleaning, and I’ll go through some of the recommendations we made in order to be successful as a movie studio.
电影业进行探索性数据分析(EDA)所需的主要技能包括:在熊猫数据框中进行爬网,存储和清理数据,以及使用seaborn和matplotlib可视化数据。 我将描述一些我用于网络抓取和清理的方法,并且我将介绍为使电影制片厂成功而提出的一些建议。
网页抓取 (Webscraping)
I was unfamiliar with webscraping prior to the bootcamp, but I can say without a doubt it has been one of the most useful and fun skills that I have learned in the past few weeks. Web Scraping is essentially the process of looking at the HTML for a webpage and deconstructing that HTML so that you can extract pertinent information for analysis. By using the requests and Beautiful Soup libraries we can easily get all of the html into a Jupyter notebook and start picking apart the pieces. Some of the websites we used to develop recommendations were moviefone.com, imdb.com, and boxofficemojo.com. For example, this page had movie release dates for movies released in 2019 so I ended up writing code like this:
在开始训练营之前,我并不熟悉网络爬虫,但是毫无疑问,这是我在过去几周学到的最有用,最有趣的技能之一。 Web爬网本质上是查看网页HTML并对HTML进行解构的过程,以便您可以提取相关信息进行分析。 通过使用请求和Beautiful Soup库,我们可以轻松地将所有html放入Jupyter笔记本中,并开始分拆。 我们用来制定建议的一些网站是moviefone.com , imdb.com和boxofficemojo.com 。 例如,此页面具有2019年发行电影的电影发行日期,因此我最终编写了如下代码:
movies_= requests.get("https://www.moviefone.com/movies/2019/?     page=1")
soup = BeautifulSoup(movie_dates_page.content,'lxml')
movie_title = soup.find_all("a", class_="hub-movie-title")
Then I simply use the .text method of each of the elements in the movie_title variable and I can get each of the movie titles on that webpage into a list. I use a similar method as the one shown above to get all of the release dates into a list. The two lists can then be put into a dataframe and the dates column can be manipulated using the datetime library so that we can count the number of movies released in a certain month or on a certain day. The construction of the dataframe would look something like this:
然后,我仅使用movie_title变量中每个元素的.text方法,就可以将该网页上的每个电影标题放入一个列表中。 我使用与上面显示的方法类似的方法来将所有发布日期收集到列表中。 然后,可以将这两个列表放入一个数据帧中,并且可以使用datetime库操作date列,以便我们可以计算在特定月份或特定日期上映的电影数量。 数据框的结构如下所示:
movie_dict = {'movies':movie_list, 'release_date':dates_list}
dates_df = pd.DataFrame(data=movie_dict)#movie_list and dates_list are previously constructed lists from #webscraping
For this particular project, it was easiest to decide which elements of the webpage would be most useful for EDA and then define a function to scrape those elements and construct the dataframe. A good rule of thumb when webscraping is to use a sleep timer in between the scraping of each page. Making repeated calls to a webpage can run the risk of being banned from a website because those repeated calls can cause lots of traffic.
对于这个特定项目,最简单的方法是确定网页的哪些元素对EDA最有用,然后定义一个函数来抓取这些元素并构造数据框。 抓网时的一个好的经验法则是在抓取每页之间使用一个睡眠计时器。 重复呼叫网页可能会有被网站禁止的风险,因为这些重复呼叫会引起大量流量。
数据清理 (Data Cleaning)
After scraping various data from different webpages and compiling the data into a dataframe, the next step was to clean the data. Fortunately, many of the websites structured their movie data in a way that made cleaning relatively simple. Using string methods like .replace() were used to remove commas and dollar signs from budgets and profits so that the .astype()pandas method could be used to convert the number from a string to an integer.
从不同的网页上抓取各种数据并将数据编译成数据框后,下一步就是清理数据。 幸运的是,许多网站以使清理相对简单的方式来构造其电影数据。 使用.replace()类的字符串方法可从预算和利润中删除逗号和美元符号,因此.astype() pandas方法可用于将数字从字符串转换为整数。
Using the example describe above for the movies dates dataframe, the creation of new columns using the datetime library would look like this:
使用上面针对电影日期数据帧描述的示例,使用datetime库创建新列的过程如下所示:
import datetime as dtdates_df['release_date'] = pd.to_datetime(movie_releases_df['release_date'], format='%B %d, %Y')dates_df['release_month'] = dates_df['release_date'].map(lambda z: z.strftime('%B'))
dates_df['release_day'] = dates_df['release_date'].map(lambda z: z.strftime('%A'))dates_df['release_year'] = dates_df['release_date'].map(lambda z: z.strftime('%Y'))
dates_df['release_year'] = dates_df['release_year'].astype(int)
The most difficult cleaning came from scraping a table on a Wikipedia page containing data about movies, their Oscar nominations and subsequently won awards. Although the number of nominations and awards were listed in their own separate columns there were instances where a specific entry had a footnote that was considered text by Beautiful Soup. There were only 11 movies where a footnote occurred so it wasn’t a huge burden to correct manually in the dataframe. However, it is worth noting that you should keep an eye out for messy data so that you can develop an appropriate method to clean that data. Had there been hundreds or thousands of rows, then it would have required a more robust solution so that you wouldn’t be manually cleaning data line by line.
最困难的清理工作是在Wikipedia页面上刮擦一张桌子,其中包含有关电影,其奥斯卡提名以及随后获得奖项的数据。 尽管提名和奖项的数量在其各自的单独列中列出,但在某些情况下,特定条目的脚注被Beautiful Soup视为文本。 只有11部电影出现了脚注,因此在数据框中手动进行校正并不是一个巨大的负担。 但是,值得注意的是,您应该注意混乱的数据,以便可以开发适当的方法来清理该数据。 如果有成百上千的行,那么它将需要一个更强大的解决方案,这样您就不会逐行手动清理数据。
关于成功的电影制片厂的建议 (Recommendations for a Successful Movie Studio)
There were several questions we decided to tackle for this project and I’ll leave a link to my GitHub repo below for those who would like to see the entirety of the project. I’ll go through two of the questions/recommendations for this blog.
我们决定为这个项目解决几个问题,对于那些希望了解整个项目的人,我将在下面留下我的GitHub存储库的链接。 我将针对此博客进行两个问题/推荐。
Question 1: How much should you spend to make a successful movie?
问题1:制作一部成功的电影应该花多少钱?
In order to answer this question we chose to only look at movie data that had a profit greater than zero. All budgets, revenues, and profits were adjusted for inflation by using an average inflation rate of 3.22%. Using seaborn, I created a scatter plot to see if I could identify any trends.
为了回答这个问题,我们选择仅查看利润大于零的电影数据。 所有预算,收入和利润均根据平均通货膨胀率3.22%进行了通货膨胀调整。 使用seaborn,我创建了一个散点图,以查看是否可以识别任何趋势。
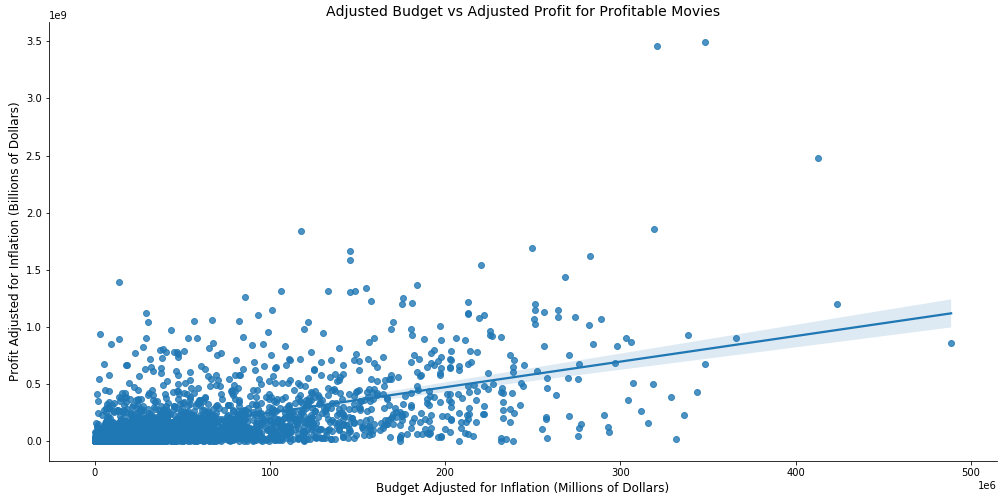
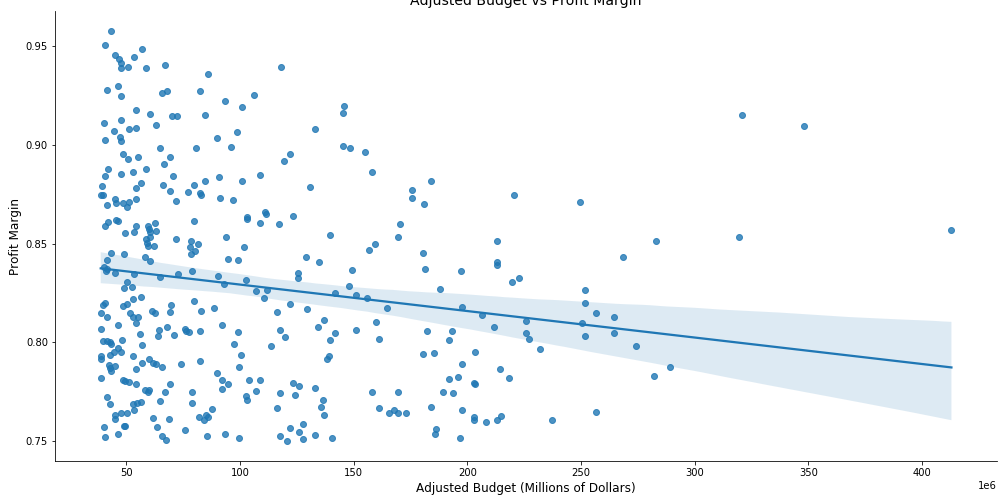
We can see from the plot above that trend line is positive leading us to believe that if we spend more money than we can make more money. However, this plot alone is not enough to make a determination. The plot below shows profitable movie budgets versus their profit margin. Here this scatterplot shows a negative trendline which cautions against spending too much money as you run the risk of reducing the profit margin.
从上面的图可以看出,趋势线是正的,这使我们相信,如果我们花的钱超过我们可以赚到的钱。 但是,仅凭此图还不足以确定。 下图显示了有利可图的电影预算与它们的利润率。 此散点图显示了一个负趋势线,当您冒降低利润率的风险时,请注意不要花太多钱。
So how is it that we decided upon an appropriate move budget? We decided to look at the profit margins of the top 25 most profitable movies ever made and use the median profit margin as a target for success. We chose to use the median due to the fact that there are extreme outliers that would make the mean less reliable as a measure of central tendency (Titanic, Avatar, and Avengers: Endgame would be unrealistic goals for a company making their first foray into the movie industry).
那么,我们如何确定合适的搬家预算呢? 我们决定查看有史以来最赚钱的25部电影的利润率,并将利润率中位数作为成功目标。 我们之所以选择使用中位数,是因为以下事实:存在极端的离群值,会使均值的可靠性不如衡量中心趋势(泰坦尼克号,阿凡达(Avatar)和复仇者联盟(Avengers):对于一家首次涉足这一领域的公司,Endgame是不现实的目标。电影业)。
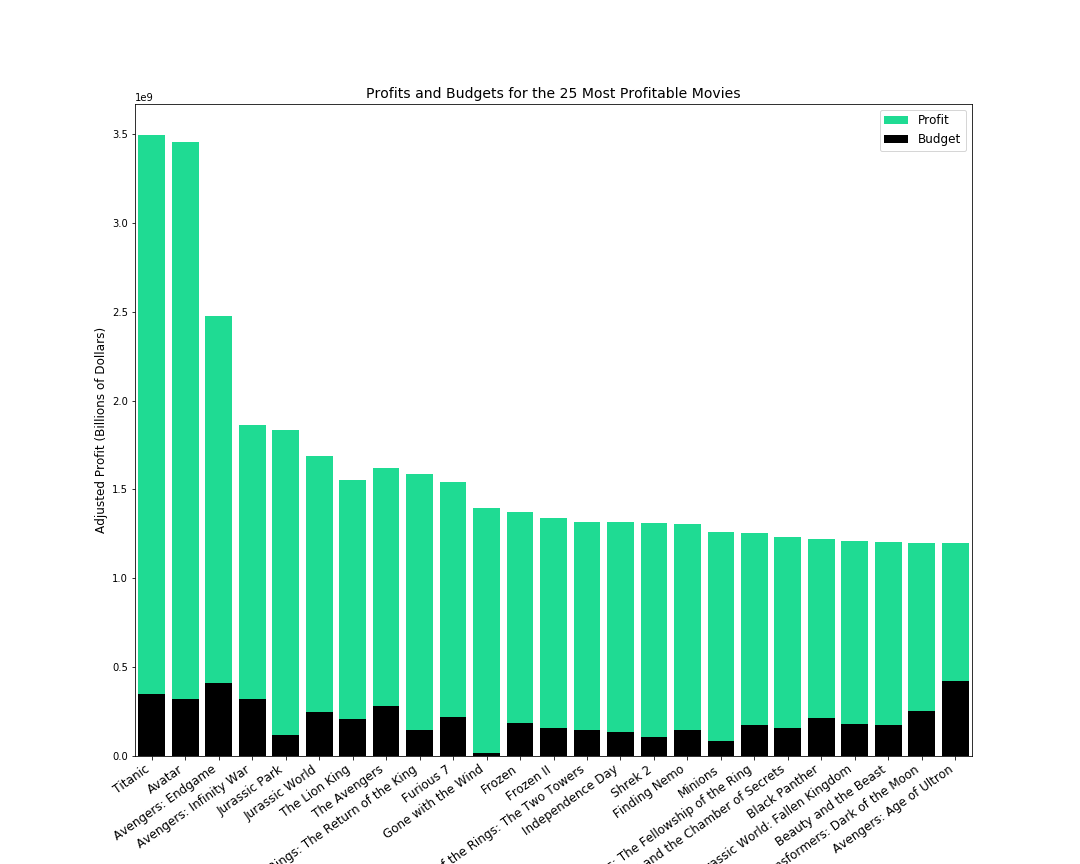
We found that the median profit margin was 0.84 and we chose to make a recommendation to spend $82,500,000 on a movie as that correlated with a profit margin around 0.8. A budget of $82,500,000 was a significantly smaller budget than that of the top 25 most profitable movies (those budgets were around $200 million). Therefore, we determined it was possible to spend significantly less while making a movie that could have a profit margin that could compete with some of the most successful movies ever made.
我们发现利润率的中位数为0.84,我们选择建议在电影上花费82,500,000美元,因为这与0.8左右的利润率相关。 82,500,000美元的预算比最赚钱的前25部电影(预算大约2亿美元)要小得多。 因此,我们确定制作一部电影的利润率可以与有史以来最成功的电影相抗衡,从而可以大幅度减少花费。
Question 2: Which actors and directors bring the most value to a movie?
问题2:哪些演员和导演为电影带来最大价值?
If we know how much money we should spend on a movie, it stands to reason we should also know who we should hire to act and direct in that movie so that we can maximize profits. In order to determine who brought the most value to a movie we created our own statistic called Value Above Replacement (VAR). For fans of baseball, this is our own watered down version of the WAR statistic. The math behind VAR is simple: if across all movies the average net profit is 100 dollars and the average net profit of movies from ‘Actor: X’ is 200 dollars he/she would have a VAR of 2. This number represents X times over the average. We used a minimum cutoff value of 10 movies for actors and 5 movies for directors.
如果我们知道我们应该花多少钱去买一部电影,那是有道理的,我们还应该知道我们应该雇用谁来执导和指导这部电影,以使我们获得最大的利润。 为了确定谁给电影带来了最大的价值,我们创建了自己的统计数据,称为替代价值(VAR)。 对于棒球迷来说,这是WAR统计信息的精简版。 VAR背后的数学运算很简单:如果在所有电影中,平均净利润为100美元,而来自“演员:X”的电影的平均净利润为200美元,则他/她的VAR为2。平均。 对于演员,我们使用了至少10部电影的临界值;对于导演,我们使用了5部电影的最低临界值。
The movie data used to calculate VAR came from imdb.com and the code we used to calculate VAR is below:
用于计算VAR的电影数据来自imdb.com,而我们用于计算VAR的代码如下:
actor_counts = actors_df['value'].value_counts()
actor_list = actor_counts[actor_counts >= 10].index.tolist()
actors_df = actors_df[actors_df['value'].isin(actor_list)]actor_total = actors_df.groupby(['value'],  as_index=False)['Net Profit'].mean().sort_values(by='Net Profit', ascending=False)actor_total['VAR'] = (actor_total['Net Profit']/actor_total['Net Profit'].mean())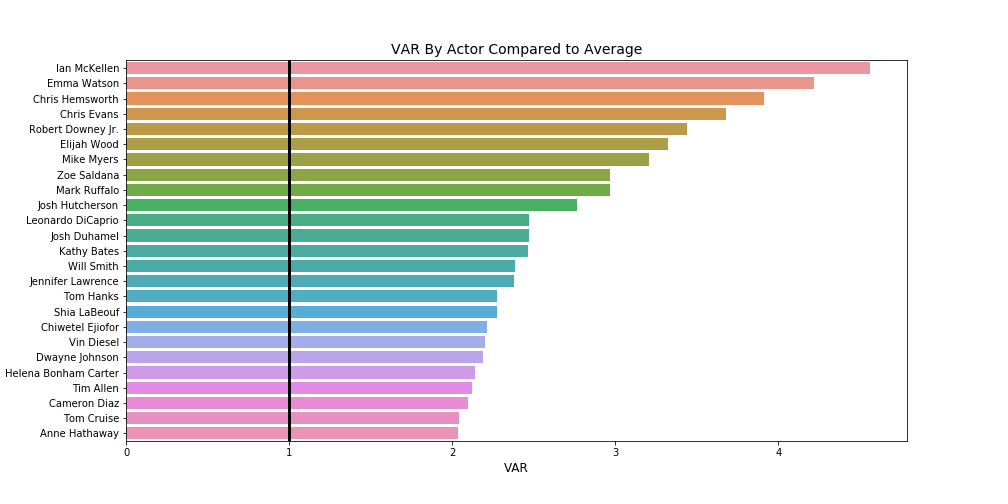
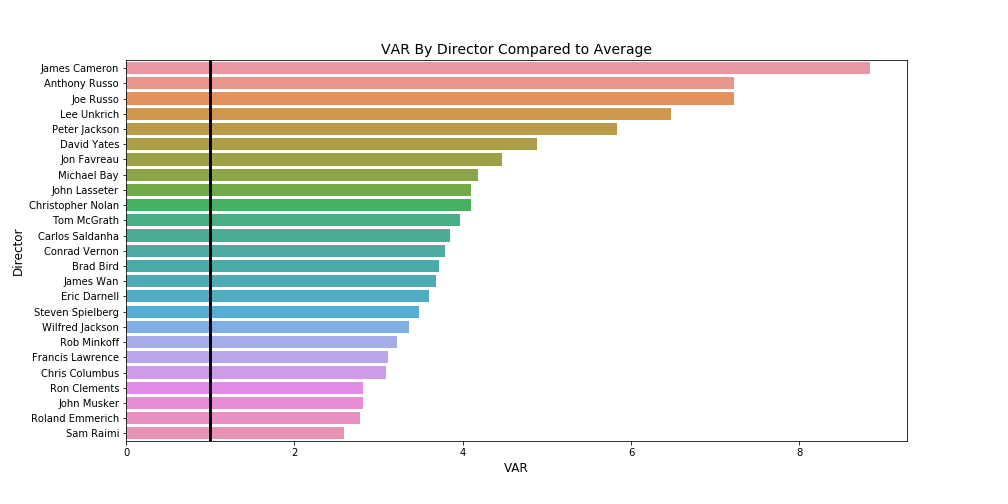
We see that directors tend to have higher VARs compared to actors which certainly helps in determining how you should budget for your personnel.
我们发现,与演员相比,导演的VAR通常更高,这无疑有助于确定您应如何为员工预算。
We also explored other topics :
我们还探讨了其他主题:
- How much should you spend to make an Oscar winning movie? 您应该花多少钱制作一部获得奥斯卡奖的电影?
- What time of the year should you release a movie? 您应该在一年中的什么时候上映电影?
- Which genres are the most profitable? 哪些类型最赚钱?
- Which studios should we look to emulate for best practices? 我们应该模仿哪些工作室以获得最佳实践?
下一步 (Next Steps)
Given that we only used exploratory data analysis for this project, there are are many more steps we could take in order to try and make more accurate recommendations. The amount of data we collected could certainly allow us to try and create some linear regression models to try and predict profits based upon one or more inputs. We could use simple linear regression to predict profit based on budget or use multiple linear regression and choose several inputs such as budgets, release month, actors, directors, and awards won. Variables like release month, actors, and directors would be categorical variables while budget would serve as a continuous variable. Obviously by reviewing the scatter plots above, we would first need to make sure our data satisfies certain assumptions before attempting to build a model. It would also be beneficial to research and collect data about streaming services to see if there are greater returns from streaming versus the traditional box office. Box office data post-pandemic will certainly prove valuable as movie studios make decisions to recover or adjust as they attempt to insulate themselves from future economic downturns.
鉴于我们仅对该项目使用了探索性数据分析,因此我们可以采取更多步骤来尝试提出更准确的建议。 我们收集的数据量当然可以使我们尝试创建一些线性回归模型,以基于一个或多个输入来尝试预测利润。 我们可以使用简单的线性回归来基于预算预测利润,也可以使用多个线性回归并选择多个输入,例如预算,发布月份,演员,导演和获得的奖励。 发行月份,演员和导演等变量是分类变量,而预算则是连续变量。 显然,通过查看上面的散点图,我们首先需要确保我们的数据满足某些假设,然后再尝试建立模型。 研究和收集有关流媒体服务的数据,以查看与传统票房相比,流媒体能否带来更大的回报也将是有益的。 大流行之后的票房数据肯定会证明是有价值的,因为电影制片厂在试图使自己与未来的经济衰退保持隔离时,做出恢复或调整的决定。
This was a great project for understanding the beginning of the data science process and practicing various coding skills. I’ll definitely look to revisit some of this data once I’ve gained more data science skills so that I can refine and improve upon the previous recommendations!
对于理解数据科学过程的开始和练习各种编码技能而言,这是一个伟大的项目。 一旦获得了更多的数据科学技能,我肯定会希望重新访问其中的一些数据,以便我可以改进和改进先前的建议!
GitHub: https://github.com/jeremy-lee93/dsc-mod-1-project-v2-1-onl01-dtsc-pt-052620
GitHub: https : //github.com/jeremy-lee93/dsc-mod-1-project-v2-1-onl01-dtsc-pt-052620
Youtube Presentation: https://youtu.be/C9YgIYwHaIQ
YouTube演示: https : //youtu.be/C9YgIYwHaIQ
翻译自: https://medium.com/@jalee93/exploratory-data-analysis-with-movies-3f32a4c3f2f3
数据探索性分析


 1万+
1万+


 被折叠的 条评论
为什么被折叠?
被折叠的 条评论
为什么被折叠?
 到【灌水乐园】发言


