


In my latest video, I analyzed the impacts of the popular YouTube series Content Cop, and the journey of actually acquiring the data I needed for this was much longer than anticipated. In this post, I’ll explain how to scrape subscription and views data for a YouTube channel so you don’t have to go through the same frustrations that I did.
在我的最新视频中,我分析了受欢迎的YouTube系列Content Cop的影响,而实际获取所需数据的过程比预期的要长得多。 在这篇文章中,我将说明如何抓取订阅和查看YouTube频道的数据,这样您就不必再经历与我同样的挫败感了。
If you’ve ever used the YouTube API, you’ll know that you can only get current subscription numbers from it — you cannot go back in time or fetch historical subscription data with the API. Now, you could build your own database and update it daily with API calls. Or, you can take advantage of the fact that SocialBlade has already done this, and scrape your data from the third party website.
如果您曾经使用过YouTube API,就会知道只能从中获取当前的订阅号-您无法使用API来回溯或获取历史订阅数据。 现在,您可以构建自己的数据库并每天通过API调用对其进行更新。 或者,您可以利用SocialBlade已经这样做的事实,然后从第三方网站上抓取您的数据。
However, there are two pitfalls that you might fall into when using SocialBlade. The first is that it only makes data from the last 3 years publicly available, in order to be compliant with GDPR. The second is that in late 2019, it changed which data is available in accordance with YouTube changing what is available through their API .
但是,在使用SocialBlade时可能会遇到两个陷阱。 首先是为了符合GDPR,它仅公开提供过去三年的数据。 第二个是在2019年末,它根据YouTube更改了可用数据,从而更改了通过其API可用的数据。
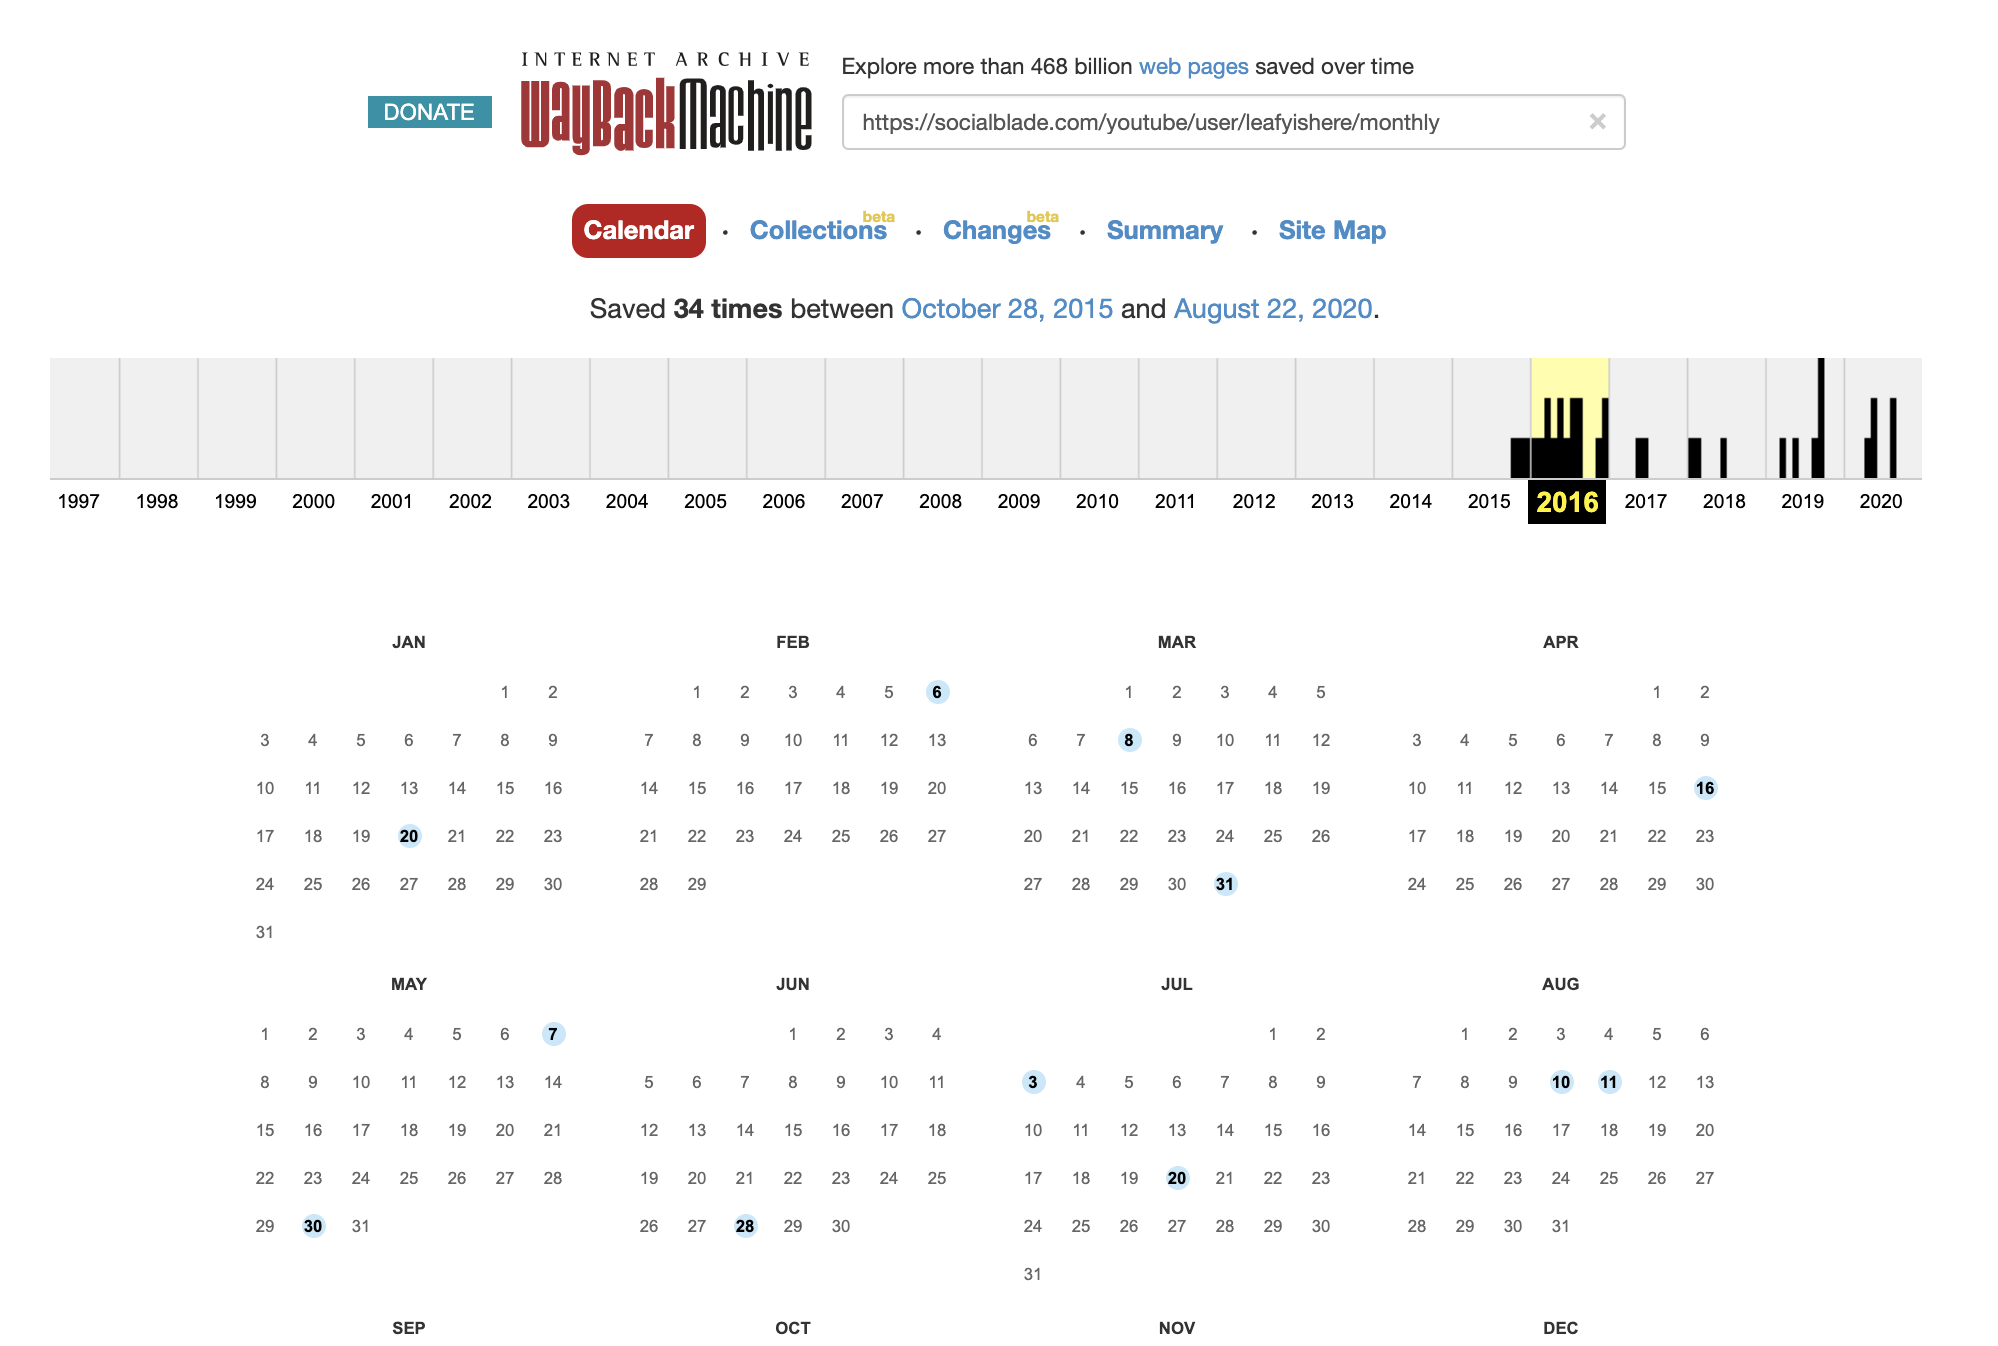
Now, I needed data from 2016, which is before 3 years ago. So in order to access this data, I simply plopped the url I wanted to scrape into WayBack machine to get an earlier version of the page. Any page that was archived before May 15, 2018 will have data going back to the channel’s inception.
现在,我需要3年前的2016年数据。 因此,为了访问此数据,我只是将要抓取的URL放入WayBack机器中,以获取页面的早期版本。 在2018年5月15日之前存档的任何页面的数据都可以追溯到该频道的成立日期。
Once you have the url, you’re ready to start scraping! Here is a link to the Github repo with the scraping code and resulting datasets.
有了网址后,就可以开始抓取了! 这是带有抓取代码和结果数据集的Github存储库的链接。
Note: The code I’m sharing here works for SocialBlade urls that end in “/monthly” and were archived before 2019. I have not checked if it works for any other versions or urls on the site.
注意:我在此处共享的代码适用于以“ /每月”结尾且在2019年之前存档的SocialBlade网址。我尚未检查它是否适用于网站上的任何其他版本或网址。
I have intentionally written the code so that it can be reused for many projects. Here is the link to a repo with all of the code.
我故意编写了代码,以便可以将其重用于许多项目。 这是所有代码的回购链接。
I first defined a function to scrape the targeted data values from SocialBlade. The function, sub_scraper, takes in two arguments — the URL that you are trying to scrape, and the var that you want to scrape. There are four options for the “var” input: ‘count’, which represents the daily change in subscribers; ‘total’, which represents the total amount of subscribers; ‘views’, which represents the daily change in channel views; and ‘views_tot’, which represents the total amount of channel views.
我首先定义了一个从SocialBlade刮取目标数据值的函数。 函数sub_scraper接受两个参数-您要抓取的URL和要抓取的var。 “ var”输入有四个选项:“ count”,代表订户的每日变化; “总数”,代表订户总数; “观看次数”,代表频道观看次数的每日变化; 和“ views_tot”,代表频道观看总数。
This function returns a list that contains the available dates and respective values. Here is the function:
该函数返回一个包含可用日期和相应值的列表。 这是函数:
import requests as req
from bs4 import BeautifulSoup as bs
import re
def sub_scraper(url, var):
    r = req.get(url)
    print(r.status_code)
    soup = bs(r.text, 'lxml')
    script_divs = soup.find_all('script', {'type': 'text/javascript'})
    res = 0
    for i in range(len(script_divs)):
#         print(i)
#         print(script_divs[i])
        if "CSV" in str(script_divs[i]):
            if var == 'count':
                res = script_divs[i]
            elif var == 'total':
                res = script_divs[i + 1]
            elif var == 'views':
                res = script_divs[i + 2]
            elif var == 'views_tot':
                res = script_divs[i + 3]
            break
#     print(res)
    lst = str(res).split('+')
    lst = [test.strip() for test in lst]
    lst = [test.replace('\\n"', '').replace('"', '') for test in lst]
    return lst
I then defined a function, to_df, to parse the list that sub_scraper returns and convert it into a dataframe. This function takes in the channel name as an argument as well.
然后,我定义了一个函数to_df ,用于解析sub_scraper返回的列表并将其转换为数据帧。 此函数也将通道名称作为参数。
import pandas as pd
def to_df(url, name, var):
    lst = sub_scraper(url, var)
    print(len(lst))
    lst = lst[1:len(lst) - 1]
    df = pd.DataFrame()
    df['Date'] = [x.split(',')[0] for x in lst]
    df['Subs'] = [x.split(',')[1] for x in lst]
    df['Name'] = name
    return df
And finally, I created functions to filter the dataframe by date. You can skip this step if you are wanting to use all of the data that is available on SocialBlade. But the function filterdate takes in a string in the format of year-month-day (eg. ‘2016–05–19’) and returns a dataframe with one month prior to the given date and one month after (eg. ‘2016–04–19’ to ‘2016–06–19).
最后,我创建了按日期过滤数据框的函数。 如果要使用SocialBlade上的所有数据,则可以跳过此步骤。 但是函数filterdate接受格式为年-月-日的字符串(例如'2016-05–19'),并返回给定日期之前一个月和之后一个月(例如'2016– 04–19”到“ 2016–06–19”)。
from datetime import date
from dateutil.relativedelta import relativedelta
def checkmonth(check, year, month, day):
    target = date(year, month, day)
    check = date.fromisoformat(check)
    bounds = [target + relativedelta(months=-1), target + relativedelta(months=+1)]
    if check >= bounds[0] and check <= bounds[1]:
        return True
    else:
        return False

def filterdate(date_str, df):
    target = date.fromisoformat(date_str)
    month = target.month
    day   = target.day
    year = target.year
    return df[df['Date'].apply(checkmonth, args=(year, month, day))]
This function can be easily modified by editing the bounds line in checkmonth if you want a wider or narrower range of values.
如果您想要更宽或更窄的值范围,可以通过在检查月份编辑边界线来轻松修改此功能。
And a full call using all of these functions looks like this:
使用所有这些功能的完整调用如下所示:
filterdate('2016-09-13', to_df('https://web.archive.org/web/20161218062757/https://socialblade.com/youtube/user/leafyishere/monthly', 'LeafyIsHere', 'count'))And again, if you do not want to filter by date, you can simply call to_df.
同样,如果您不想按日期进行过滤,则只需调用to_df。
In 2019, YouTube changed how subscription counts are displayed on the website, which subsequently affected the numbers that are returned via API calls. Prior to 2019, the API returned the absolute number of subscribers for each channel. Now, however, the API rounds the number so that it displays 3 significant digits.
在2019年,YouTube更改了订阅计数在网站上的显示方式,随后影响了通过API调用返回的数字。 在2019年之前,API返回了每个频道的绝对订阅者数量。 但是,现在,API将数字四舍五入,以便显示3个有效数字。
This means that a channel with 123 subscribers would display as 123; a channel with 51,734 subscribers would display as 51.7K; a channel with 349,999 subscribers would display as 349K subscribers; and a channel with 10,291,544 subscribers would display as 10.2M subscribers.
这意味着具有123个订阅者的频道将显示为123; 具有51,734个订阅者的频道将显示为51.7K; 拥有349,999个订阅者的频道将显示为349K个订阅者; 而拥有10,291,544名订户的频道将显示为1,020万订户。
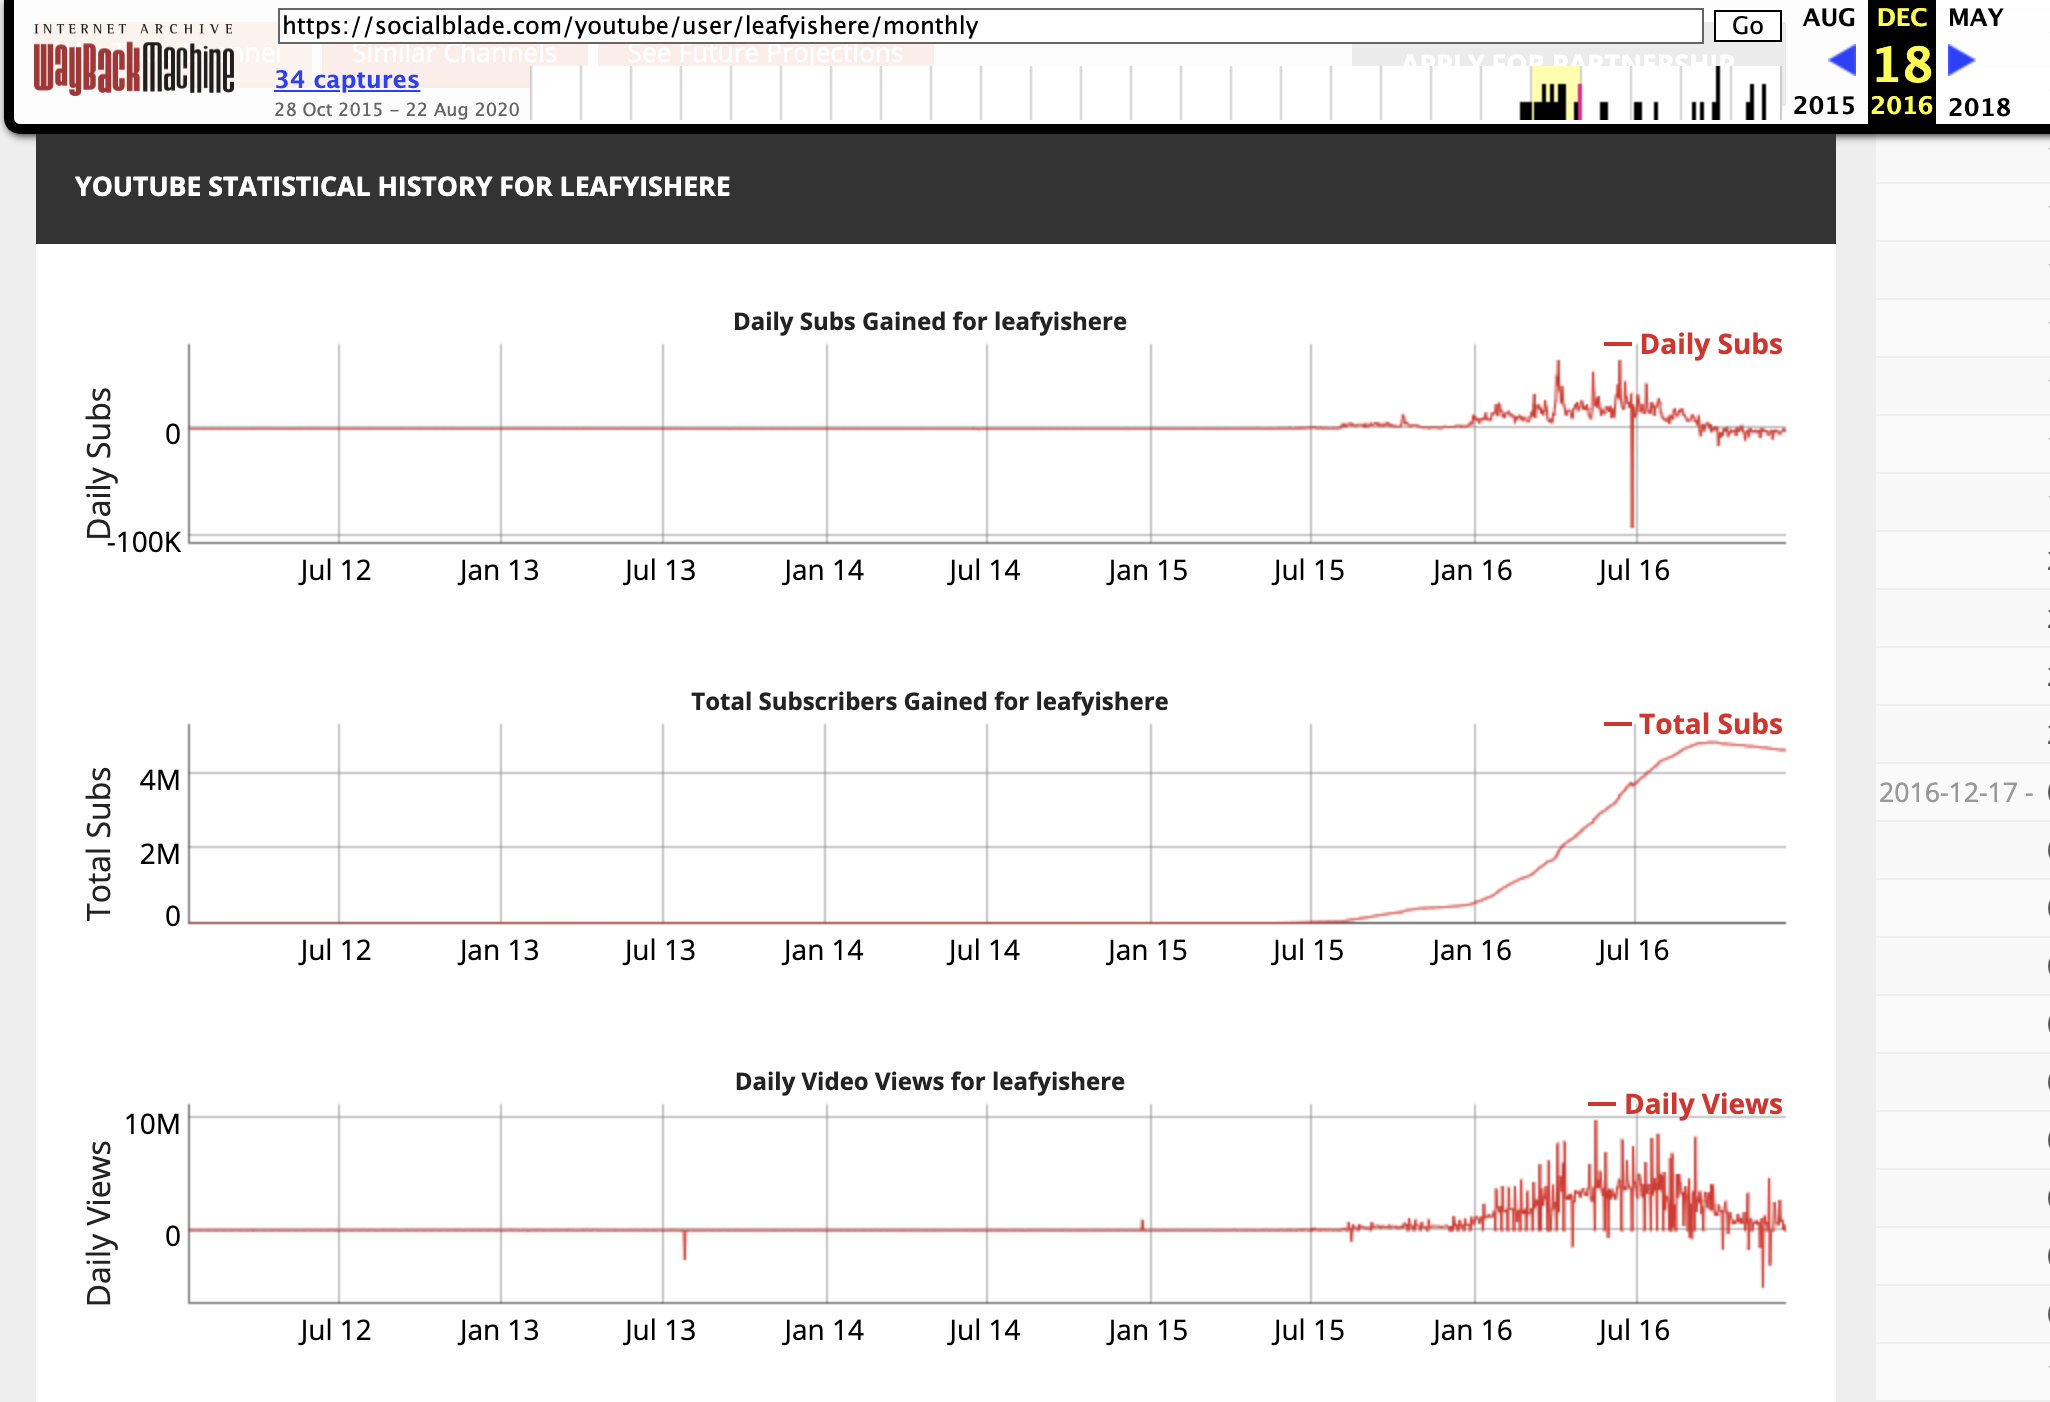
This change obviously affected which data SocialBlade makes available. Prior to this change, SocialBlade published accurate subscriber and view counts for each day, and the daily change in both of these counts. Now, SocialBlade only provides weekly numbers.
此更改显然影响了SocialBlade提供哪些数据。 在进行此更改之前,SocialBlade发布了每天的准确订阅者和观看次数,以及这两项的每日更改。 现在,SocialBlade仅提供每周编号。
SocialBlade also redesigned their website. I have not checked if my scraping code works for the redesign, but my guess is that it does not. Please keep this in mind if you are intending to scrape data either in or after 2019.
SocialBlade还重新设计了他们的网站。 我没有检查过我的抓取代码是否可以用于重新设计,但是我猜想它不能。 如果您打算在2019年或之后抓取数据,请记住这一点。
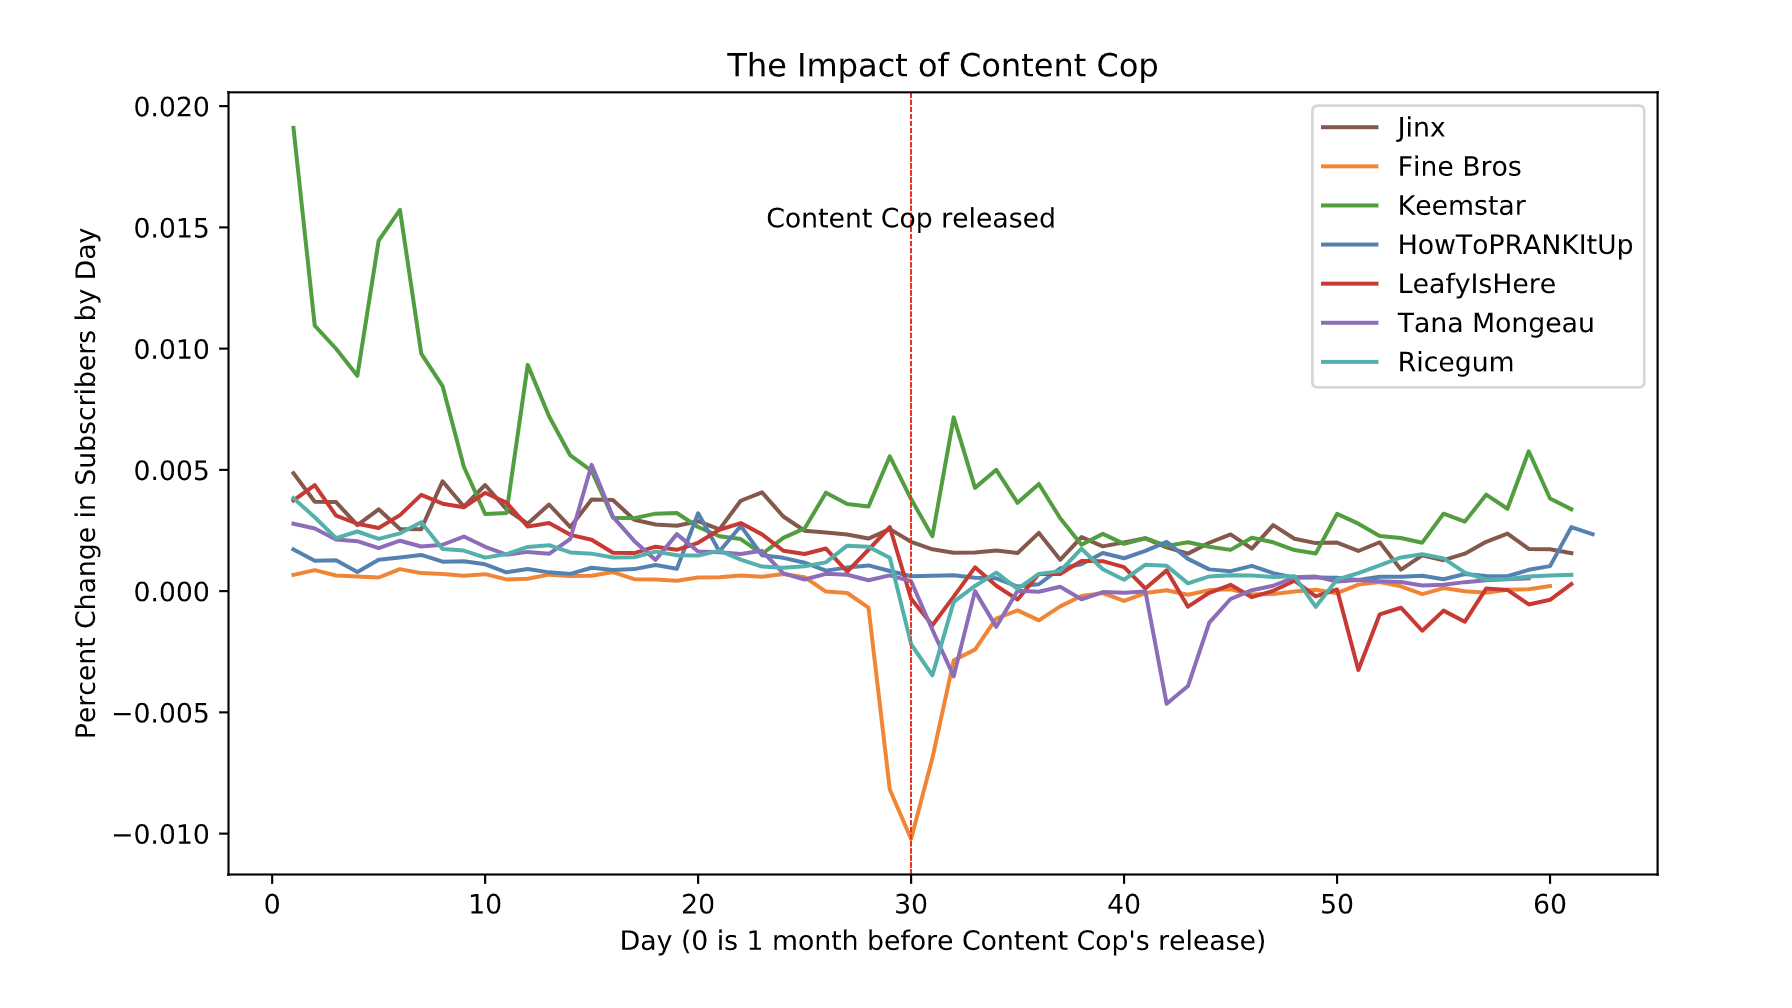
Here is a link to my resulting dataset. And here are some of the plots I produced with this dataset:
这是我生成的数据集的链接。 这是我使用此数据集生成的一些图:
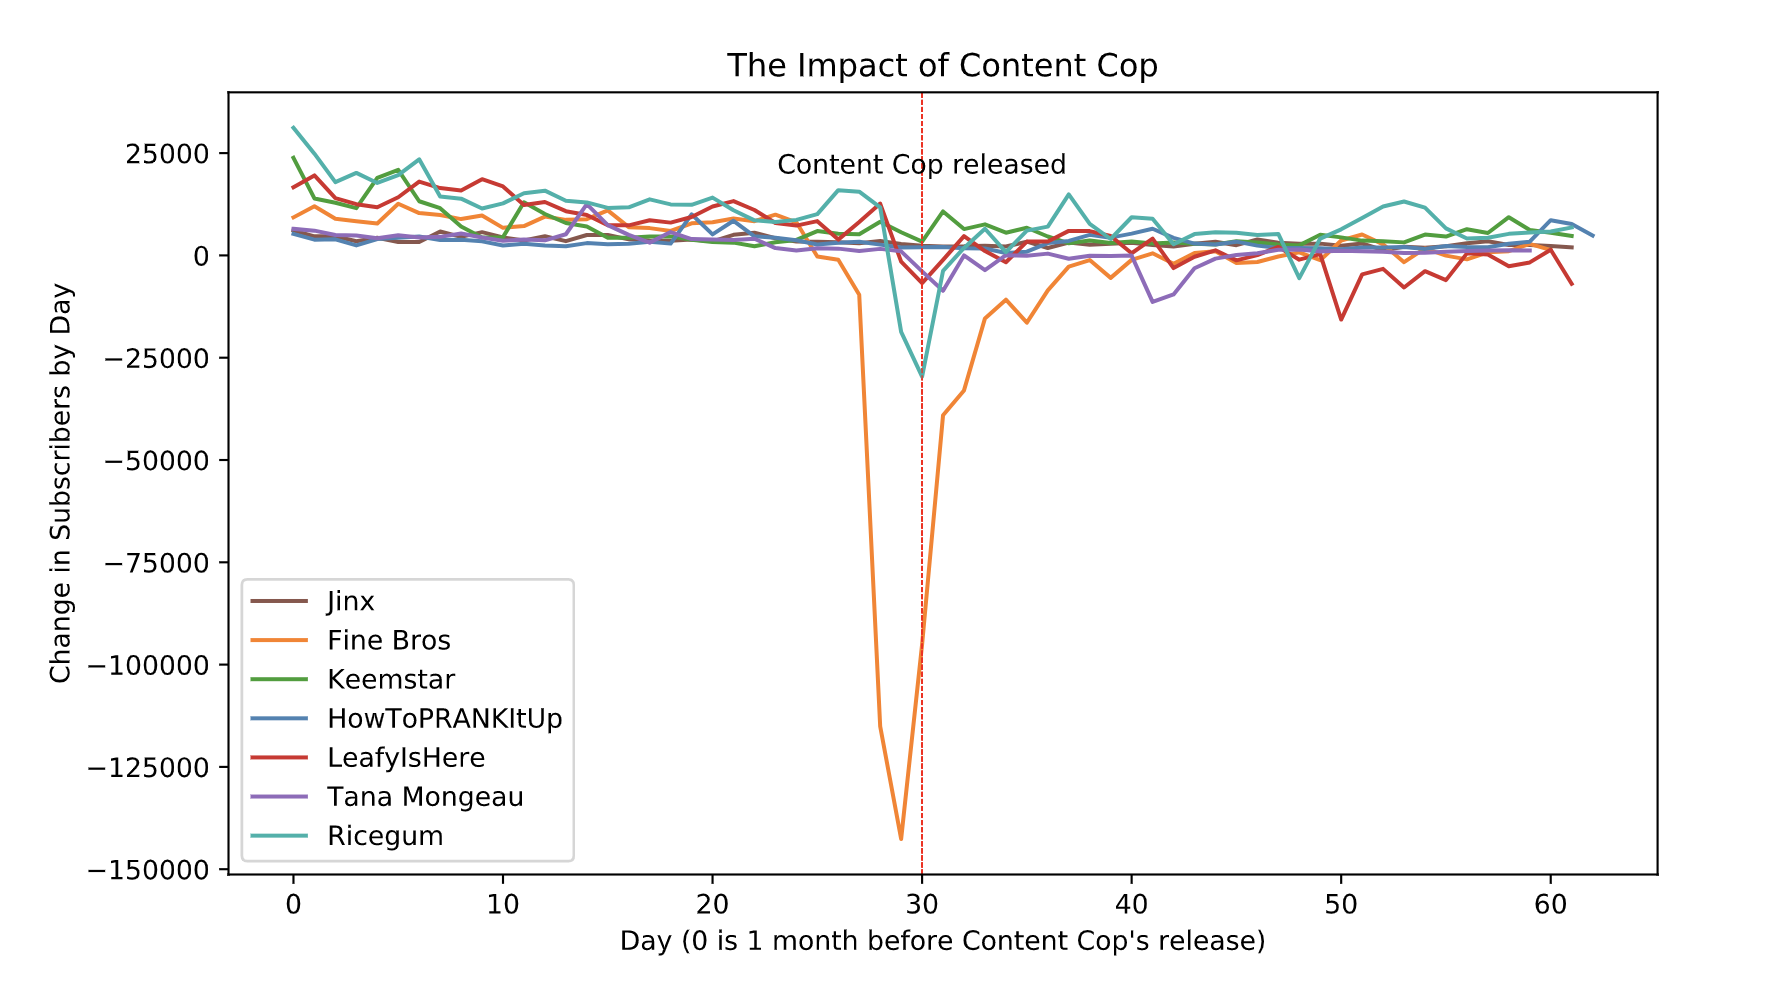
Here is the code for producing a plot similar to the image on the left, if that is of interest:
如果感兴趣的话,这是用于产生类似于左侧图像的绘图的代码:
for i in range(len(names)):
    df = cc[cc.Name==names[i]]
    plt.plot(np.arange(len(df.index)), pd.to_numeric(df.Subs), label = df.Name.values[0], color = colors[i])
    plt.axvline(x=30, color='red', linestyle='dashed',linewidth=0.5)
    plt.ylabel('Change in Subscribers by Day')
    plt.xlabel("Day (0 is 1 month before Content Cop's release)")
    plt.legend()
plt.annotate('Content Cop released', xy=(30, 20000), ha='center', size=10)
plt.title('The Impact of Content Cop')
And if you’re interested in seeing more graph examples and the code to produce them, please see this Jupyter notebook.
如果您有兴趣查看更多图形示例以及生成示例的代码,请参阅此Jupyter笔记本。
And last, but not least, if you’re interested in the results of my analysis of Content Cop, check out my YouTube video!
最后,同样重要的是,如果您对我对Content Cop的分析结果感兴趣,请查看我的YouTube视频!
翻译自: https://medium.com/swlh/how-to-scrape-socialblade-for-youtube-subscription-data-ec7c4bde6933


 167
167

 被折叠的 条评论
为什么被折叠?
被折叠的 条评论
为什么被折叠?
 到【灌水乐园】发言


