


在最近学习《机器学习实战时》,在使用matplotlib时,往往是这样:import matplotlib.pyplot as plt
接下来fig=plt.figure() 绘制图表
fig.add_subplot(111)是什么意思呢?
函数是在大的画布中绘制小画布,111表明:将画布分成1行1列,获取从上到下,从左到右第1块小画布。
同理add_subplot(2,3,5)的意思不难理解。如果将画布分成3行4列要在第10块画布作画怎么写呢?add_subplot(3,4,10)即可。
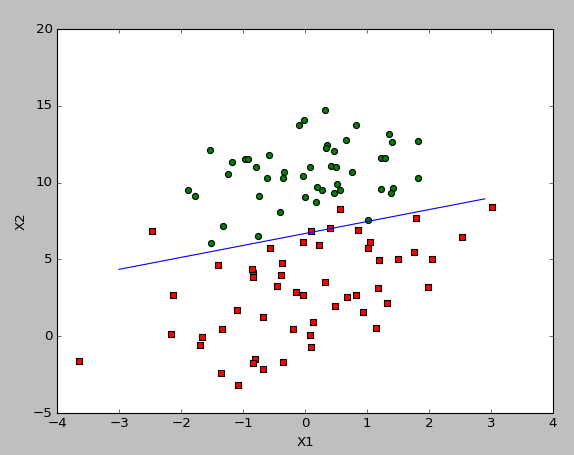
绘图实例:代码来自《机器学习实战》
import matplotlib.pyplot as plt
    dataMat,labelMat=loadDataSet()
    dataArr=array(dataMat)
    n=shape(dataArr)[0]
    x1cord1=[];x2cord1=[]#实际分类为1的样例,其特征对应值存放处
    x1cord2=[];x2cord2=[]
    for i in range(n):
        if int(labelMat[i])==1:
            x1cord1.append(dataArr[i,1]);x2cord1.append(dataArr[i,2])
        else:
            x1cord2.append(dataArr[i,1]);x2cord2.append(dataArr[i,2])
    fig=plt.figure()
    ax=fig.add_subplot(111)
    ax.scatter(x1cord1,x2cord1,s=30,c='red',marker='s')#scatter用于绘制散点
    ax.scatter(x1cord2,x2cord2,s=30,c='green')#至此绘制出了分别属于两类的点
    x1=arange(-3.0,3.0,0.1)#arange与range函数类似,不过range函数产生的是list,而arange产生的是array。表明产生-0.3到0.3之间的数,步长为0.1
    weightsT=array(weights)
    x2=(-weightsT[0]-weightsT[1]*x1)/weightsT[2]#weights是matrix,进行计算后得到的x2也是matrix,而x1是array,所以需要统一.|x1|==|x2|
    ax.plot(x1,x2)#调用plot函数绘制得到由点生成的线条
    plt.xlabel('X1');plt.ylabel('X2');#为横纵坐标命名
    plt.show()
代码中xcord的类型可以是列表,也可以是array。好像是这样,array,list还有matrix的用法需要讨论。
为什么:x2=(-weightsT[0]-weightsT[1]*x1)/weightsT[2]。
因为z=w0+w1*x1+w2*x2(在本例中),将z代入sigmoid函数中求值进而分类,观察sigmoid函数看到自变量为0前后是图像跳跃的点,如下如sigmoid函数图:
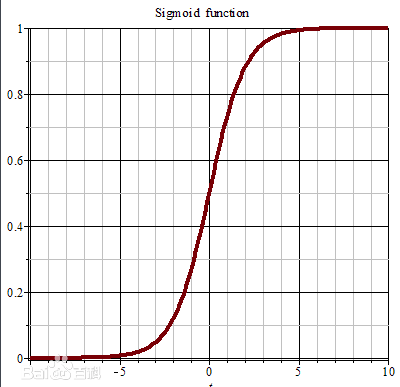
所以z==0为分隔点,令z=0,得到x1与x2之间的关系。运行代码:
得到如下图:
添加flatten函数的用法:
部分内容来自http://blog.csdn.net/maoersong/article/details/23823925
flatten函数可以用在array与matrix上,但是不可用在list上:
1:用在array:
    >>> a = [[1,3],[2,4],[3,5]]
    >>> a = array(a)
    >>> a.flatten()
    array([1, 3, 2, 4, 3, 5])
2、用在列表:直接使用报错
>>> a = [[1,3],[2,4],[3,5]]
>>> a.flatten()

Traceback (most recent call last):
  File "<pyshell#10>", line 1, in <module>
    a.flatten()
AttributeError: 'list' object has no attribute 'flatten'
如下为正确用法:
    >>> a = [[1,3],[2,4],[3,5],["abc","def"]]
    >>> a1 = [y for x in a for y in x]
    >>> a1
    [1, 3, 2, 4, 3, 5, 'abc', 'def']
3、用在矩阵:
    >>> a = [[1,3],[2,4],[3,5]]
    >>> a = mat(a)
    >>> y = a.flatten()
    >>> y
    matrix([[1, 3, 2, 4, 3, 5]])
    >>> y = a.flatten().A
    >>> y
    array([[1, 3, 2, 4, 3, 5]])
    >>> shape(y)
    (1, 6)
    >>> shape(y[0])
    (6,)
    >>> y = a.flatten().A[0]
    >>> y
    array([1, 3, 2, 4, 3, 5])
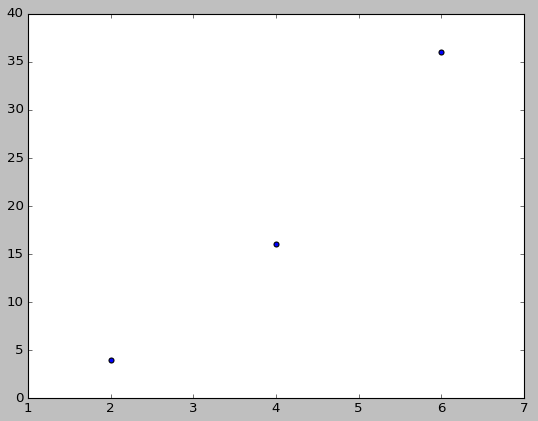
在绘制图像,需要部分数据时,可以首先获取需要的矩阵中的一列数,然后通过调用flatten函数转成单行矩阵,再调用.A,获取二维array形式,获取下标为0的元素。此时得到单维array形式,可以在ax.scatter中作为参数,绘制图形。

得到图形如下:


 750
750


 被折叠的 条评论
为什么被折叠?
被折叠的 条评论
为什么被折叠?
 到【灌水乐园】发言


