php-fpm nginx.conf

Query Admin

System Administration Tips, Security, Internet

Skip to content

500 Million hits/day with Nginx + PHP-FPM + MySQL

I have recently registered to blitz.io, a very interested cloud service which allows users to stress-test a web server simulating up to 50K concurrent connections, with the possibility to specify different regions to originate requests, the HTTP method, the timeout and much more. This service can help to properly configure the web server (Nginx, Lighttpd, etc), the PHP-FPM and the MySQL to handle as more concurrent connections as possible.

I wanted to test how many concurrent connections Nginx + PHP-FPM + MySQL (Percona) could handle in one dedicated server and the results are very promising as the server handled more than 10,000 concurrent connections with an average CPU usage of 50% / 65%.

The dedicated server has the following hardware specs: Intel Xeon E3 1230v3 (4 cores 8 threads at 3.3 GHz), 32 GB DDR3 ECC, 120 GB SSD, 300 Mbit/s Bandwidth. The Nginx version used is 1.4.5-stable, the MySQL (Percona Server) version used is 5.6.15-63.0 and the PHP-FPM version used is PHP 5.5.9-1~dotdeb.1 (fpm-fcgi).

The test involved the GET request of a remote PHP web page (/test.php?item=testing-12444) used to query the MySQL database with a table of more than 100K rows and print the found row’s items in a HTML web page. So we have not tested the serving of a static file but a PHP page used to display dynamic content.

The following parameters were used in the Blitz rush test:

blitz-io-rush-parameters

This is a screenshot of the Nginx status page showing active connections:

nginx-status-page

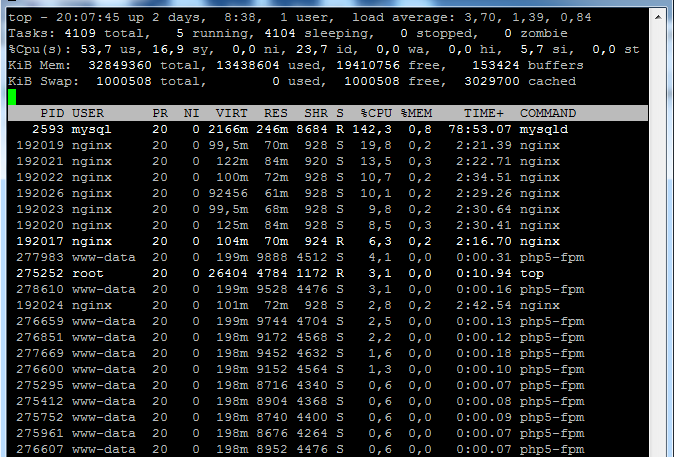
This is a screenshot of the output generated by the “top” command:

top-status-window-10k-nginx-test

This is a screenshot of the PHP-FPM status page:

php-fpm-status-10k-nginx-test

Now lets see how I have configured Nginx, PHP-FPM, MySQL and Sysctl.conf file.

/etc/nginx/nginx.conf:

user nginx;
worker_processes 8;
error_log /var/log/nginx/error.log warn;
pid /var/run/nginx.pid;
worker_rlimit_nofile 150000;
 
events {
  worker_connections 150000;
  multi_accept on;
  use epoll;
}
 
http {
    include /etc/nginx/mime.types;
    default_type application/octet-stream;
    log_format  main  '$remote_addr - $remote_user [$time_local] "$request" '
                      '$status $body_bytes_sent "$http_referer" '
                      '"$http_user_agent" "$http_x_forwarded_for"';
 
    access_log /var/log/nginx/access.log  main;
 
    sendfile on;
    tcp_nopush on;
    keepalive_timeout 65;
    reset_timedout_connection on;
    types_hash_max_size 2048;
    server_tokens off;
    server_names_hash_bucket_size 256;
    client_max_body_size 32k;
    client_body_buffer_size 32k;
    client_body_in_single_buffer on;
    client_body_timeout 180s;
    client_header_timeout 180s;
    client_header_buffer_size 32k;
    large_client_header_buffers 4 32k;
 
    include /etc/nginx/conf.d/*.conf;
}

/etc/nginx/fastcgi_params:

...
# Custom parameters
fastcgi_connect_timeout 180s;
fastcgi_send_timeout 600s;
fastcgi_read_timeout 600s;
fastcgi_intercept_errors on;
fastcgi_max_temp_file_size 0;
fastcgi_pass 127.0.0.1:9000;
fastcgi_param SCRIPT_FILENAME $document_root$fastcgi_script_name;
fastcgi_index index.php;

/etc/php5/fpm/pool.d/www.conf:

...
listen = 127.0.0.1:9000
pm = static
pm.max_children = 4000
pm.max_requests = 50000
...

/etc/sysctl.conf:

fs.file-max = 150000
net.core.netdev_max_backlog=32768
net.core.optmem_max=20480
#net.core.rmem_default=65536
#net.core.rmem_max=16777216
net.core.somaxconn=50000
#net.core.wmem_default=65536
#net.core.wmem_max=16777216
net.ipv4.tcp_fin_timeout=120
#net.ipv4.tcp_keepalive_intvl=30
#net.ipv4.tcp_keepalive_probes=3
#net.ipv4.tcp_keepalive_time=120
net.ipv4.tcp_max_orphans=262144
net.ipv4.tcp_max_syn_backlog=524288
net.ipv4.tcp_max_tw_buckets=524288
#net.ipv4.tcp_mem=1048576 1048576 2097152
#net.ipv4.tcp_no_metrics_save=1
net.ipv4.tcp_orphan_retries=0
#net.ipv4.tcp_rmem=4096 16384 16777216
#net.ipv4.tcp_synack_retries=2
net.ipv4.tcp_syncookies=1
#net.ipv4.tcp_syn_retries=2
#net.ipv4.tcp_wmem=4096 32768 16777216

/etc/mysql/my.cnf:

# Generated by Percona Configuration Wizard (http://tools.percona.com/) version REL5-20120208
 
[mysql]
 
# CLIENT #
port                           = 3306
socket                         = /var/run/mysqld/mysqld.sock
 
[mysqld]
 
# GENERAL #
user                           = mysql
default-storage-engine         = InnoDB
socket                         = /var/run/mysqld/mysqld.sock
pid-file                       = /var/run/mysqld/mysqld.pid
tmpdir                         = /tmp
 
# MyISAM #
key-buffer-size                = 32M
myisam-recover                 = FORCE,BACKUP
 
# SAFETY #
max-allowed-packet             = 16M
max-connect-errors             = 1000000
skip-name-resolve
sysdate-is-now                 = 1
innodb                         = FORCE
innodb-strict-mode             = 1
 
# DATA STORAGE #
datadir                        = /var/lib/mysql
 
# CACHES AND LIMITS #
tmp-table-size                 = 32M
max-heap-table-size            = 32M
query-cache-type               = 0
query-cache-size               = 0
max-connections                = 15000
thread-cache-size              = 50
open-files-limit               = 65535
table-definition-cache         = 1024
table-open-cache               = 2048
 
# INNODB #
innodb-flush-method            = O_DIRECT
innodb-log-files-in-group      = 2
innodb-log-file-size           = 128M
innodb-flush-log-at-trx-commit = 2
innodb-file-per-table          = 1
innodb-buffer-pool-size        = 1456M
innodb_fast_shutdown           = 0
 
# LOGGING #
log-error                      = /var/log/mysql/mysql-error.log
log-queries-not-using-indexes  = 0
slow-query-log                 = 1
slow-query-log-file            = /var/log/mysql/mysql-slow.log
 
# REDUCE MEMORY USAGE #
performance_schema             = 0

Finally, this is the screenshot of the Blitz rush test results:

blitz-io-results-part1

As you can see, the test generated 344,447 successful hits in 60.00 seconds and it transferred 3.39 GB of data in and out of our PHP web page (that involved queries to our database of 100K rows). The average hit rate of 5,740.78/second translates to about 496,003,680 hits/day.

This is a screenshot of the hit rate graph:

blitz-io-hit-rate-screenshot

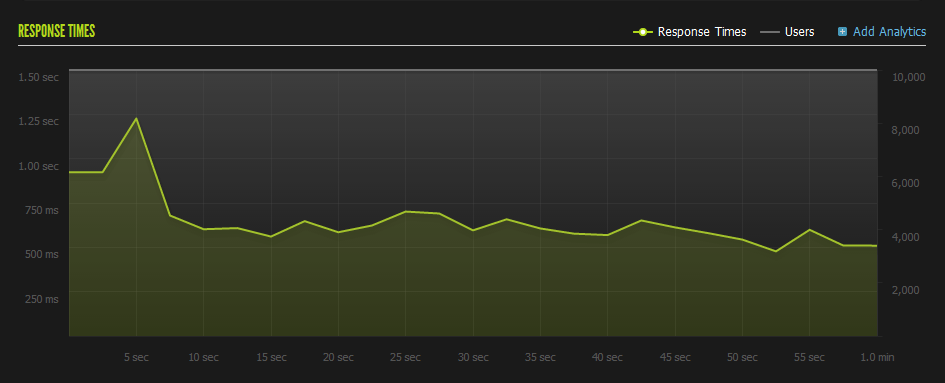
This is a screenshot of the responses time:

blitz-io-responses-time-10k-nginx-test

Contact me if you have any questions.


Stay Updated

Other Posts

Random Posts


This entry was posted in Nginx and tagged blitz io test, blitz site test, concurrent connections, nginx benchmark, nginx concurrent connections on February 23, 2014.

Post navigation

← Fix the Nginx 504 gateway timeout Free world flags icon sets →

Search for:

Categories

Recent Posts

Proudly powered by WordPress


转载于:https://my.oschina.net/u/574366/blog/354127

  • 0
    点赞
  • 0
    收藏
    觉得还不错? 一键收藏
  • 0
    评论

“相关推荐”对你有帮助么?

  • 非常没帮助
  • 没帮助
  • 一般
  • 有帮助
  • 非常有帮助
提交
评论
添加红包

请填写红包祝福语或标题

红包个数最小为10个

红包金额最低5元

当前余额3.43前往充值 >
需支付:10.00
成就一亿技术人!
领取后你会自动成为博主和红包主的粉丝 规则
hope_wisdom
发出的红包
实付
使用余额支付
点击重新获取
扫码支付
钱包余额 0

抵扣说明:

1.余额是钱包充值的虚拟货币,按照1:1的比例进行支付金额的抵扣。
2.余额无法直接购买下载,可以购买VIP、付费专栏及课程。

余额充值