


var colors = ['#5599FF','#CC0000', '#FF8051', '#EEEE00','#32CD32'];
function stateAir(type,param){
//获取当前type
currentType = type;
$("#metadataView").children().hide();
$("#airMete").show();
var myChart = echarts.init(document.getElementById(type+"View"));
var legend = [];
var optionType = [];
var time = [];
var series = [];
var Ozone = [];
var CO = [];
var SO2 = [];
var NO2 = [];
data: (function() {
$.ajax({
async : false,
url : basePath + 'search-data-environmental-health-outer!searchStateAboutDiabetesInAir.action',
type : 'post',
dataType : 'json',
data : {state:param},
success : function(result) {
legend = result.stateLegend;
optionType = result.options;
time = result.stateTime;
series = result.stateData;
Ozone = result.Ozone;
CO = result.CO;
SO2 = result.SO2;
NO2 = result.NO2;
}
});
return legend,optionType,time,series,Ozone,CO,SO2,NO2;
})();
var option = {
color: colors,
tooltip : {
trigger : 'axis',
axisPointer : {
type : 'shadow'
},
formatter: '{b0}<br /> '+legend[4]+':{c0}%<br /> '+legend[3]+':{c1}ppm<br />'+legend[2]+':{c2}ppb<br />'+legend[1]+':{c3}ppm<br />'+legend[0]+':{c4}ppb'
},
grid : {
x : 40,
x2 : 220,
y2 : 80,
},
toolbox : {
show : true
},
legend : {
x : 'center',
data : legend.reverse()
},
xAxis : [ {
type : 'category',
axisTick : {
alignWithLabel : true
},
axisLabel : {
// 反转角度
rotate : 90,
// 间隔
interval:0
},
data : time
} ],
yAxis : [ {
type : 'value', //数值轴
name : '患病率(%)',
position : 'left',
axisLine: {
lineStyle: {
color: colors[0]
}
},
axisLabel: {
formatter: '{value}'
},
max : 20,
splitNumber :10
}, {
type : 'value',
name : legend[1]+'\n(ppm)',
position : 'right',
axisLine: {
lineStyle: {
color: colors[1]
}
},
axisLabel: {
formatter: '{value}'
},
max : 0.1,
splitNumber :10
}, {
type : 'value',
name : legend[2]+'\n(ppb)',
position : 'right',
offset : 50,
axisLine: {
lineStyle: {
color: colors[2]
}
},
axisLabel: {
formatter: '{value}'
},
max : 2,
splitNumber :10
}, {
type : 'value',
name : legend[3]+'\n(ppm)',
position : 'right',
offset : 100,
axisLine: {
lineStyle: {
color: colors[3]
}
},
axisLabel: {
formatter: '{value}'
},
max : 10,
splitNumber :10
}, {
type : 'value',
name : legend[4]+'\n(ppb)',
position : 'right',
offset : 150,
axisLine: {
lineStyle: {
color: colors[4]
}
},
axisLabel: {
formatter: '{value}'
},
max : 20,
splitNumber :10
}],
series : [
{
name : legend[0],
type : 'bar',
yAxisIndex: 0, //使用的 y轴的 index,在单个图表实例中存在多个 y轴的时候有用
data : series
},
{
name : legend[1],
type : 'line',
yAxisIndex: 1,
data : Ozone
},
{
name : legend[2],
type : 'line',
yAxisIndex: 2,
data : CO
},
{
name : legend[3],
type : 'line',
yAxisIndex: 3,
data : SO2
},
{
name : legend[4],
type : 'line',
yAxisIndex: 4,
data : NO2
} ]
};
$("#firstState").html('<a href="javascript:void(0);">'+getZHName(optionType[0])+'</a>');
$("#secondState").html('<a href="javascript:void(0);">'+getZHName(optionType[1])+'</a>');
$("#thirdState").html('<a href="javascript:void(0);">'+getZHName(optionType[2])+'</a>');
// 第一次进入方法,默认选择
if(param == ""){
$("#firstState").attr("style","height:24px;width:80px;text-align:center;background:#9eccff;font-weight: bold;");
$("#firstState").addClass("sele");
}
myChart.setOption(option);
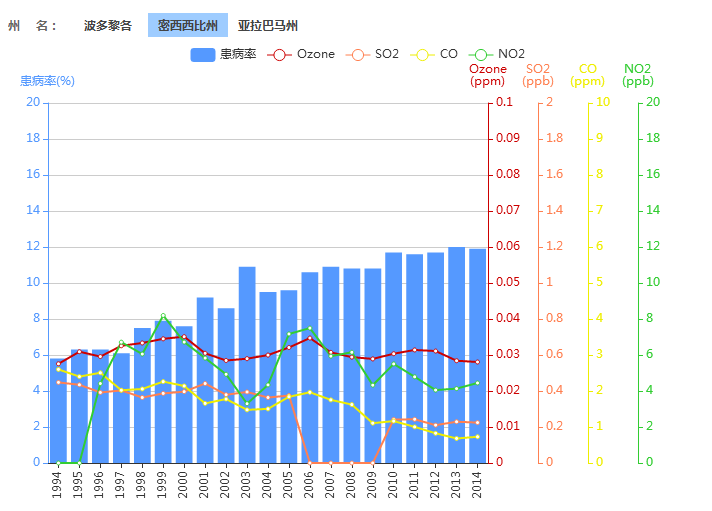
}效果图


 607
607

 被折叠的 条评论
为什么被折叠?
被折叠的 条评论
为什么被折叠?
 到【灌水乐园】发言


