


matplotlib Artist tutorial
Aritist
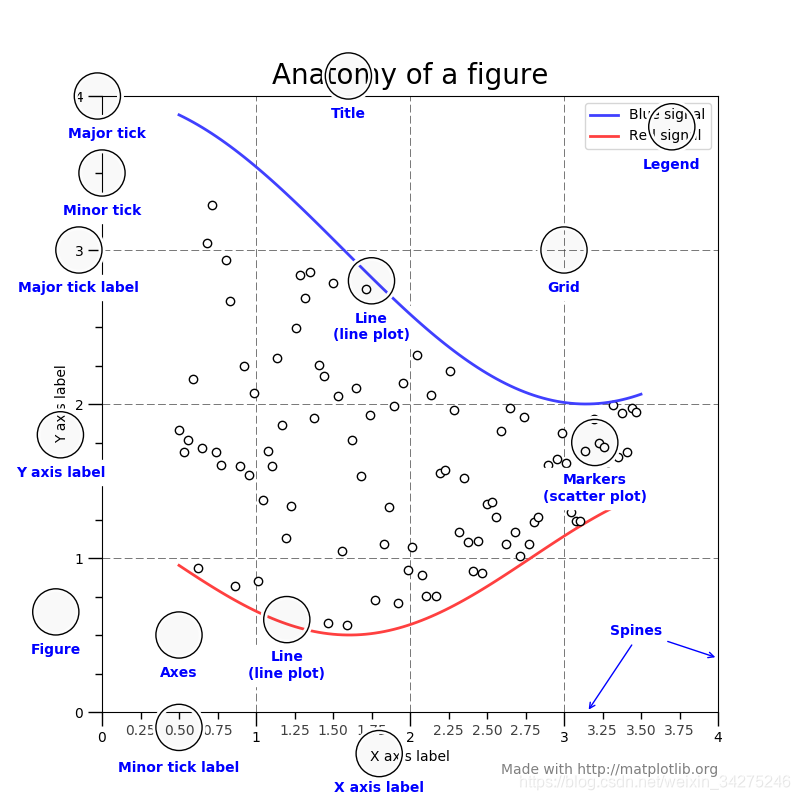
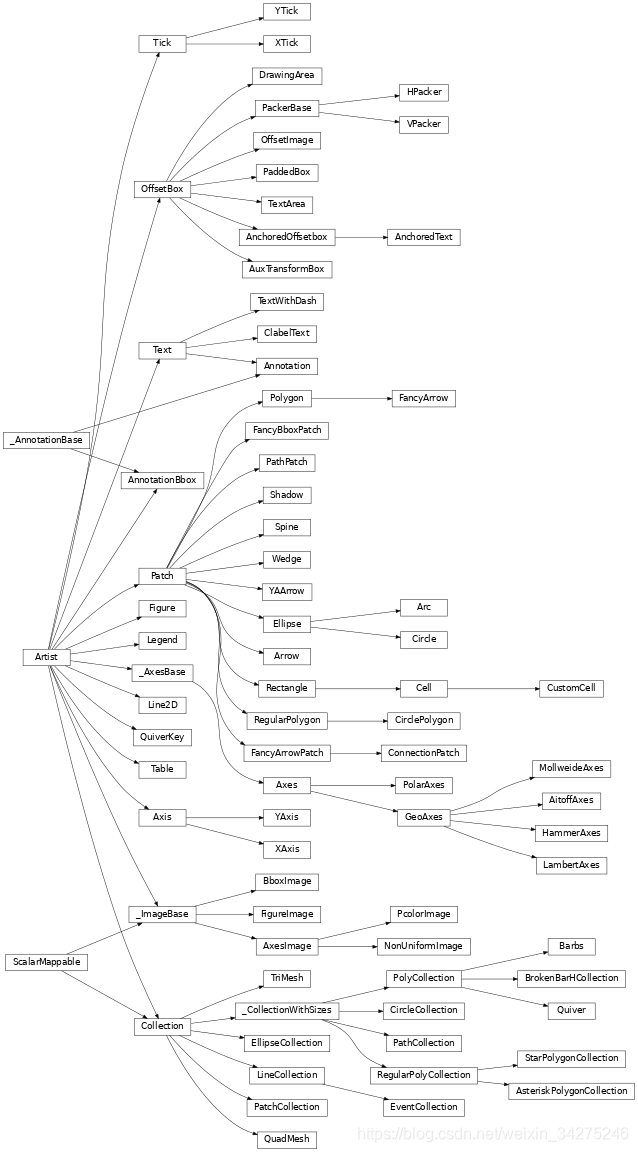
Basically everything you can see on the figure is an artist (even the Figure, Axes, and Axis objects).This includes Text objects, Line2D objects, collection objects, Patch objects … (you get the idea). When the figure is rendered, all of the artists are drawn to the canvas. Most Artists are tied to an Axes; such an Artist cannot be shared by multiple Axes, or moved from one to another.
基本上,你能在图形上看到的一切都是artist (甚至是图、轴域和轴对象),这包括文本对象、Line2D对象、集合对象、补丁对象…(你明白了)当图被描绘时,所有的artist 都被画在画布上。大多数 artist 都被绑在一个 axes 上,这样的 artist 不能被多个轴共享,也不能从一个轴移动到另一个轴。
利用Artist对象进行绘图的流程分为如下三步
- 创建Figure对象
- 为Figure对象创建一个或多个Axes对象
- 调用Axes对象的方法来创建各种简单的Artist对象
Artist的属性
下面是Artist对象都具有的一些属性:
| Artist 属性 | 作用 |
|---|---|
| alpha | 透明度,值在0到1之间,0为完全透明,1为完全不透明 |
| animated | 布尔值,在绘制动画效果时使用 |
| axes | 此Artist对象所在的Axes对象,可能为None |
| clip_box | 对象的裁剪框 |
| clip_on | 是否裁剪 |
| clip_path | 裁剪的路径 |
| contains | 判断指定点是否在对象上的函数 |
| figure | 所在的Figure对象,可能为None |
| label | 文本标签 |
| picker | 控制Artist对象选取 |
| transform | 控制偏移旋转 |
| visible | 是否可见 |
| zorder | 控制绘图顺序 |
Artist对象的所有属性都通过相应的 get_* 和 set_* 函数进行读写
fig.set_alpha(0.5*fig.get_alpha())
如果你想用一条语句设置多个属性的话,可以使用set函数:
fig.set(alpha=0.5, zorder=2)
使用 matplotlib.pyplot.getp 函数可以方便地输出Artist对象的所有属性名和值。
>>> plt.getp(fig.patch)
    aa = True
    alpha = 1.0
    animated = False
    antialiased or aa = True
示例代码
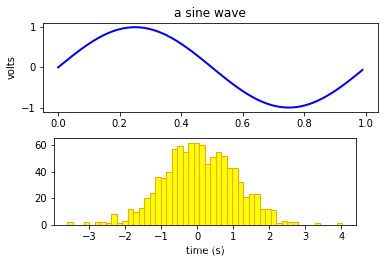
import numpy as np
import matplotlib.pyplot as plt

fig = plt.figure()
fig.subplots_adjust(top=0.8)
ax1 = fig.add_subplot(211)
ax1.set_ylabel('volts')
ax1.set_title('a sine wave')

t = np.arange(0.0, 1.0, 0.01)
s = np.sin(2*np.pi*t)
line, = ax1.plot(t, s, color='blue', lw=2)

# Fixing random state for reproducibility
np.random.seed(19680801)

ax2 = fig.add_axes([0.15, 0.1, 0.7, 0.3])
n, bins, patches = ax2.hist(np.random.randn(1000), 50,
    facecolor='yellow', edgecolor='orange')
ax2.set_xlabel('time (s)')

plt.show()
lines包含位置数量的line,所以line, = ax1.plot(t, s, color=‘blue’, lw=2)要加“,”号
Figure
Figure代表一个绘制面板,是最大的一个Aritist,它包括整幅图像的所有元素,背景是一个Rectangle对象,用Figure.patch属性表示。
Figure可以包涵多个Axes(即多个图表),绘图布局的创建主要有三种方法:
- axes = fig.add_axes([left, bottom, width, height])
- fig, axes = plt.subplots(行数, 列数)
- axes = fig.add_subplot(行数, 列数, 序号)
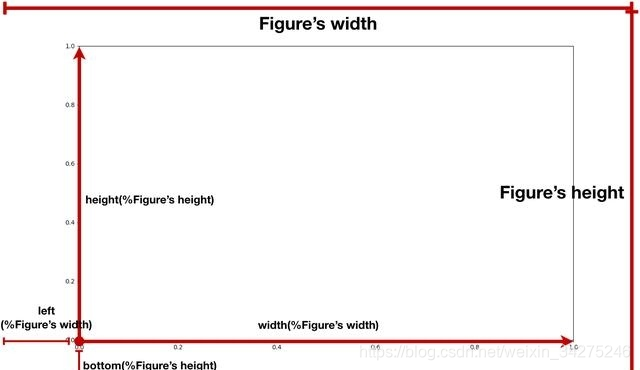
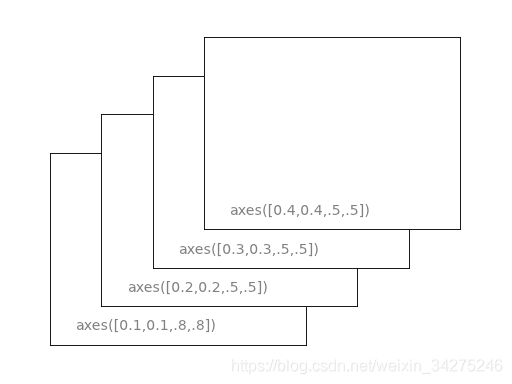
axes = fig.add_axes()方法是三种方法中最繁琐的一种方法,因为使用该方法布局需要先计算好绘图区的位置,即参数列表[left,bottom,width,height]的数值。其中
- left:绘图区左侧边缘线与Figure画布左侧边缘线的距离
- bottom:绘图区底部边缘线与Figure画布底部边缘线的距离
- width:绘图区的宽度
- height:绘图区的高度
它们的单位也不是传统的厘米、毫米这样的长度距离单位,而是Figure画布的百分比,因此它们的取值范围在[0,1]区间内,其中left与width的单位为Figure画布宽度的百分比,bottom与height的单位为Figure画布高度的百分比。
fig, axes = plt.subplots()方法是三种方法中创建阵列布局最便捷的一种,该方法只需给定行数n和列数m,就可以直接创建出n行m列的绘图区。
fig = plt.figure()  # an empty figure with no axes
fig, ax_lst = plt.subplots(2, 2)  # a figure with a 2x2 grid of Axes
通过plt.subplots()方法创建Axes绘图区时,无论是创建单独的一个绘图区还是阵列式的多个绘图区,创建区域在Figure中的位置是固定的,绘图区之间的间隔也是固定的。
创建区域位置参数及间隔参数可通过fig.subplots_adjust(left,right,top,bottom,wspace,hspace)方法改变。
figure.add_subplot()方法与plt.subplots()方法一样,首先在Figure画布上划定出一块区域,然后按行和列进行布局,与plt.subplots()方法不同的是该方法一行命令只能创建一个Axes绘图区,即序号参数所指定的那个位置的Axes。
为了支持pylab中的gca()等函数,Figure对象内部保存有当前轴的信息,因此不建议直接对Figure.axes属性进行列表操作,而应该使用add_subplot, add_axes, delaxes等方法进行添加和删除操作。
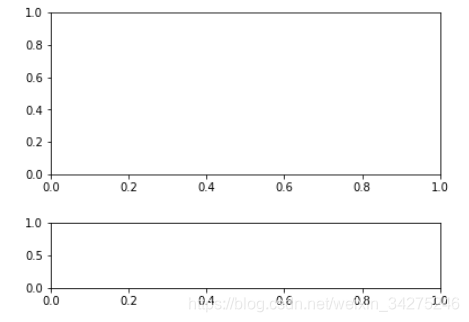
fig = plt.figure()
ax1 = fig.add_axes([0.1, 0.45, 0.8, 0.5])
ax2 = fig.add_axes([0.1, 0.1, 0.8, 0.2])
plt.show()
包含其它Artist对象的Figure属性
| Figure 属性 | 说明 |
|---|---|
| axes | Axes对象列表 |
| patch | 作为背景的Rectangle对象 |
| images | FigureImage对象列表,用来显示图片 |
| legends | Legend对象列表 |
| lines | Line2D对象列表 |
| patches | patch对象列表 |
| texts | Text对象列表,用来显示文字 |
In [156]: fig = plt.figure()

In [157]: ax1 = fig.add_subplot(211)

In [158]: ax2 = fig.add_axes([0.1, 0.1, 0.7, 0.3])

In [159]: ax1
Out[159]: <matplotlib.axes.Subplot instance at 0xd54b26c>

In [160]: print fig.axes
[<matplotlib.axes.Subplot instance at 0xd54b26c>, <matplotlib.axes.Axes instance at 0xd3f0b2c>]
import numpy as np
import matplotlib.pyplot as plt
import matplotlib.lines as lines

fig = plt.figure()
l1 = lines.Line2D([0, 1], [0, 1], transform=fig.transFigure, figure=fig)
l2 = lines.Line2D([0, 1], [1, 0], transform=fig.transFigure, figure=fig)
print(fig.lines)
print(l1,l2)

fig.lines.extend([l1, l2])
print(fig.lines)

plt.show()

[]
Line2D() Line2D()
[<matplotlib.lines.Line2D object at 0x00000168A43F69E8>, <matplotlib.lines.Line2D object at 0x00000168A40294A8>]

Axes
This is what you think of as ‘a plot’, it is the region of the image with the data space (marked as the inner blue box). A given figure can contain many Axes, but a given Axes object can only be in one Figure. The Axes contains two (or three in the case of 3D) Axis objects (be aware of the difference between Axes and Axis) which take care of the data limits (the data limits can also be controlled via set via the set_xlim() and set_ylim() Axes methods). Each Axes has a title (set via set_title()), an x-label (set via set_xlabel()), and a y-label set via set_ylabel()).
这就是你所认为的“一个图”,它是图像的区域,有数据空间(标记为内部蓝色框)。给定的图形可以包含多个 Axes,但给定的轴对象只能包含一个图形。Axes 包含两个(或三个)Axis对象(注意Axes和Axis之间的区别),它们负责数据限制(也可以通过set_xlim()和set_ylim()Axis方法来控制数据限制)。每个轴都有一个标题(通过set_title()设置)、一个x标签(通过set_xLabel()设置)和一个通过set_yLabel()设置的y标签集。
1. Axes容器的属性:
| Axes 属性 | 说明 |
|---|---|
| artists | A list of Artist instances |
| patch | Rectangle instance for Axes background |
| collections | A list of Collection instances |
| images | A list of AxesImage |
| legends | A list of Legend instances |
| lines | A list of Line2D instances |
| patches | A list of Patch instances |
| texts | A list of Text instances |
| xaxis | matplotlib.axis.XAxis instance |
| yaxis | matplotlib.axis.YAxis instance |
2. Axes对象提供的创建其他Artist对象的方法
| Axes的方法(Helper method) | 所创建的对象(Artist ) | 添加进的列表(Container) |
|---|---|---|
| ax.annotate - text annotations | Annotate | ax.texts |
| ax.bar - bar charts | Rectangle | ax.patches |
| ax.errorbar - error bar plots | Line2D and Rectangle | ax.lines and ax.patches |
| ax.fill - shared area | Polygon | ax.patches |
| ax.hist - histograms | Rectangle | ax.patches |
| ax.imshow - image data | AxesImage | ax.images |
| ax.legend - axes legends | Legend | ax.legends |
| ax.plot - xy plots | Line2D | ax.lines |
| ax.scatter - scatter charts | PolygonCollection | ax.collections |
| ax.text - text | Text | ax.texts |
Axis
These are the number-line-like objects (circled in green).
They take care of setting the graph limits and generating the ticks (the marks on the axis) and ticklabels (strings labeling the ticks).
The location of the ticks is determined by a Locator object and the ticklabel strings are formatted by a Formatter. The combination of the correct Locator and Formatter gives very fine control over the tick locations and labels.
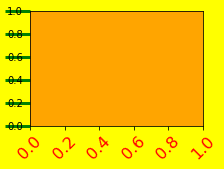
示例代码
import numpy as np
import matplotlib.pyplot as plt

# plt.figure creates a matplotlib.figure.Figure instance
fig = plt.figure()
rect = fig.patch # a rectangle instance
rect.set_facecolor('yellow')

ax1 = fig.add_axes([0.1, 0.3, 0.4, 0.4])
rect = ax1.patch
rect.set_facecolor('orange')


for label in ax1.xaxis.get_ticklabels():
    # label is a Text instance
    label.set_color('red')
    label.set_rotation(45)
    label.set_fontsize(16)

for line in ax1.yaxis.get_ticklines():
    # line is a Line2D instance
    line.set_color('green')
    line.set_markersize(25)
    line.set_markeredgewidth(3)

plt.show()


 551
551


 被折叠的 条评论
为什么被折叠?
被折叠的 条评论
为什么被折叠?
 到【灌水乐园】发言


