


 了解关于matplotlib自动放置轴刻度及标签的行为的缺省配置及设置方法。参考示例文档 Automatically setting tick labels如果没有明确设置刻度位置及标签,matplotlib将尝试根据显示的数据及其范围自动选择它们。 默认情况下,会尝试选择沿轴均匀分布的刻度位置:import matplotlib.pyplot as pltimport numpy as np...
了解关于matplotlib自动放置轴刻度及标签的行为的缺省配置及设置方法。参考示例文档 Automatically setting tick labels
如果没有明确设置刻度位置及标签,matplotlib将尝试根据显示的数据及其范围自动选择它们。 默认情况下,会尝试选择沿轴均匀分布的刻度位置:
import matplotlib.pyplot as plt
import numpy as np
np.random.seed(19680801)

fig, ax = plt.subplots()
dots = np.arange(10) / 100. + .03
x, y = np.meshgrid(dots, dots)
data = [x.ravel(), y.ravel()]
ax.scatter(*data, c=data[1])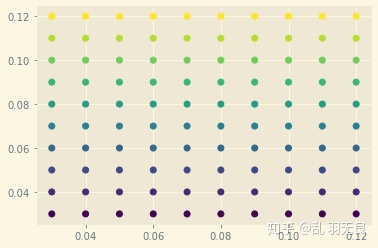
有时,选择均匀分布的刻度会导致奇怪的刻度值。如果想要Matplotlib保持刻度位置在约整数,以下rcParams值可以改变此行为:
print(plt.rcParams['axes.autolimit_mode'])

# Now change this value and see the results
with plt.rc_context({
    'axes.autolimit_mode
最低0.47元/天 解锁文章


 3357
3357


 被折叠的 条评论
为什么被折叠?
被折叠的 条评论
为什么被折叠?
 到【灌水乐园】发言


